Module 03: Excel Add-in Setup
The free OpenDataDSL Excel Add-in connects your spreadsheets to the platform. Once it is set up you can search for data, download timeseries, curves, events and reports into a worksheet, refresh them, and upload changes back, all from a task pane inside Excel.
Learning Objectives
By the end of this module you will be able to:
- Install the add-in from the Microsoft store
- Open the OpenDataDSL task pane and sign in
- Recognise the toolbar and the home screen cards
- Check the add-in settings and the environment you are working in
- Download your first item to confirm everything works
Prerequisites
- A user account in your company's OpenDataDSL tenant (you have signed in to the portal in Module 01)
- One of the supported versions of Excel:
- Excel on Windows (Microsoft 365)
- Excel on Mac (Microsoft 365), or Excel 2019 or later on Mac
- Excel on the web
The add-in is a Microsoft approved Office add-in available from the Microsoft store. Some companies control which add-ins users may install. If you cannot find or add it, ask your IT team.
Step 1: Install the Add-in
-
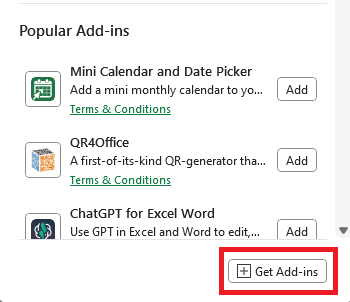
In Excel, go to the Home tab and select the Add-ins button

-
Select the Get Add-ins button
-
In the Office Add-ins dialog, select STORE and type
opendatadslorodslin the search box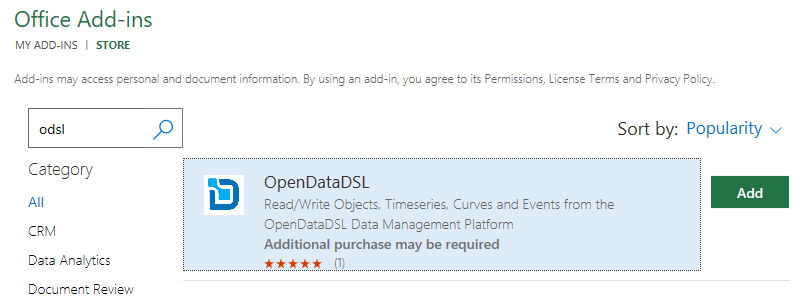
-
Select Add next to the OpenDataDSL add-in
When it is installed, a Show Dashboard button appears in an OpenDataDSL group on the Home tab.
Step 2: Open the Dashboard and Sign In
- On the Home tab, select Show Dashboard. The OpenDataDSL task pane opens on the right of the worksheet
- The first time, you are asked to log in. Use the same corporate credentials you use for the Web Portal
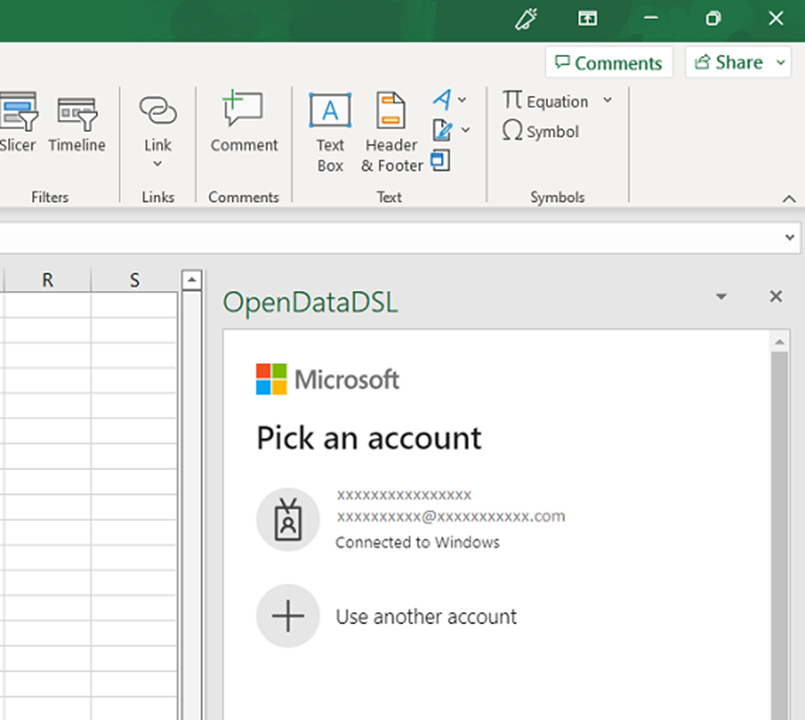
Use Show Dashboard again whenever you want to show or hide the task pane.
Step 3: Get to Know the Task Pane
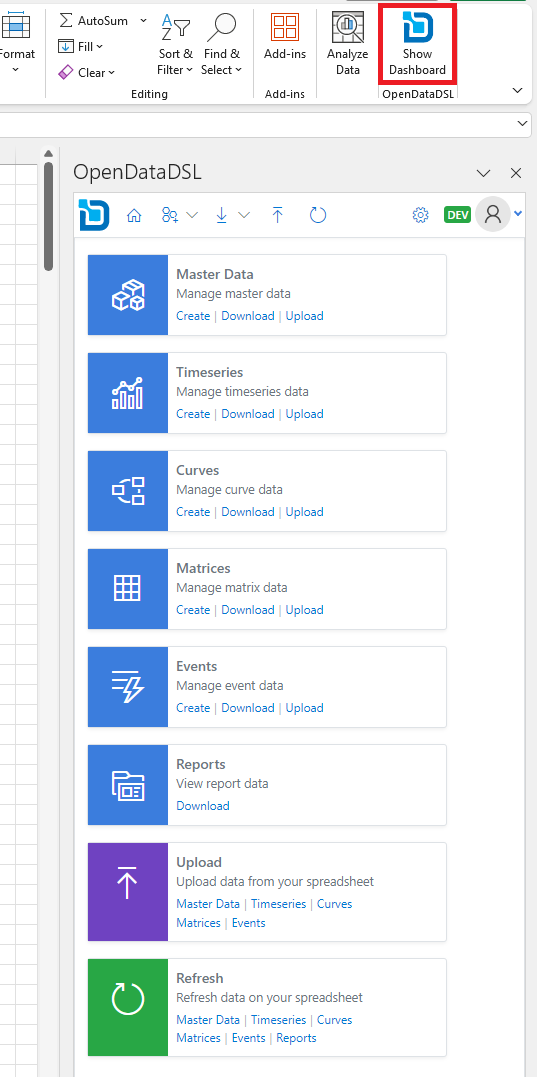
The toolbar
| Button | What it does |
|---|---|
| Home | Goes back to the home screen |
| Create | Commands to create new master data, timeseries, curves and events |
| Download | Commands to download master data, timeseries, curves, events and reports |
| Upload | Uploads new or changed data from your worksheet |
| Refresh | Refreshes the data in your worksheet from the platform |
| Settings (gear icon) | The add-in settings |
| Your profile picture | A menu with logout and copyright information |
The home screen cards
Each kind of data has a card with quick links:
| Card | Links |
|---|---|
| Master Data, Timeseries, Curves, Matrices, Events | Create, Download, Upload |
| Reports | Download |
| Upload | Upload any kind of data from your spreadsheet |
| Refresh | Refresh any kind of data on your spreadsheet |
The cards and the toolbar lead to the same screens, so use whichever you prefer.
Step 4: Check the Settings and Environment
Select the Settings (gear) icon to see the add-in settings.
If your company has more than one data environment, such as production and a test environment, make sure you are working in the right one before you upload anything. In the screenshot above, the badge next to the gear icon shows the current environment (DEV).
If your administrator has set up a training or test environment, select it before doing the exercises in Modules 04 and 05, so that practice uploads never reach production data.
Step 5: Find and Download Your First Item
- On the home screen, select Download on the Timeseries card
- Choose the public source
- Type
ECB EURGBPinto the search box. Each extra word narrows the list - On the
#ECB_FX.EURGBP:SPOTrow, select the download icon
The values are written into your worksheet. If you see them, the add-in is installed, signed in and working.
Search tips
The search box works the same way as in the portal: words are matched against the id, name and description, and all of them must be present.
| You type | You find |
|---|---|
europe | usa | Either word |
europe -potato | europe but not potato |
(europe | usa) potato | potato and either europe or usa |
#wheat | Items tagged wheat |
location=belgium | belgium anywhere in the location field |
Troubleshooting
| What you see | What to try |
|---|---|
| No Show Dashboard button | Check that the add-in was added (Step 1) and look in the OpenDataDSL group of the Home tab |
| Log-in fails | Use the same company account as the portal. If the portal works but Excel does not, ask your IT team |
| The data you expect is missing | Check the source (public or private) and the environment you are in |
| You made a mistake on extracted data | Excel's undo (CTRL+Z) reverses your last action on data the add-in extracted |
Exercise
- Install the add-in and sign in
- Open the Settings and note which environment you are in
- Download
#ECB_FX.EURGBP:SPOTinto a new worksheet - Use the search box to find all the ECB timeseries for the euro against the US dollar or the Japanese yen, using the
|operator
Summary
| Task | How |
|---|---|
| Install | Home, Add-ins, Get Add-ins, STORE, search opendatadsl, Add |
| Open the task pane | Home, Show Dashboard |
| Sign in | Same corporate credentials as the portal |
| Check the environment | Settings (gear icon) and the environment badge |
| Find data | A card's Download link, then search |
Further reading: Excel Add-in guide, Finding data in Excel
In Module 04 you will download, edit and upload events. Module 04 lives in the Technical track but needs no coding.