Module 02: Finding & Viewing Data
In this module you will find data in the portal and look at it: open master data records, chart a timeseries over different ranges, and step through the daily versions of a forward curve.
Learning Objectives
By the end of this module you will be able to:
- Find master data records and data items with filters and search terms
- Open a timeseries, chart it and read its values and properties
- Open a forward curve, choose an ondate and read its contracts
- Keep the items you use often in a favourite group
Prerequisites
- You have completed Module 01
This module uses the public ECB foreign exchange rates, for example #ECB_FX.EURGBP:SPOT, which every tenant can see. If your developers have set up the training scenario from the Technical track, you can also look at the MY.GAS.HUB record and its data, such as MY.GAS.HUB:SETTLEMENT_PRICE.
Step 1: Find a Master Data Record
- Go to Master Data
- Choose the source: public for OpenDataDSL's data, or private for your company's own
- Type
ECB EURGBPinto the search box, or use Add filter to filter on a property such as source - Select the
#ECB_FX.EURGBPrecord in the list
The record opens showing its properties and the data items attached to it. Selecting a data item lets you inspect and chart that data.
Remember that all the words you type must match. ECB alone finds every ECB record; ECB EURGBP finds just the one you want. See Module 01 for the other search operators.
Step 2: Browse Data Directly
If you already know roughly which timeseries or curve you want, the Data screen is often quicker. It gives direct access to every timeseries and curve you are entitled to, and lets you filter, find, chart and export.
- Go to Data
- Choose the public source
- Type
EURGBPin the search box - Select
#ECB_FX.EURGBP:SPOT
Step 3: Read a TimeSeries
A timeseries opens with a chart at the top and a table of values underneath.
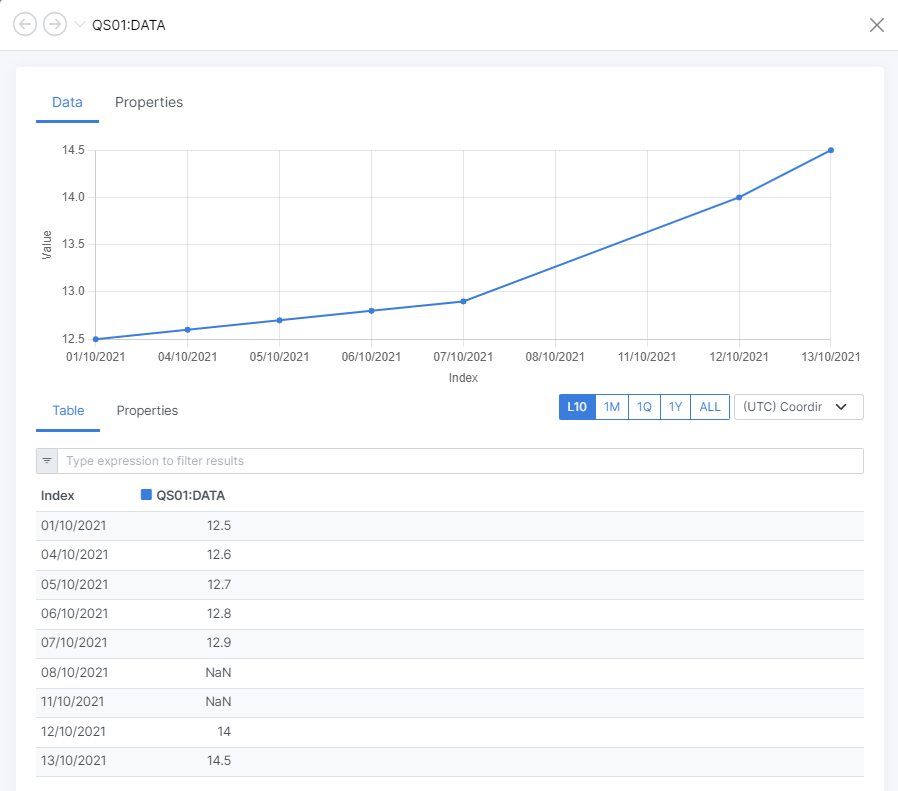
| Part | What it does |
|---|---|
| Data and Properties tabs | Switch between the values and the timeseries' own information, such as calendar, currency and units |
| Range buttons | Choose how much history to show, such as 1M, 1Q, 1Y or ALL in the screenshot above |
| Timezone list | Show the values in another timezone, useful for intraday data |
| Table | Every value with its date. The filter box above it narrows the rows |
A timeseries has a calendar that says which dates should have a value, such as business days only. A date on the calendar with no value is shown as a gap (for example NaN in the table), which is a quick way to spot missing data.
Step 4: Read a Forward Curve
A forward curve is a snapshot of prices for future delivery periods, taken on one valuation date, the ondate. Curves are stored by ondate, and saving a curve again for the same ondate creates a new version of it.
Open a curve from a master data record or the Data screen. Curves are shown with a chart of the contracts, a calendar of ondates and a table:
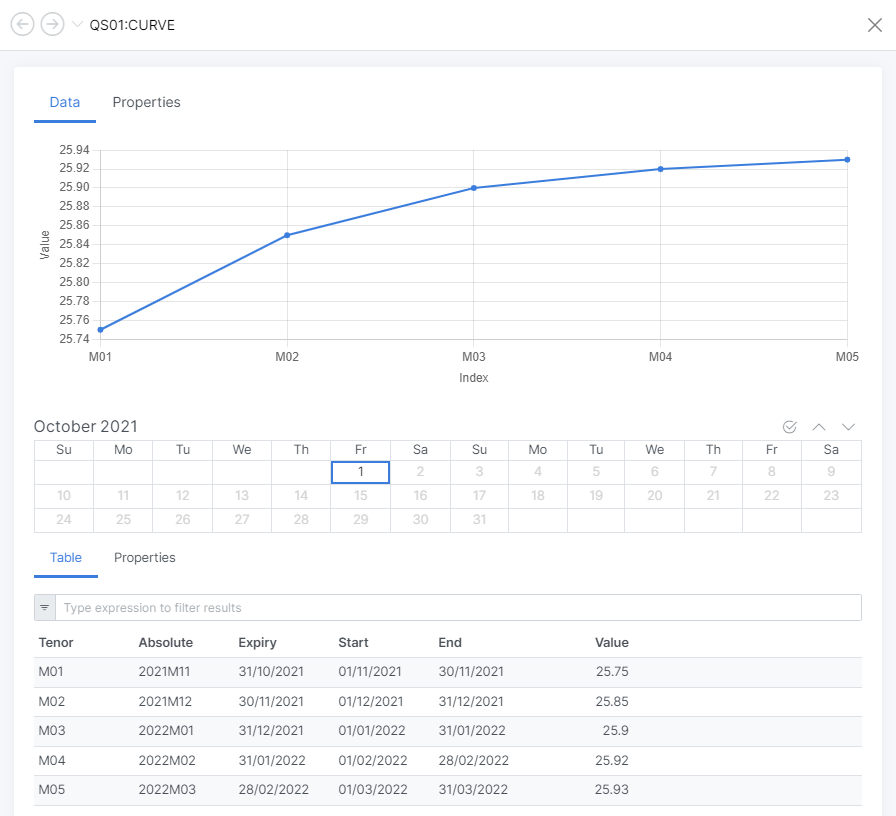
- In the calendar, the highlighted dates are the ondates that have a curve. Select one to show that day's curve
- Read the table: each row is a contract
| Column | Meaning |
|---|---|
| Tenor | The relative contract code, such as M01 (front month) or Q02 |
| Absolute | The actual delivery period, such as 2021M11 |
| Expiry | When the contract expires |
| Start and End | The delivery period dates |
| Value | The price |
M01 always means "next month" from the ondate, so it points to a different delivery month as time passes. The Absolute column tells you which real month it is on the selected ondate.
Recent releases also let you compare versions of a curve and see how a tenor has changed over time. Look for these options on the curve screen in your portal.
Step 5: Keep What You Use
Rather than searching every day, add the items you use often to a favourite group:
- With the item selected, select the Add to group button
- Add it to your
My training itemsgroup from Module 01, or create a new group - Next time, open Favourites on the Data screen and select the group
Step 6: Get the Data Out (optional)
You have several no-code ways to take data away:
- Excel Add-in: pull timeseries and curves straight into a worksheet and refresh them later. This is covered in Modules 03 to 05.
- Export extension: if it is installed in your tenant, Operations, Export data exports timeseries, curves, event lists and master data as CSV, Excel, JSON and other formats, on demand or on a schedule. See Exporting data.
Exercise
- Open
#ECB_FX.EURGBP:SPOTand switch the chart between one month and one year - Open the Properties tab. What calendar does the timeseries use?
- Find the timeseries for the euro against the US dollar from the same source and add it to your favourite group
- Find any public forward curve (try filtering the Data screen for curves) and select two different ondates. How did the front month value change?
- If the training scenario is set up, open
MY.GAS.HUBand list the data items attached to it
Summary
| Task | Where |
|---|---|
| Find a record | Master Data, choose the source, search or Add filter |
| Find a timeseries or curve | Data, choose the source, search |
| Change the chart range | The range buttons above the table |
| Choose a curve date | The ondate calendar on the curve |
| Read contracts | Tenor, Absolute, Expiry, Start, End and Value columns |
| Keep items handy | Add to group, then Favourites |
Further reading: Web Portal guide, Find Data, Extracting Data
In Module 03 you will install and sign in to the Excel Add-in.