Module 06: Dataset Monitoring Dashboard
Every day, data arrives from exchanges, brokers, data vendors and your own systems. The dataset monitoring dashboard tells you, at a glance, whether each delivery arrived, whether it arrived on time and in full, and whether it passed its quality checks. In this module you will learn to read it.
Learning Objectives
By the end of this module you will be able to:
- Explain what a dataset, a dataset feed and a dataset delivery are
- Choose which datasets you monitor
- Read the status icons on each dataset: delivery, score, quality, smart loader and alerts
- Use the dataset tabs to see the completeness and quality check results for a date
- Filter the list to find the datasets that need attention
Prerequisites
- You have completed Module 01
Any dataset your company monitors will do, for example the ECB reference rates dataset ECB.FX.SPOT shown in the screenshots. If the Technical track's training scenario is set up, look for TRAINING.MYGASHUB.SETTLEMENTS and TRAINING.MYGASHUB.NOMINATIONS. Setting up datasets and their checks is a developer or administrator task and is covered in Technical Module 06.
Step 1: Understand the Terms
| Term | What it is | Example id |
|---|---|---|
| Dataset feed | The expected time window for a feed from one provider | ICE.IFEU |
| Dataset | One product within a feed, and how much data is expected each day | ICE.IFEU.B |
| Dataset delivery | The record of what actually arrived for a dataset on one day, with its timing, completeness and quality | ICE.IFEU.B:2024-06-12 |
| Smart loader | An optional loader that re-runs the load until the data is complete |
A dataset id is always PROVIDER.FEED.PRODUCT.
A day in the life of a delivery
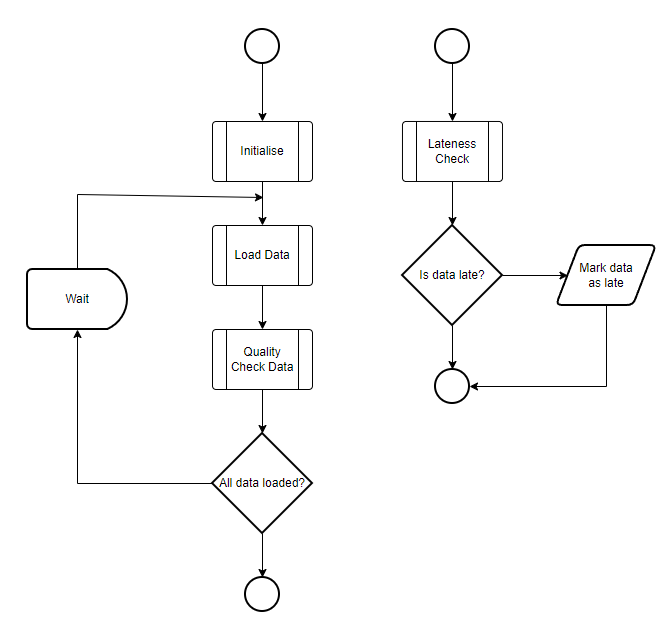
- At the start of the day each monitored dataset gets a new delivery record with status
waitingand a score of 4 - When data arrives, the platform checks for corrections, counts what was loaded against what is expected, and sets the status to
partialorloaded - Quality checks run on the full dataset after each load
- A background check lowers the score if the data is late, and raises an alert if it is late or missing
Step 2: Open the Dashboard and Read the Overview
Open the dataset monitoring dashboard from the portal menu. It has three parts:
- Overview: a summary of the current status of all monitored datasets and alerts
- Dataset list: detailed information about each monitored dataset
- Reports: public and private reports about datasets
On the overview, use the view by dropdown to summarise the status by Provider, Category or Priority. Category and priority are labels your company assigns to datasets, so you can, for example, look at all your high-priority gas datasets together.
Step 3: Choose What You Monitor
The dataset list shows only the datasets you have chosen to monitor.
- Select the Monitored button at the top left
 . The list now shows every dataset you are entitled to see
- Select the add button
 on each dataset you want to monitor
- Select Monitored again to go back to your monitored list
Step 4: Read the Status Icons
Each dataset in the list shows a row of status icons:

| Icon | Values | What it tells you |
|---|---|---|
| Delivery Status | waiting, active, partial, holiday, loaded, late, missing | Where today's delivery is in its lifecycle |
| Delivery Score | 0 to 4 | How promptly the data arrived (see below) |
| Quality Status | unchecked, valid, warning, failed, severe | The overall result of the quality checks |
| Smart Status | waiting, running, loaded, failed, holiday | The smart loader's status, if one loads this dataset |
| Alerts | A number | How many alerts were raised for this dataset |
Delivery scores
| Score | Meaning |
|---|---|
| 4 | Data arrived on time |
| 3 | Up to 1 hour late |
| 2 | Between 1 and 4 hours late |
| 1 | More than 4 hours late |
| 0 | No data expected, for example a holiday |
Look for a delivery status of late or missing, a quality status of failed or severe, a smart status of failed, or an alert count above zero. Partial means some, but not yet all, of the expected data has arrived.
Step 5: Look at One Delivery
Select a dataset to open its tabs on the right of the screen, for the selected date.
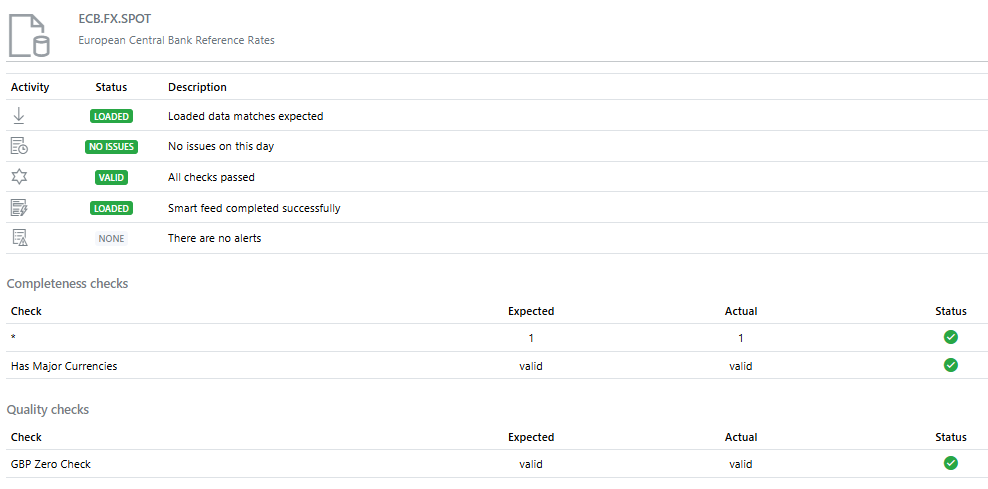
| Tab | What it shows |
|---|---|
| General | The status information for the date, and the result of each completeness check (expected against actual) and quality check |
| Feed | The configuration of the feed this dataset belongs to, and smart loader logging |
| Data | The data for this dataset for the selected date |
| Timeline | Everything that happened to this dataset on the selected date |
| Alerts | The alerts raised for this dataset on the selected date |
| Insights | Insight reports about this dataset |
Other tabs may appear with documentation about the dataset, written by OpenDataDSL or by your own teams.
Hover over a dataset in the list for its actions: Edit opens a side panel to edit the dataset, Remove takes it off your monitored list, and Copy copies its id. Depending on your access rights, the dataset tabs may also offer actions such as running the quality checks again. Ask your data team before changing a dataset's configuration.
Step 6: Filter the List
To find the datasets that need attention quickly, filter the list by:
- Delivery Status or Quality Status, for example only
lateandmissing - Provider, Feed, Product or DSID
- Category or Priority
- Smart Feed Status
- Source: private, common or public
Exercise
- Open the dataset monitoring dashboard and look at the overview by Provider, then by Priority
- Add two datasets to your monitored list, for example
ECB.FX.SPOTand one your team relies on - For each, note the delivery status, score and quality status for today
- Open the General tab of one dataset. How many tenors were expected, and how many arrived?
- Filter the list to show only datasets that are
lateormissing. If any are listed, open the Timeline tab to see what happened
Summary
| Status | Healthy | Needs attention |
|---|---|---|
| Delivery | loaded, holiday | late, missing (partial while still loading) |
| Score | 4 | 3, 2 or 1 |
| Quality | valid | warning, failed, severe |
| Smart loader | loaded | failed |
| Alerts | 0 | any |
Further reading: Dataset Monitoring dashboard guide, Data Monitoring topic, Dataset Monitoring overview
In Module 07 you will run reports and insight reports, including the reports about your datasets.