Dataset Monitoring 🆕
The dataset monitoring dashboard is used to monitor datasets for completeness and quality in real-time.
Layout
The dataset monitoring dashboard contains 3 distinct sections:
- Overview - a summary of the current status of all monitored datasets and alerts
- Dataset list - detailed information about all monitored datasets
- Reports - curated public and private reports specifically about datasets
Dataset Overview Screen
The overview screen gives you a summary of the current status of all the datasets that you care about.
In the view by dropdown, you can filter by:
- Provider
This summarises the status information by the data provider
- Category
This summarises the status information by the custom category that you assign to datasets
- Priority
This summarises the status information by the custom priority that you assign to datasets
Dataset List
The dataset list is the main screen for viewing and changing monitoring information on datasets.
The list of datasets you see are the datasets that you want to monitor.
Adding datasets to the monitored list
To add datasets, click the Monitored button at the top left of your screen.
![]()
The list now shows all the datasets in the system that you are entitled to see.
To add a dataset into your monitored list, click the add ![]() button.
button.
Clicking the Monitored button again takes you back to your monitored datasets list.
Filtering the dataset list
You can filter the dataset list using the following attributes:
- Category
This is a user-definable category that you can assign to your monitored datasets
- Feed
This is the code for the feed (usually used in conjunction with the Provider attribute)
- Delivery Status
This is the current delivery status of the dataset
- DSID
This is the unique id for a dataset
- Quality Status
This is the curreny quality status of the dataset
- Priority
This is a user-definable priority that you can assign to your monitored datasets
- Provider
This is the code for the provider of the data for the dataset
- Product
This is the code for the product, the last part of the dataset id
- Smart Feed Status
This is the current status of smart feeds that load datasets
- Source
This is the location of where the data is stored, usually private, common or public
Dataset information
Each entry in the list of datasets has icons representing various statuses of the dataset

- Delivery Status
This is the current delivery status of the dataset, it can be one of:
- waiting
- active
- partial
- holiday
- loaded
- late
- missing
- Delivery Score
This is the score for the delivery on this day, used for historic reporting of KPIs etc.
- Quality Status
This is the overall quality status of the dataset after running your quality checks, it can be one of:
- unchecked
- valid
- warning
- failed
- severe
- Smart Status
If this is loaded using a smart loader, then this is the current status of the smart loader, can be one of:
- waiting
- running
- loaded
- failed
- holiday
- Alerts
This is the number of alerts raised for this dataset
Dataset actions
Actions you can perform on a dataset become active when you hover over the dataset, they are shown below:
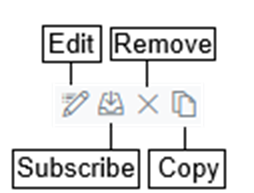
- Edit
This opens a side panel allowing you to edit the dataset
- Subscribe
This button opens a subscribe panel allowing you to subscribe to alerts about this dataset
- Remove
This button removes the dataset from being monitored in dataset monitoring
- Copy
This copies the id of the dataset to the clipboard
Dataset tabs
After clicking on a dataset, the right side of the screen shows information about the dataset which is described in this section.
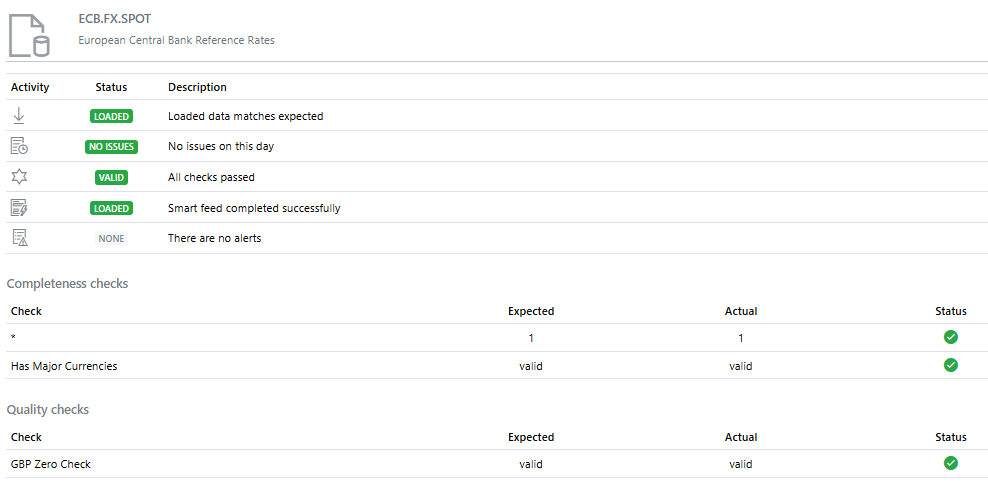
General tab
This tab shows all the basic status information about this dataset for the selected date.
The screenshot below shows all the status information along with detailed information about the completeness and quality checks.
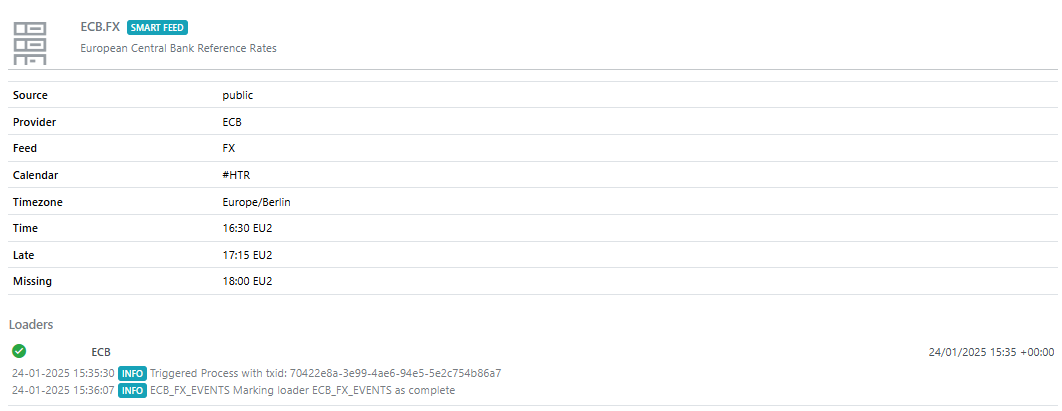
Feed tab
This shows the configuration information for the feed that this dataset belongs to.
The screenshot below shows typical feed information and logging information from a smart loader.
Data tab
This shows the data for this dataset for the selected date.
Timeline tab
This shows all the activity that has happened to this dataset for the selected date.
Alerts tab
This shows any alerts that have been raised for this dataset for the selected date.
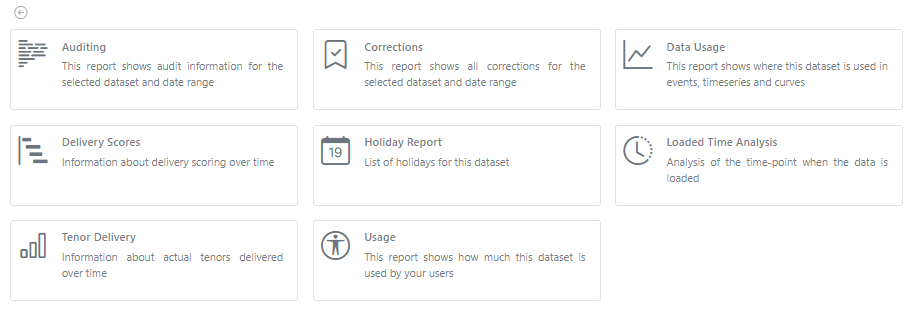
Insights tab
This shows a list of insights (both public and private) that report on various aspects of this dataset.
The screenshot below shows a set of insights for datasets, these will be added to over time, and you can add your own private insights which will be added to this screen if you save the insights with the category: Dataset Monitoring Insights
Other tabs
Other tabs may be shown which represent documentation about this dataset which are either provided by us or by your own internal teams.
More information
Some links with further information about dataset monitoring: