What is Simple Portfolio?
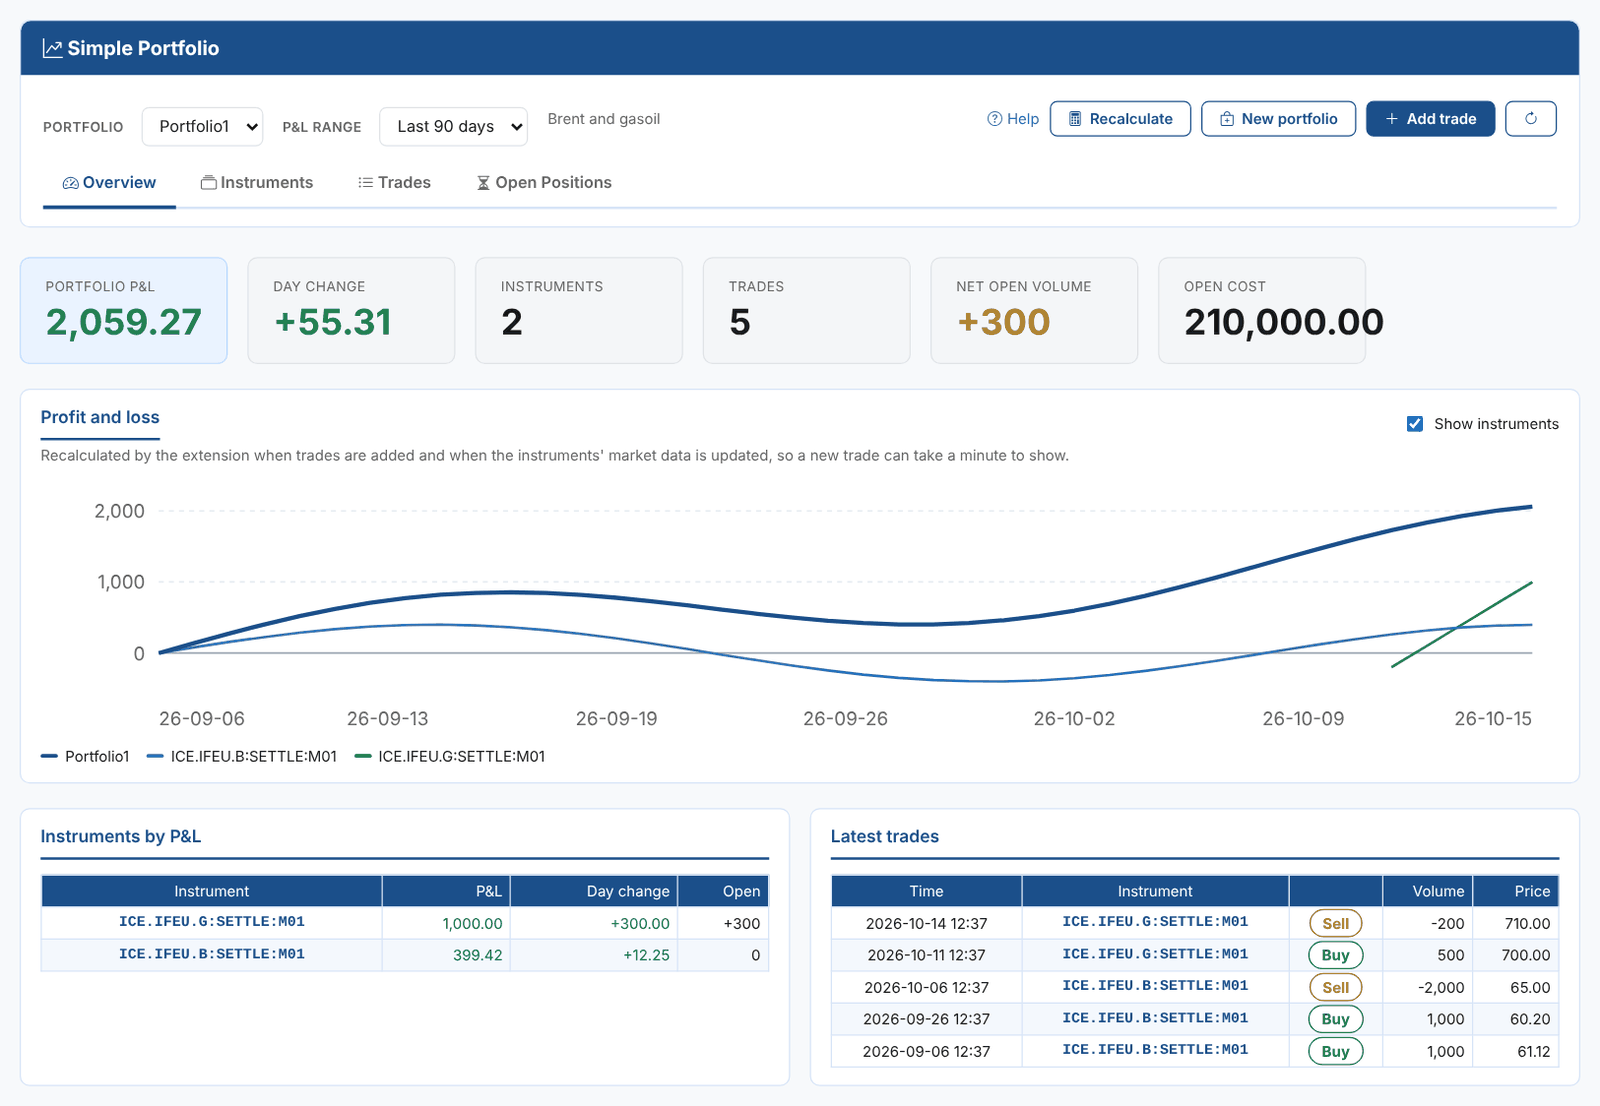
Simple Portfolio keeps an up-to-date profit and loss (P&L) for groups of instruments you trade. You put the instruments in a portfolio, record your trades against them, and the extension works out:
- the daily P&L of each instrument, marked to its market data
- the daily P&L of each portfolio, the sum of its instruments
- the open interest (running net position) after each trade
- the open volume of each trade: what is still open after later trades in the other direction closed it, oldest first
It is also an example extension: everything it does is built from standard platform features (groups, events, smart timeseries, automations, insights), so it is a good place to see how an extension fits together.
The main ideas
| Term | What it is |
|---|---|
| Portfolio | A group (type Portfolio, category Simple Portfolio) of instruments |
| Instrument | A timeseries of market prices, such as a settlement price or a curve tenor like ICE.IFEU.B:SETTLE:M01 |
| Trade | An event in the event list SIMPLE_PORTFOLIO:TRADES: a reference, the instrument, the price and the volume (negative for a sale) |
| P&L | A business-day timeseries: for each trade, (market price - trade price) x volume from the trade date, summed |
| Open interest | The running net volume of an instrument after each trade |
| Open volume | What is left of a trade after later opposite trades closed it, oldest first |
What it adds
| Component | Where | What it does |
|---|---|---|
| Simple Portfolio view | Portal menu, Extensions | Portfolios, instruments, trades, open positions and P&L charts. See Using Simple Portfolio |
| Trade Report insight | Insights | Trades in a date range, by instrument, by day and the largest trades. See Insights |
| Open Trade Positions insight | Insights | Open positions, their cost, by instrument and by age |
| Simple Portfolio Chart Widget | Dashboards | A portfolio's P&L chart for a dashboard |
| Recalculation automations | Automations | Recalculate when trades are added or market data changes. See How it works |
Getting started
- Install the Simple Portfolio extension in your environment. The install creates the
SIMPLE_PORTFOLIOmaster data object and the automation that recalculates when trades are added. - Open Extensions > Simple Portfolio and click New portfolio. Give it a name and, optionally, its instruments.
- Click Add trade to record a trade against one of the portfolio's instruments.
- After a minute, reload: the trade's P&L, open interest and open volume have been calculated, and the portfolio's P&L chart shows the result.
tip
The P&L of an instrument can only be calculated where it has market data. If a chart stays empty, check that the instrument id is right and that its timeseries has values from the trade date onwards.