Using Simple Portfolio
Open Extensions > Simple Portfolio in the portal. At the top you pick the Portfolio and the P&L range for the charts (last 30 days, last 90 days, last year, year to date or all). The cards under the header show, for the selected portfolio:
| Card | Shows |
|---|---|
| Portfolio P&L | The latest value of the portfolio's P&L timeseries |
| Day change | The change from the previous business day |
| Instruments | How many instruments the portfolio has |
| Trades | How many trades there are on those instruments |
| Net open volume | The open volume of all trades, buys less sales |
| Open cost | Price x open volume, summed over the open trades |
Overview
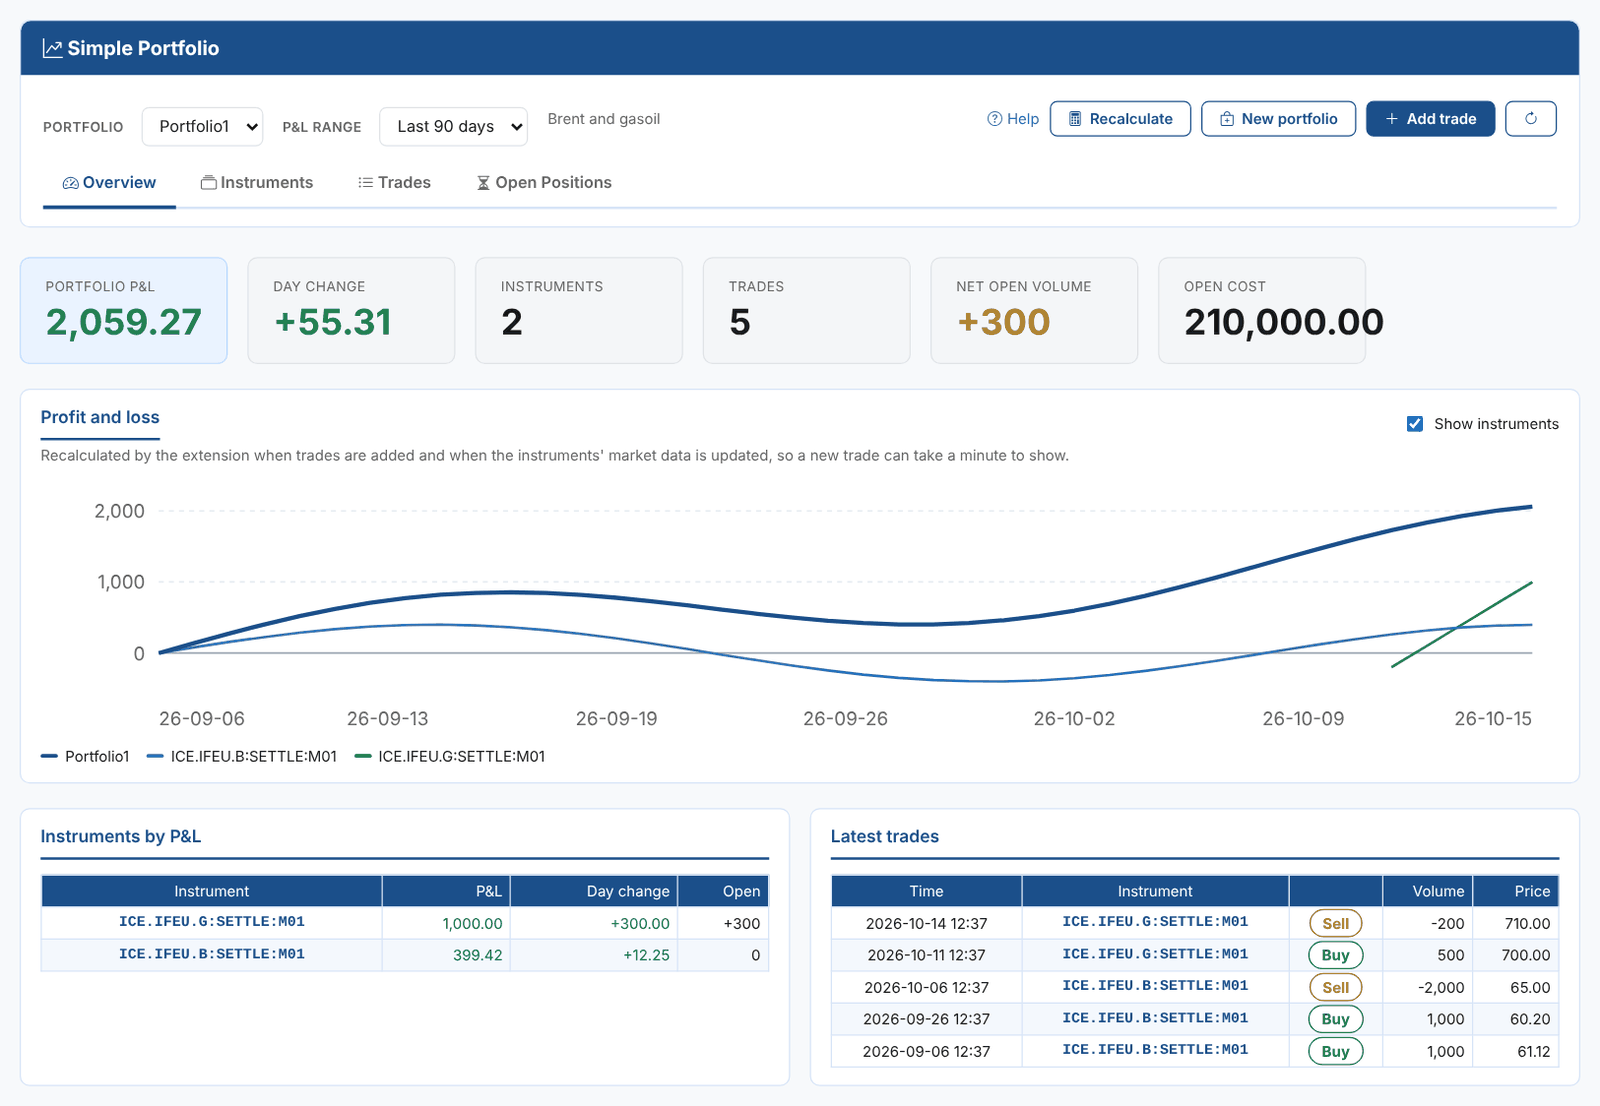
The Profit and loss chart shows the portfolio's P&L over the selected range. Tick Show instruments to add a line for each instrument. Hover over the chart to see the values for a day.
Below the chart, Instruments by P&L lists the instruments with the largest P&L (click one to open it on the Instruments tab), and Latest trades shows the five most recent trades.
Creating a portfolio
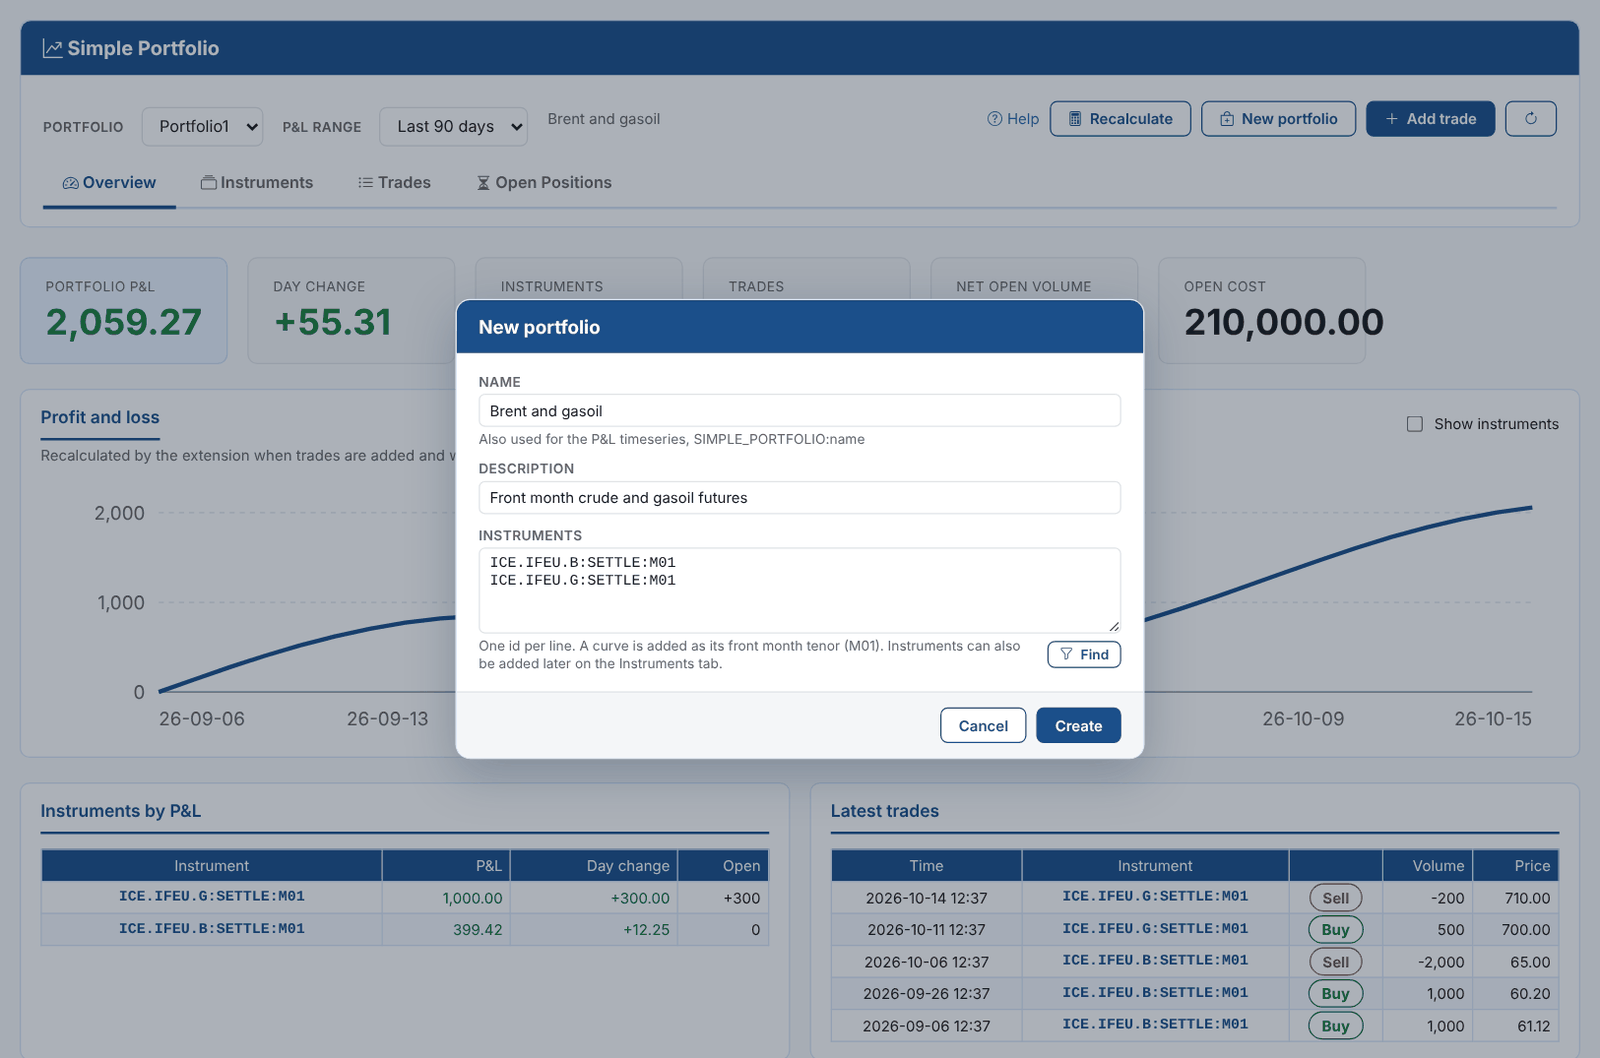
Click New portfolio and enter:
- Name: must be unique. The portfolio's P&L is stored as the timeseries
SIMPLE_PORTFOLIO:name. - Description: optional.
- Instruments: optional, one instrument id per line. Find opens the data finder (see Finding an instrument) and adds what you pick as a new line. You can add instruments later.
Instruments
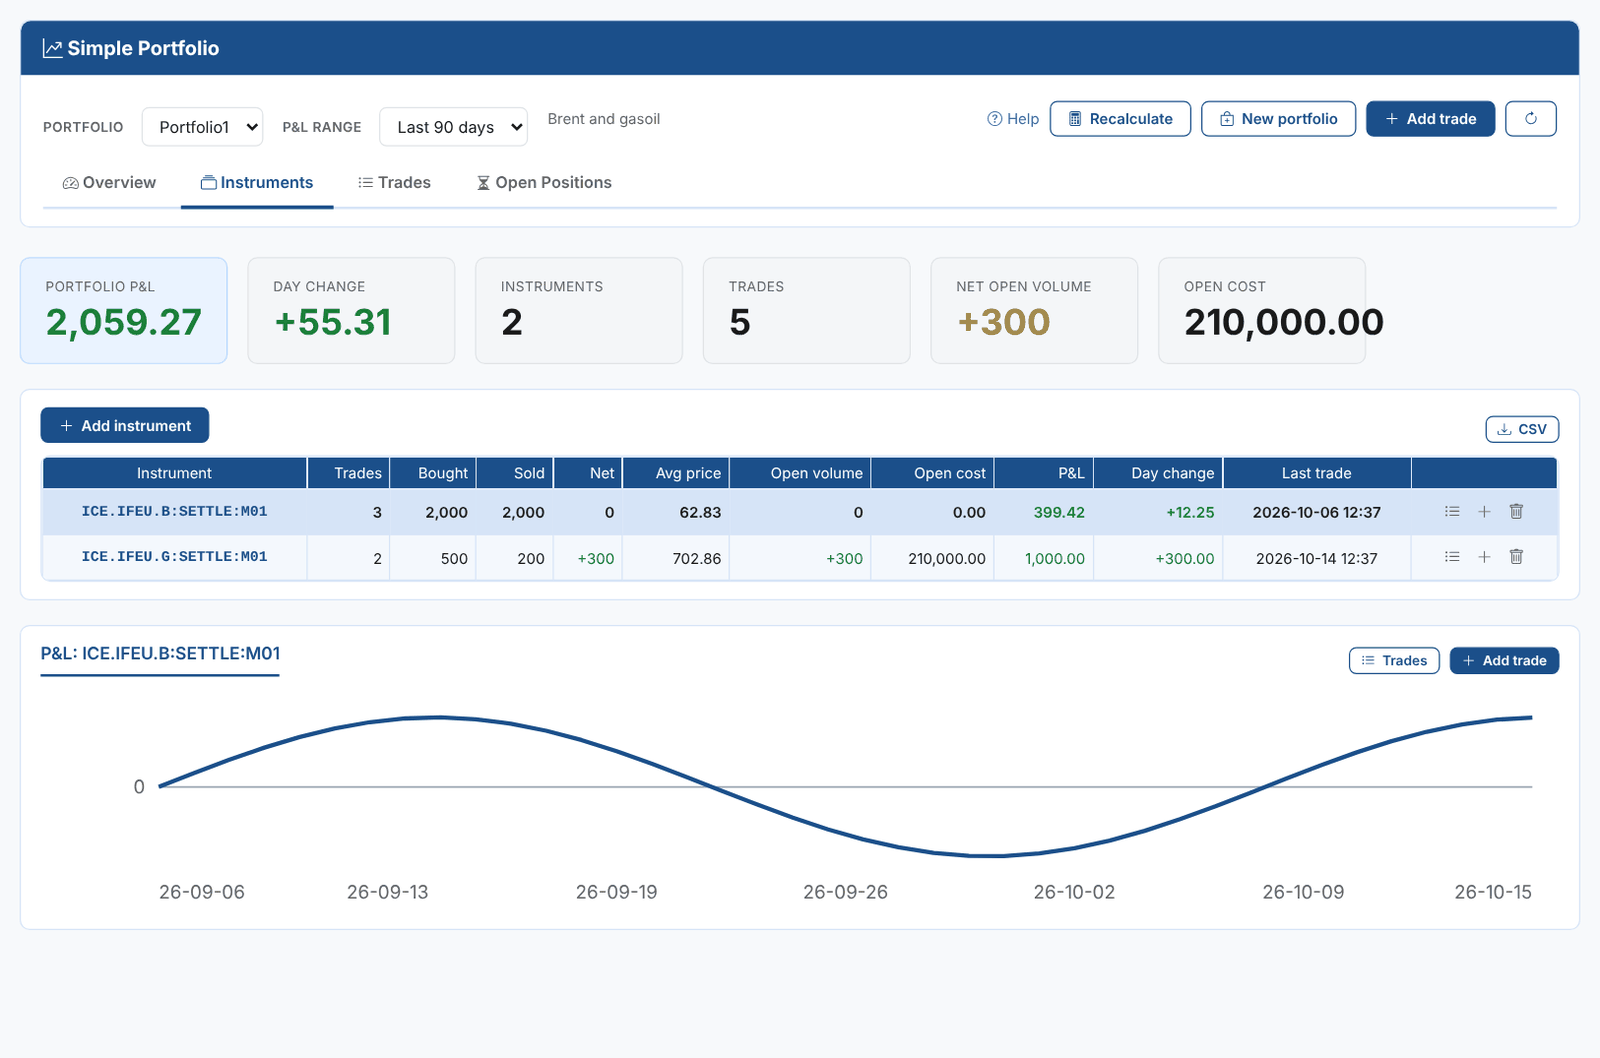
The Instruments tab has a row for each instrument in the portfolio:
| Column | Meaning |
|---|---|
| Trades | The number of trades on the instrument |
| Bought, Sold, Net | Volume bought, volume sold and the difference |
| Avg price | The volume-weighted average traded price |
| Open volume, Open cost | What is still open, and price x open volume |
| P&L, Day change | The latest value of the instrument's P&L and its change from the previous business day |
| Last trade | When it was last traded |
Click a row to see the instrument's P&L chart below the table. The buttons on each row show its trades, add a trade for it, or remove it from the portfolio (its trades are kept, but no longer count towards this portfolio).
Click Add instrument, then either type the instrument id or click Find to look it up.
Finding an instrument
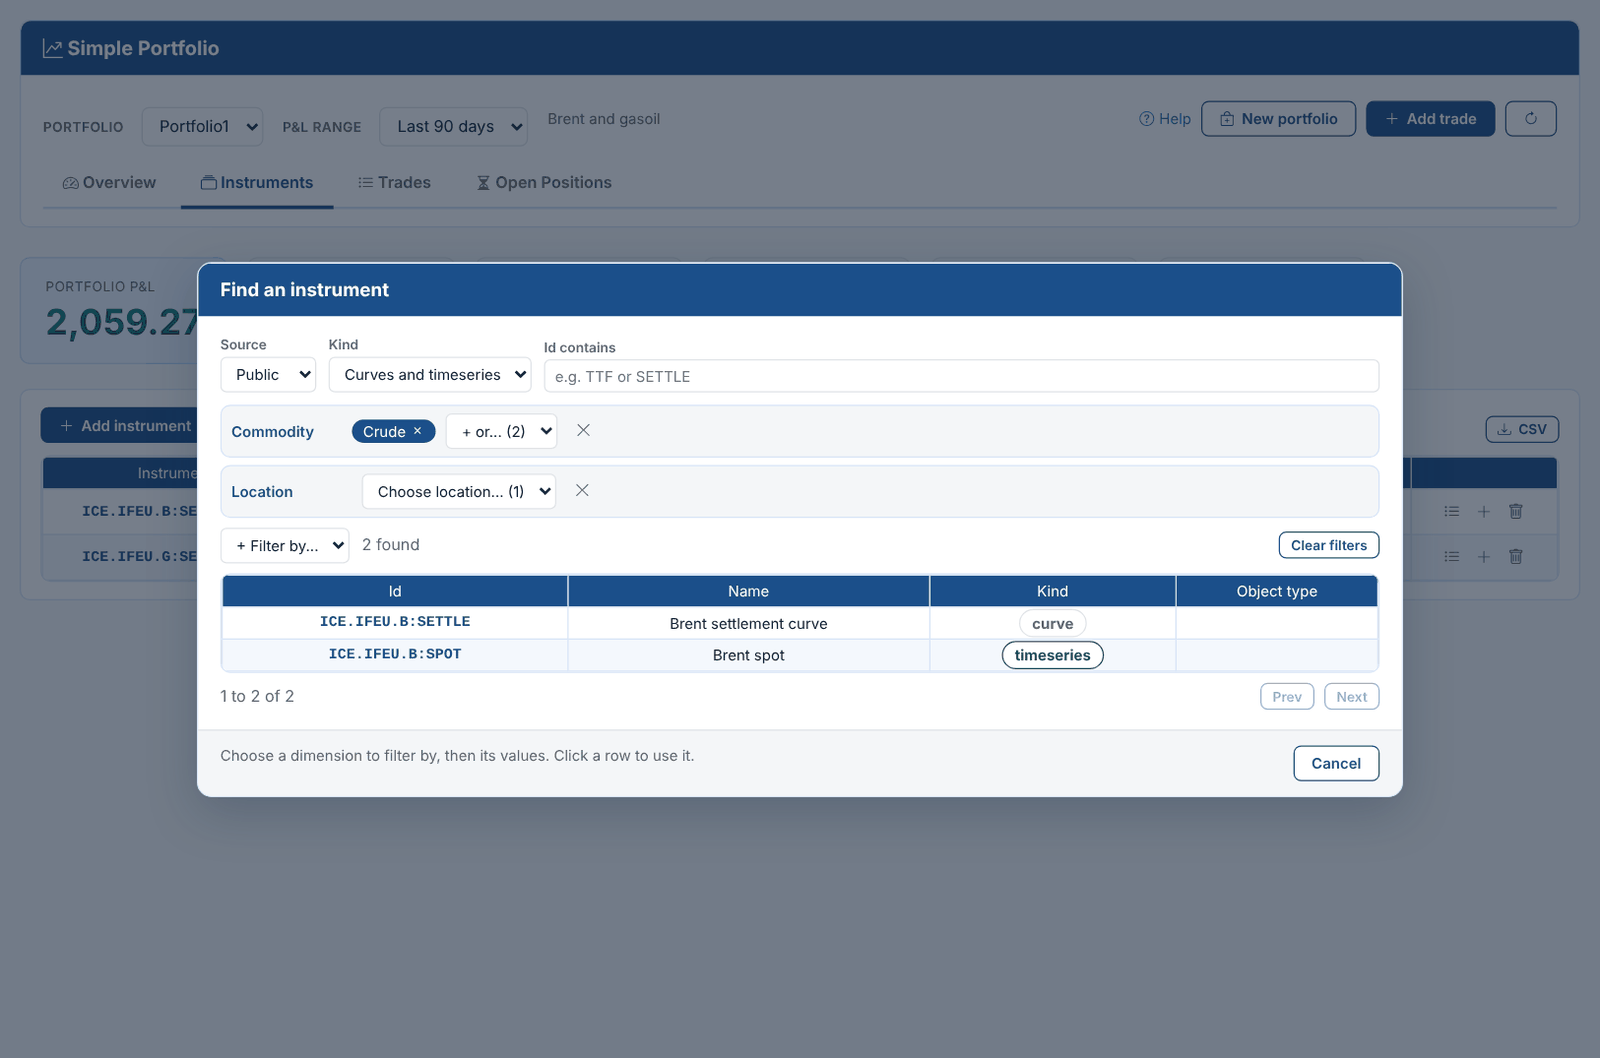
Find opens the same data finder as the Composer extension, which works like the portal's data explorer:
- Choose the Source (public or private) and the Kind (curves, timeseries or both).
- Use + Filter by... to add a dimension, such as source, commodity or location, then choose one or more of its values. Each filter only offers the values that are still possible with the filters above it, and several values of one dimension mean any of them.
- Optionally narrow the list with Id contains (any case).
- Click a row to use it.
The finder remembers its source, kind and filters for next time.
An instrument has to be a timeseries. When you pick a curve, it is added as its front month tenor, for example ICE.IFEU.B:SETTLE:M01 for the curve ICE.IFEU.B:SETTLE: change M01 if you trade another tenor before clicking Add.
Adding or removing an instrument also updates the portfolio's automation, so the portfolio is recalculated when the market data of its instruments changes. See How it works.
Adding a trade
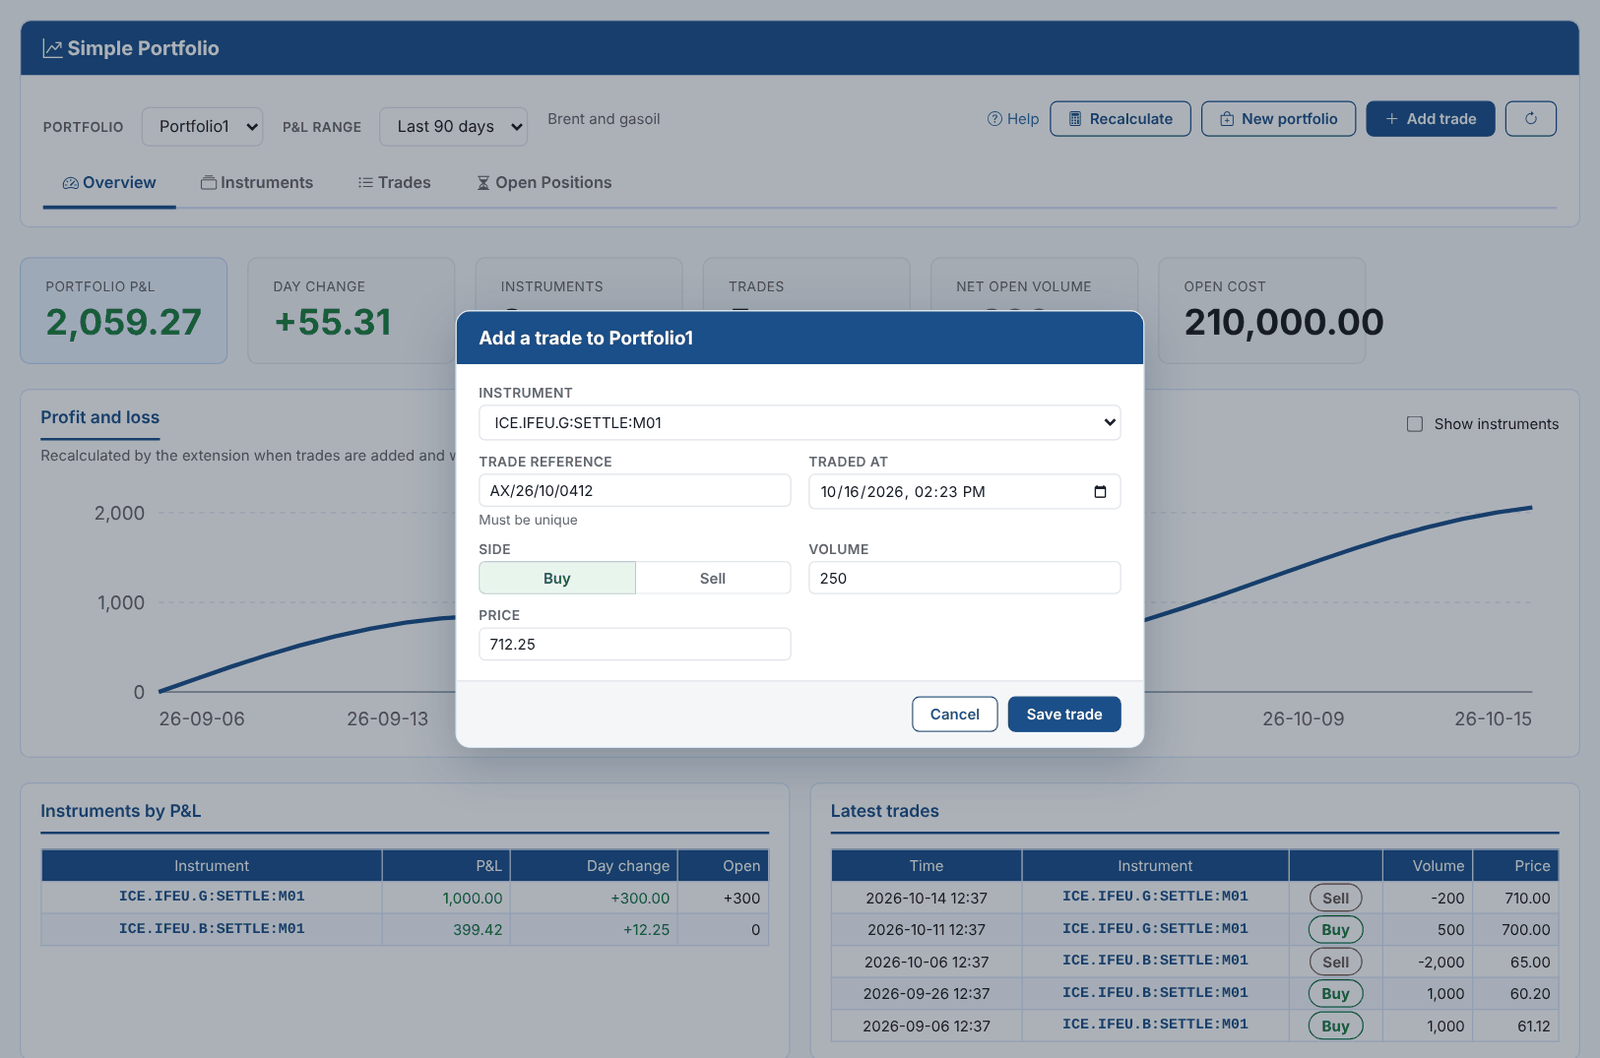
Click Add trade (or the add button on an instrument row) and enter:
- Instrument: one of the portfolio's instruments.
- Trade reference: must be unique; it becomes the trade's id.
- Traded at: the date and time of the trade (your local time).
- Side, Volume and Price: a sale is stored with a negative volume.
The trade is saved straight away. The P&L, open interest and open volume are recalculated in the background by the trades automation, so they show after a minute or so: click the reload button to see them.
Recalculating
The P&L is recalculated by itself when trades are added and when the market data of an instrument is updated. To bring the figures up to date straight away, for example after adding an instrument or correcting market data, click Recalculate and choose:
- This portfolio: recalculates the P&L of the selected portfolio and its instruments.
- All portfolios: recalculates every portfolio, then the open interest and open volume of all trades. This takes longer.
The view waits for the recalculation to finish, then reloads and says how long it took. If it fails, the message from the run is shown; the run is also in the platform's automation log, as a test run of the extension's automation.
Trades
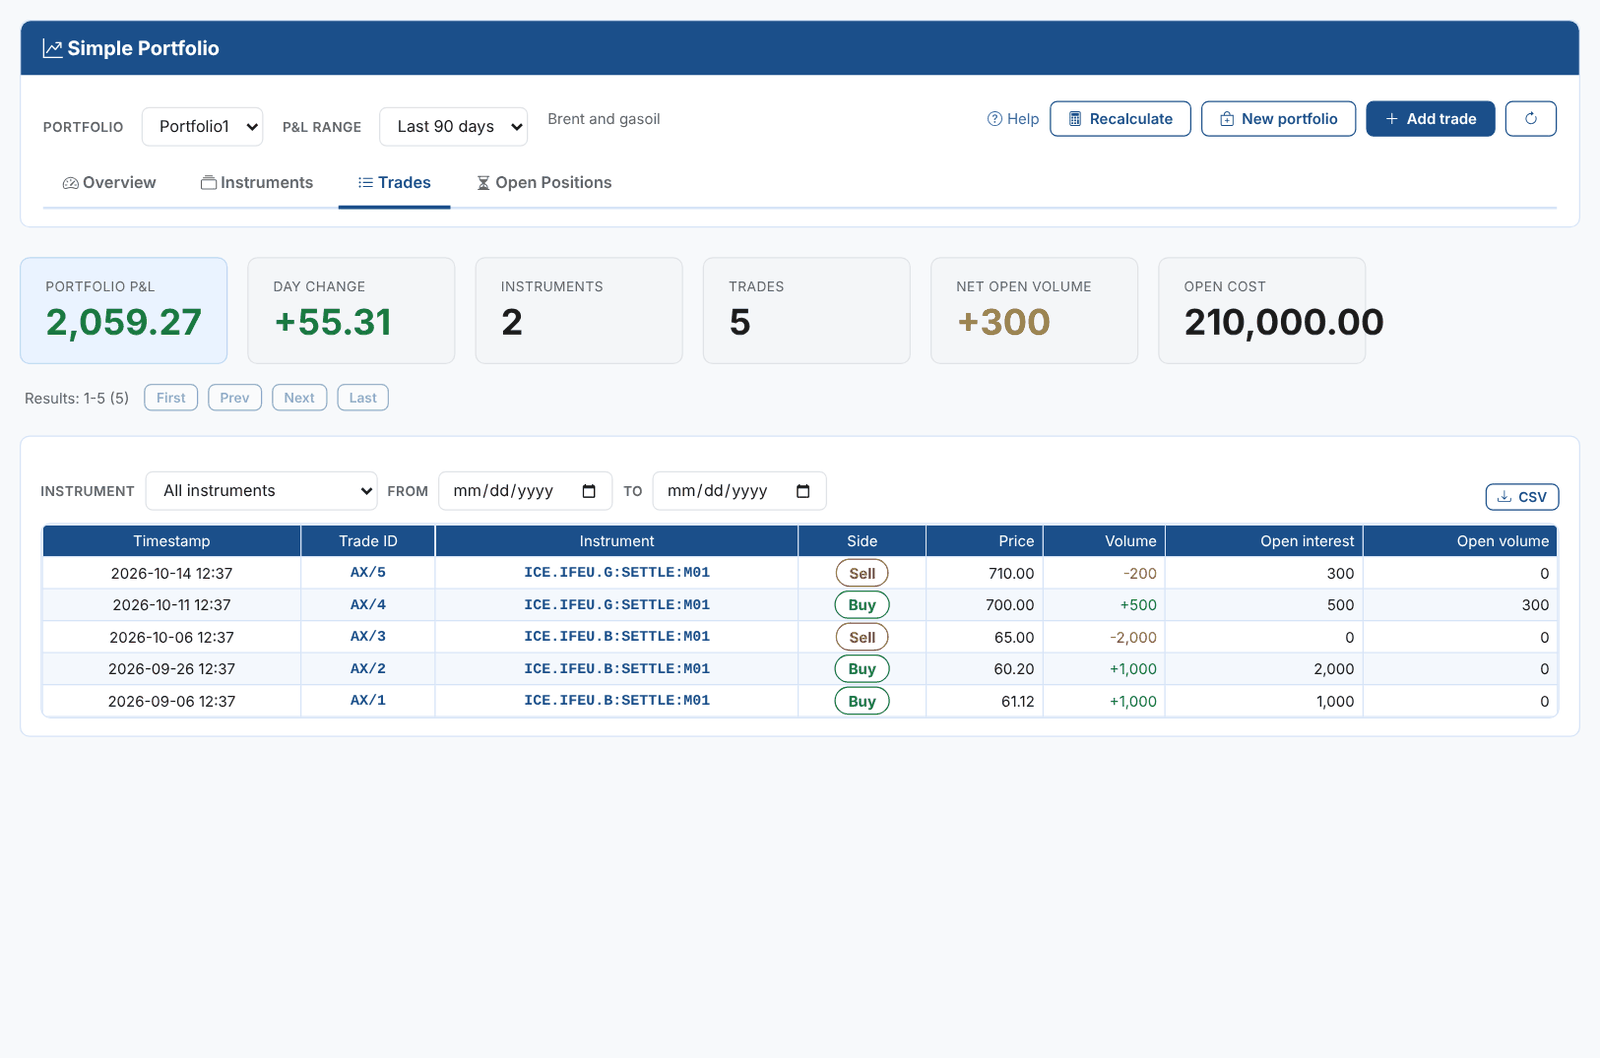
The Trades tab lists every trade on the portfolio's instruments, newest first, 50 to a page (use the pager at the top). Filter by Instrument and by trade date with From and To. CSV downloads every trade that matches the filters, not just the current page.
Open Positions
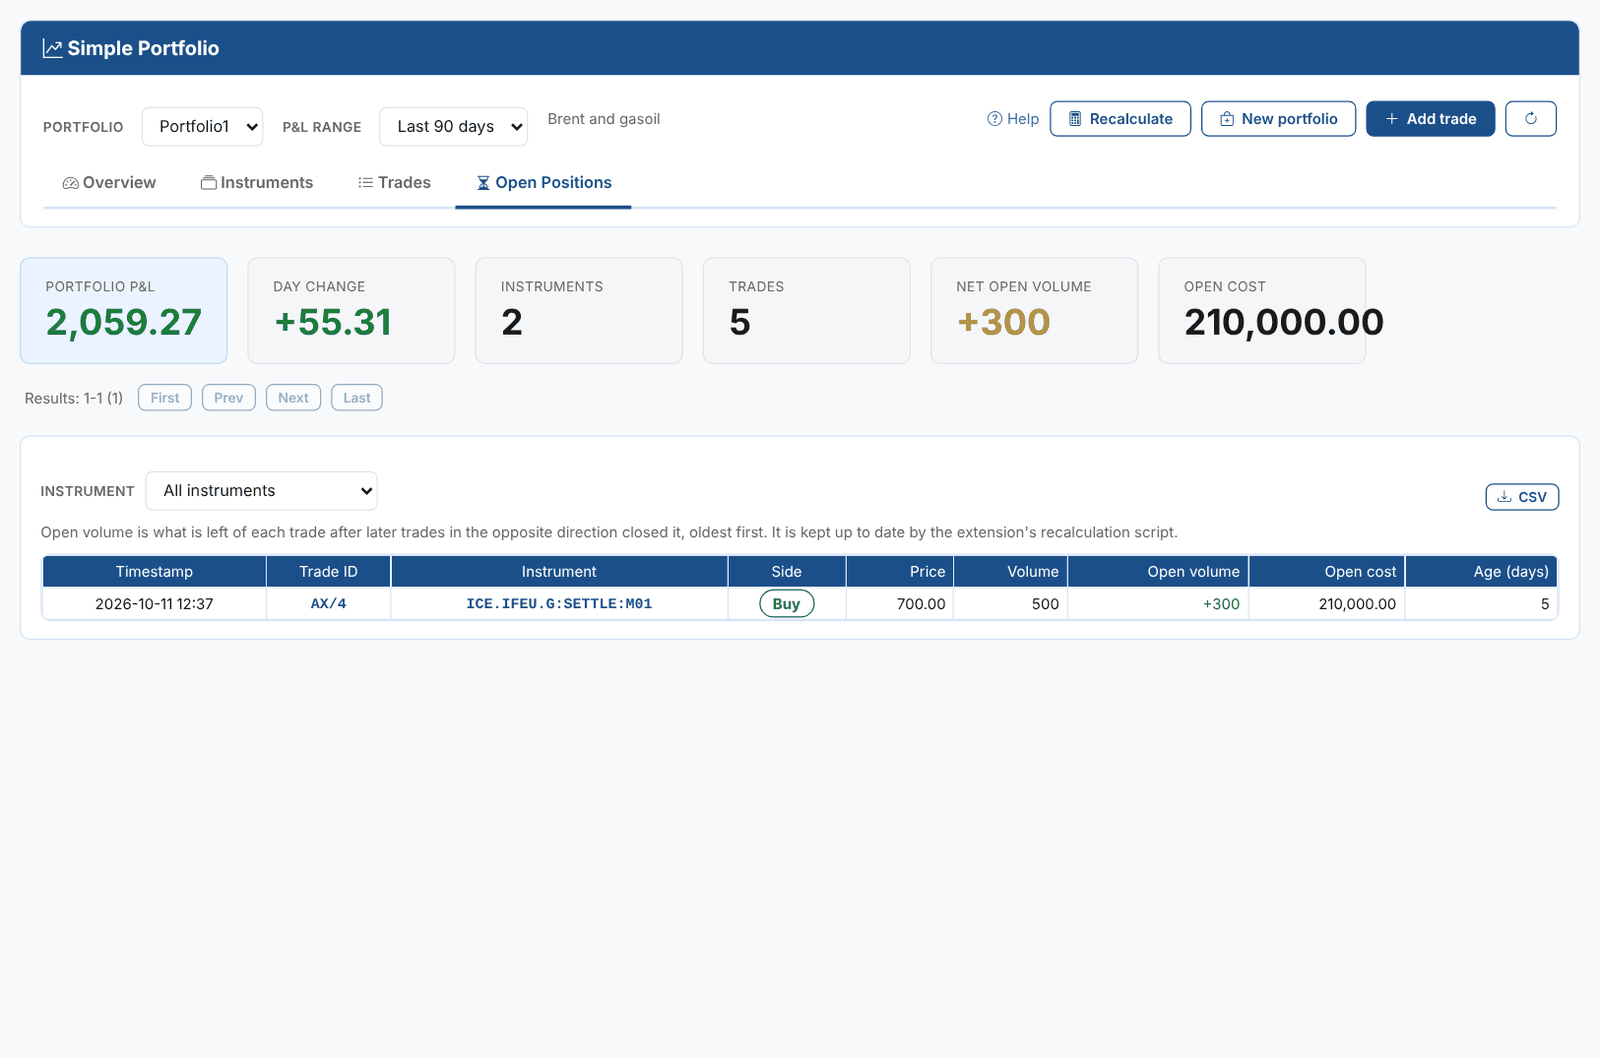
The Open Positions tab lists the trades that are still open, with their open volume, open cost (price x open volume) and age in days. Filter by instrument, and download them with CSV.
Open volume is worked out first in, first out: a sale closes the oldest open purchases of the same instrument first, and the other way round.