Reporting Basics
What is reporting?
Reporting in OpenDataDSL is a way of creating a document which represents a report which can be rendered as HTML, JSON or read into Excel.
Report configuration
A report is based on a user defined configuration with the following properties:
| Name | Description | Type |
|---|---|---|
| _id | Unique Id | String |
| category | The user-defined category of the report used to organise reports | String |
| name | The user-friendly name of the report | String |
| description | A description of the report | String |
| reportType | The type of this report, one of Default, Fixed, Dynamic, Insight or Widget | String |
| script | The name of the script used to run this report | String |
| currency | The optional currency of this report, can be used in the function using #REPORT.currency | String |
| units | The optional units of this report, can be used in the function using #REPORT.units | String |
| timezone | The optional timezone of this report, can be used in the function using #REPORT.timezone | String |
| expression | The expression to use to run this report, e.g. a function name | String |
| template | The mustache template name used to format the results of the report as HTML | String |
| defaultRange | The optional default date range for this report | String |
| hideExcel | Hides this report from the Excel Add-in | Boolean |
| hideList | Hides this report from the Reports list | Boolean |
| odg | OnDate generator for dynamic reports | Object |
| properties | Optional properties to configure and use in the report | Object |
| cacheOptions | Set the SMART caching options for this report | Object |
| tags | A list of tags for the report | List |
Report configurations are versioned, so they also contain version information:
| Name | Description | Type |
|---|---|---|
| _version | The auto-incrementing version number | Integer |
| _user | The user who created this version | String |
| _timestamp | The timestamp of when this version was created | Date |
| _tag | Version tags used to identify this version by a user-friendly name, e.g. PROD | List |
Report
A report contains all the information from the configuration that built/saved it, plus the following:
| Name | Description | Type |
|---|---|---|
| data | The actual report data that was created | Any |
| scriptVersion | The version number of the script that was used to generate this report | Integer |
| errorMessage | An error message if this script failed | String |
| start | The start date of the range used to build this report | Date |
| end | The end date of the range used to build this report | Date |
A report is also versioned, so it contains version information too.
Report Types
Default
This is a basic standard report which uses a script to generate date which is saved in the report.
Script
Script is an optional property that defines the name of the ODSL script used to create a report.
The script must contain functions, like the example below, and you use the expression property to specify which function to call and give the parameters.
Here is an example of a script to create a report
/**
 * @category report
 * Example functions for creating reports
 */

function userMetrics()
    userMetrics = aggregate ${metric}
        match user != null and timestamp >= #START and timestamp <= #END
        group _id="$user", value=sum(1)
    end
end
There are 3 variables created in the report context #START and #END representing the start and end dates of the range used when running this report.
#ONDATE which represents the date of the report.
Expression
Expression is the property that defines the command to run, which is usually the function call to the script, but can be a standalone expression, e.g.
${data:"AAA:TIMESERIES"}
For the example using the script above, our expression would be:
userMetrics()
Fixed
A fixed report is manually updated by a user.
An example configuration for a fixed report:
FIXED_EXAMPLE = Report()
FIXED_EXAMPLE.name = "Fixed Report Example"
FIXED_EXAMPLE.description = "An example of how to use a fixed report"
FIXED_EXAMPLE.reportType = "Fixed"
save FIXED_EXAMPLE
Saving a fixed report - you can save any variable as a report and it will save as data for the report with the same id as the variable, e.g.
FIXED_EXAMPLE = Object()
FIXED_EXAMPLE.title = "This is my new report"
FIXED_EXAMPLE.data = ["This", "is", "some", "data"]
save ${report:FIXED_EXAMPLE}
Dynamic
A dynamic report is a report that dynamically runs the first time it is accessed.
You provide dynamic ondates using an DynamicOnDateGenerator
On Date Generators
Aggregation
Uses an aggregation pipeline to generate the ondates for a report, it takes 3 inputs:
- Service
- Source
- Pipeline
Example:
pipe = pipeline ${event:"public"}
	match event="#OMIE.EL.IBER.DA:AGG_CURVE"
	group _id="$eventtime"
	project !_id, index="$_id"
end

REPORT.withAggregationOnDateGenerator("event", "public", pipe)
Calendar
Uses a calendar to generate the ondates, it requires 2 inputs:
- Calendar code
- Start Date
Example:
STATS_REPORT.withCalendarOnDateGenerator("DAILY", "2024-01-01")
Curve
The ondates are generated using the ondates from a curve, the only input is the curve id
Example:
BALANCE_CHART.withCurveOnDateGenerator("NORDPOOL.EL.DK1.DA:PRICE")
Distinct
Uses a distinct-find to generate ondates. It has 4 inputs:
- Service
- Source
- Field name
- An optional filter
Example:
AGGREGATED_CURVE.withDistinctOnDateGenerator("event", "public", "eventstart", "event='eventlist'")
Filter
Uses a find statement filter to generate the ondates for a report, it requires 4 inputs:
- Service
- Source
- Filter
- Projection
Example:
REPORT.withFilterOnDateGenerator("event", "public", "event='ABC'", "eventstart")
Matrix
Uses the ondates from a matrix, the only input is the matrix id
Example:
CORRELATION_BUBBLE_CHART.withMatrixOnDateGenerator("matrix")
Insight
An insight is a special type of interactive report that doesn't store any data and therefore doesn't have an OnDate.
Usually an insight report will read data directly from any of the OpenDataDSL services using the Javascript Browser SDK.
Widget
A Widget is similar to an Insight report, but can also use a real-time connection to subscribe to data updates.
Formatting a report
You can provide the name of an optional template to format the output of the report.
Template
Template is an optional property and is the name of a mustache template saved as a script in OpenDataDSL.
If you don't specify a template, the resultant report will be json except in the following situation:
If the report is an array of objects, and the objects all have the same property names, a dynamic template is used to show the data as a HTML table.
An example mustache template for the user metrics function:
<h1>Usage Metrics by User</h1>

<h2>{{description}}</h2>

<p>For the range: {{start}} - {{end}}</p>

<table>
    <thead>
        <tr>
            <th>User</th>
            <th>Usage</th>
        </tr>
    </thead>
    <tbody>
        {{# data }}
            <tr>
                <td>{{_id}}</td>
                <td>{{value}}</td>
            </tr>
        {{/ data }}
    </tbody>
</table>
Tools to create a report
- Web Portal
- OpenDataDSL
- REST API
- Select Reports
- Select Private.
- Click the + New button
You will see a sidebar dialog like this to enter details of the report configuration
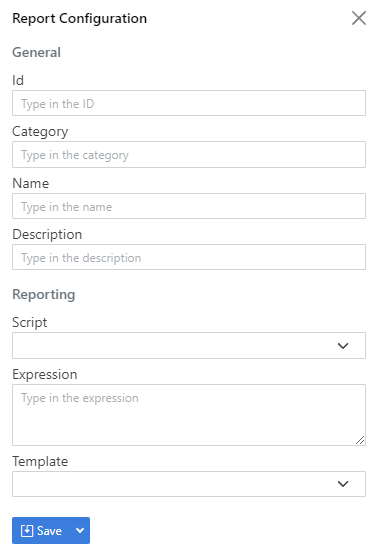
- Enter a unique id for this report in the Id field
- Type a category for this report, this is used to group similar reports together to make them easier to navigate
- Enter a name and description for this report
- Select an ODSL report script from the drop-down list
- Type in the name of the function to run in the expression box, or leave blank if you just need to run the script directly
- Optionally select a template from the dropdown list of mustache template to format this report into HTML.
- Click the Save button to save this configuration
USER_METRICS = Report()
USER_METRICS.category = "Tutorial"
USER_METRICS.name = "User Metrics Summary"
USER_METRICS.description = "Summarise the usage metrics by user"
USER_METRICS.script = "report_functions"
USER_METRICS.expression = "userMetrics()"
USER_METRICS.template = "UserMetricsTemplate"
USER_METRICS.tags = ["tutorial", "example"]

save USER_METRICS
POST https://api.opendatadsl.com/api/report/v1
Authorization: Bearer {{token}}

{
    "_id": "USER_METRICS",
    "_type": "VarReportConfiguration",
    "reportType": "Default",
    "category": "Tutorial",
    "name": "User Metrics Summary",
    "description": "Summarise the usage metrics by user",
    "script": "report_functions",
    "expression": "userMetrics()",
    "tags": ["tutorial", "sample"]
}
Running a report
You can't run a fixed report
There are 2 ways to run a report:
- Dynamically run a report to see what it looks like without saving
- Run and save a report
Dynamically running a report
- OpenDataDSL
- REST API
rep = run report USER_METRICS with "between(2023-01-01,2023-01-31)"
print rep
GET https://api.opendatadsl.com/api/report/v1/private/USER_METRICS:2026-03-10
  ?_range=between(2023-01-01,2023-01-31)
  &_run=true
Authorization: Bearer {{token}}
Run and save a report
- OpenDataDSL
- REST API
- Web Portal
save ${report:"USER_METRICS"}
POST https://api.opendatadsl.com/api/report/v1/private/USER_METRICS:2026-03-10
  ?_range=between(2023-01-01,2023-01-31)
Authorization: Bearer {{token}}
- Select Reports
- Select Public for public reports or Private for your own reports.
- Find the report you want to run by filtering or scrolling
- Specify the date range you want to run the report for using the range selector
- Click the Run button
Caching Options
You can optionally configure how the report is stored using the cacheOptions property on the report configuration.
The following types of caching are supported:
- Never - the report is never cached/stored
- OnDemand - the report is stored the first time the report date is read
- OnSchedule - Cache based on a cron schedule
- External - Report is built and saved by an external app
If you select OnSchedule, you also have to provide a cron expression in the property schedule
Adding a report to Master Data
You can create reports that are attached to Master Data records, these reports will usually be related to the Master Data, e.g. as a special chart of data on the record.
There are 2 ways to add a report to Master Data:
- As an embedded report
- As a link
Master Data embedded report
When you embed a report in a Master Data record, the report is shown as a hyperlink in the portal which will display the report when clicked.
Example of creating an embedded report
AUDIT = InsightReport()
AUDIT.category = "Insights"
AUDIT.name = "Audit Report"
AUDIT.template = "#insight-audit-report"
AUDIT.hideExcel = true
AUDIT.hideList = true
o = ${object:"ICE.NDEX.NLB"}
o.AUDIT = AUDIT
save o
Linked report
When you add a report link reference to a Master Data record, the report shows as a new tab when viewing the Master Data record in the portal.
Example of creating a linked report
cr = InsightReport()
cr.category = "Insights"
cr.name = "Activity Report"
cr.description = "This report shows all object activity"
cr.template = "#insight-object-activity"
cr.hideExcel = true
cr.hideList = true
cr.DSID = "ICE.NDEX.NLB"
cr.OBJID = "ICE.NDEX.NLB"

ref = ref("report", "ICE.NDEX.NLB:Activity")
ref.info = cr

o = ${object:"ICE.NDEX.NLB"}
o.add("Activity", ref)
save o
Renaming reports
When you rename a report configuration, it also renames all the reports that have been generated.
Renaming a report can also change it from a standalone to a master data embedded and vice-versa.
Renaming examples
Renaming a standalone report
rename ${report:"DAILY_EXPORT"} as DAILY_CURVE_EXPORT
Renaming a standalone report to an embedded report
rename ${report:"DAILY_EXPORT"} as "HH_DATA:DAILY_CURVE_EXPORT"
If the master data object does not exist, it will be automatically created
Renaming an embedded report
rename ${report:"HH_DATA:DAILY_CURVE_EXPORT"} as "HH_DATA:CURVE_EXPORT"
Renaming an embedded report - move to another master data object
rename ${report:"HH_DATA:DAILY_CURVE_EXPORT"} as "HH_EXAMPLE:CURVE_EXPORT"
Renaming an embedded report to a standalone report
rename ${report:"HH_DATA:DAILY_CURVE_EXPORT"} as CURVE_EXPORT