What is Auditing?
When something goes wrong on the platform, the evidence is spread over many logs. A scheduled load fails: the scheduler logged that it fired, the process run logged its phases, a script logged a timeout, the saves were audited, an automation tried to send an email, a dataset delivery was marked partial and an alert was raised. Auditing brings all of these logs into one screen, so you can answer questions like:
- What failed in the last 24 hours, and where?
- Who changed this curve, and what did they change?
- Everything one process run did, in order, from the schedule that started it to the alerts it raised.
- What else happened on the platform at the same moment?
- Is this the same problem as yesterday's?
The logs it reads
| Log | Service | What one record is |
|---|---|---|
| Process runs | process-exec | One run of a process: trigger, status, phases and their log |
| Schedules fired | crontablog | The scheduler firing a process, report, export or automation, with when it was due |
| Script runs | scriptlog | A script run by an automation, report or the script service, with its log |
| Automations | automationlog | An automation that ran: what triggered it, the target and the result |
| Queue messages | queuelog | A message sent to a platform queue to run a process, build or report |
| Changes | audit | A create, update or delete: who made it, what changed, and changes the platform refused |
| Dataset deliveries | dataset_delivery | One dataset for one ondate: delivery status, completeness and quality checks |
| Alerts | alert | An alert raised by the platform, a process or a person |
| Fusion AI runs | airun | A Fusion AI playbook run: steps, tokens and failures |
| API requests | metric | One request to the API: method, service, item, status, duration and size |
You only see what your own access allows: every log is read through the normal platform services, as you.
The screen
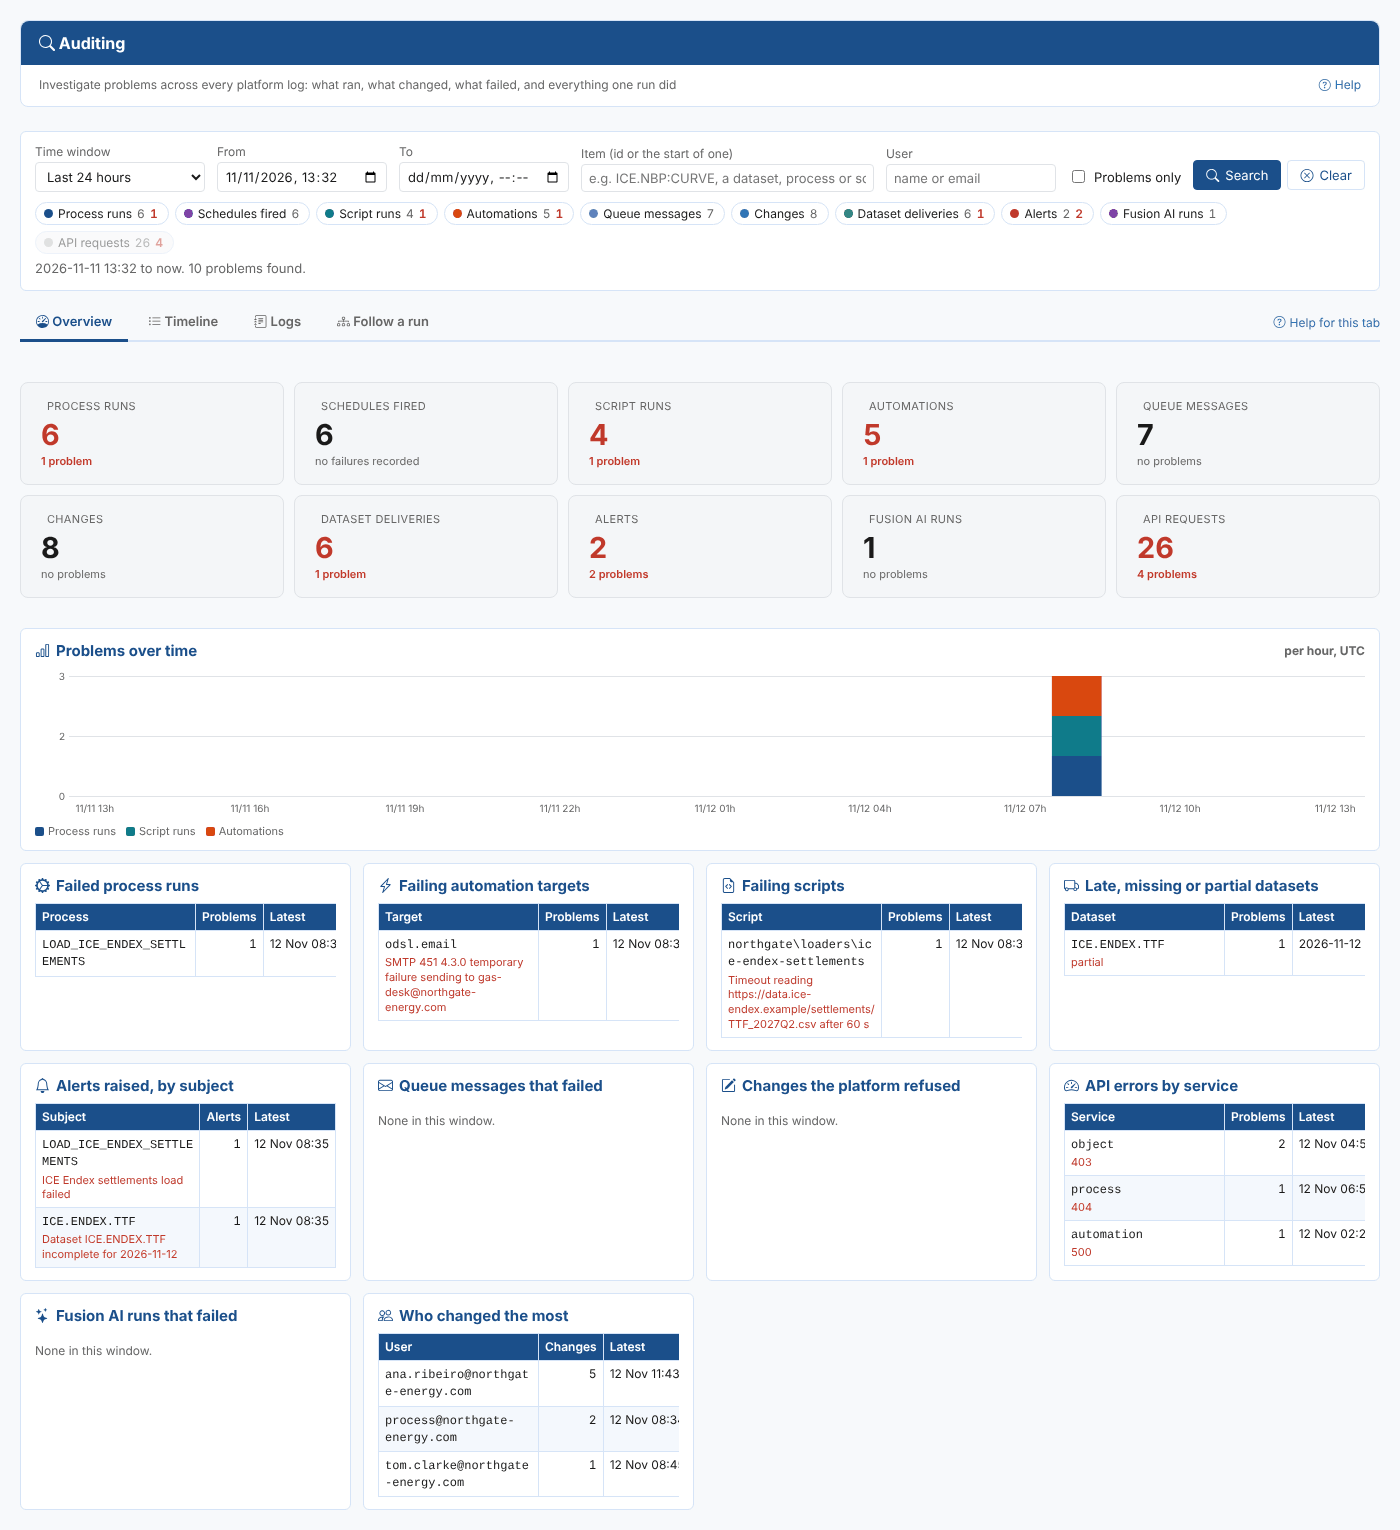
Open Monitor > Auditing. One set of filters at the top drives four tabs.
| Filter | What it does |
|---|---|
| Time window | Last hour, 6 hours, 24 hours, 3 days, 7 days or 30 days, or Custom with From and To |
| Item | An id, or the start of one: ICE.ENDEX.TTF also finds ICE.ENDEX.TTF:SETTLE. Matched against the item each log records (the changed item, the process name, the script, the dataset, the alert subject) |
| User | Part of a name or email. Logs that do not record a user show n/a and are left out |
| Problems only | Only failures: failed runs, scripts and automations, queue messages that could not be sent, refused changes, late, missing or partial deliveries, alerts and API errors |
| Log chips | Select a log to show or hide it; Ctrl-select to show only that log. Each chip shows how many records match and, in red, how many are problems |
API requests are hidden at first, because there is one record for every request. Your choice of logs and time window is remembered in your browser.
| Tab | Use it to |
|---|---|
| Overview | See counts per log, problems over time and the top failures in each log |
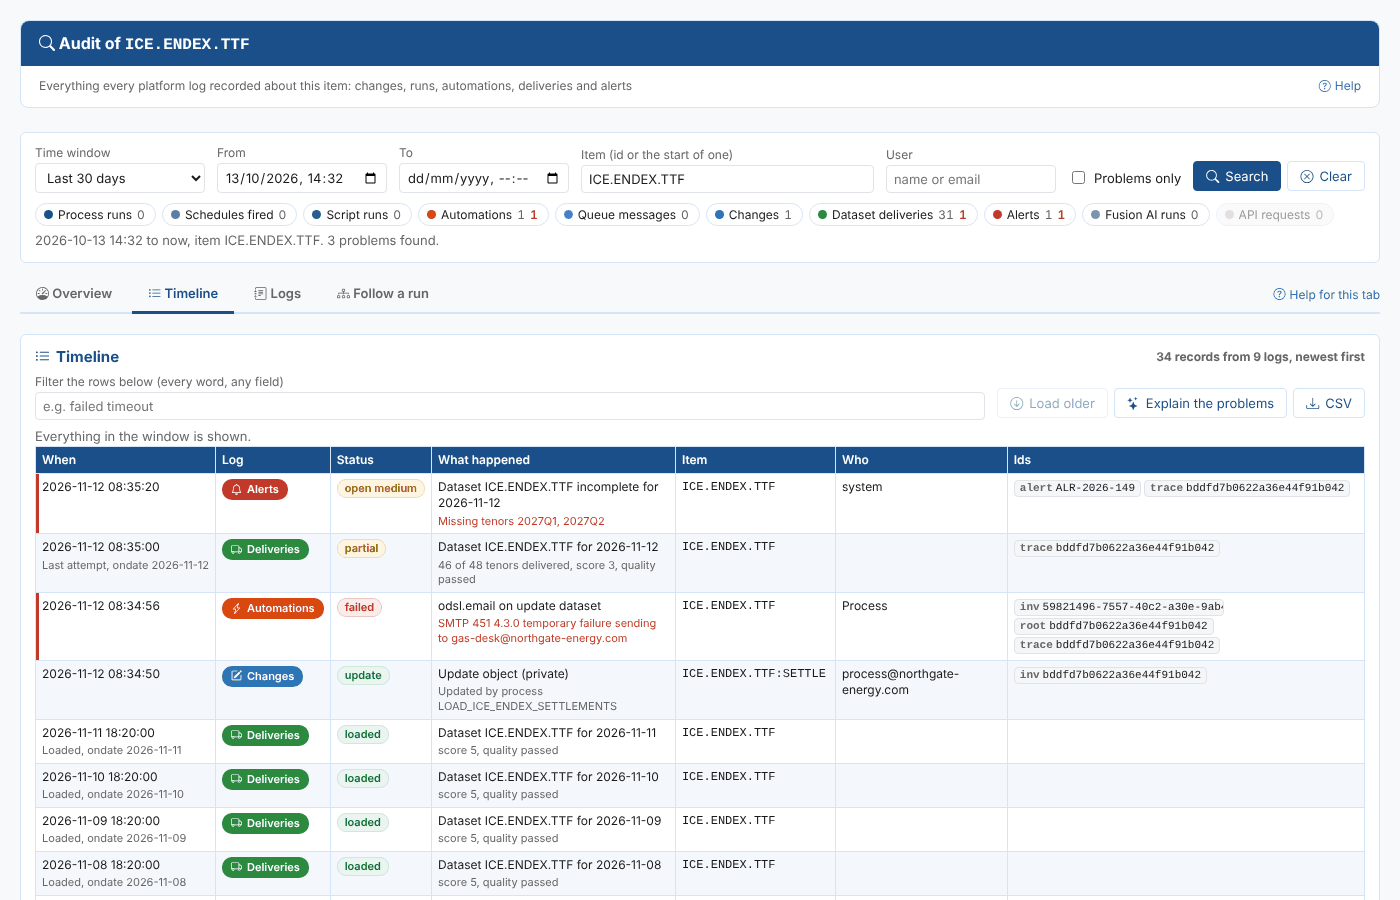
| Timeline | Read every selected log merged in time order. See The timeline |
| Logs | Page through one log at a time. See One log at a time |
| Follow a run | See everything one piece of work did, in every log. See Following a run |
The overview
The cards show how many records each log has in the window, and how many of them are problems. Select a card to see that log on the Timeline.
Problems over time stacks the problems of each log per hour (per day for windows longer than 3 days), in UTC. A spike where several colours meet is usually one incident seen by several logs.
Below it, a table per log lists where the problems are: the processes that failed, the automation targets and scripts that failed with their latest message, the datasets that were late, missing or partial, alerts by subject, failed queue messages, refused changes, API errors by service, failed Fusion AI runs, and who made the most changes.
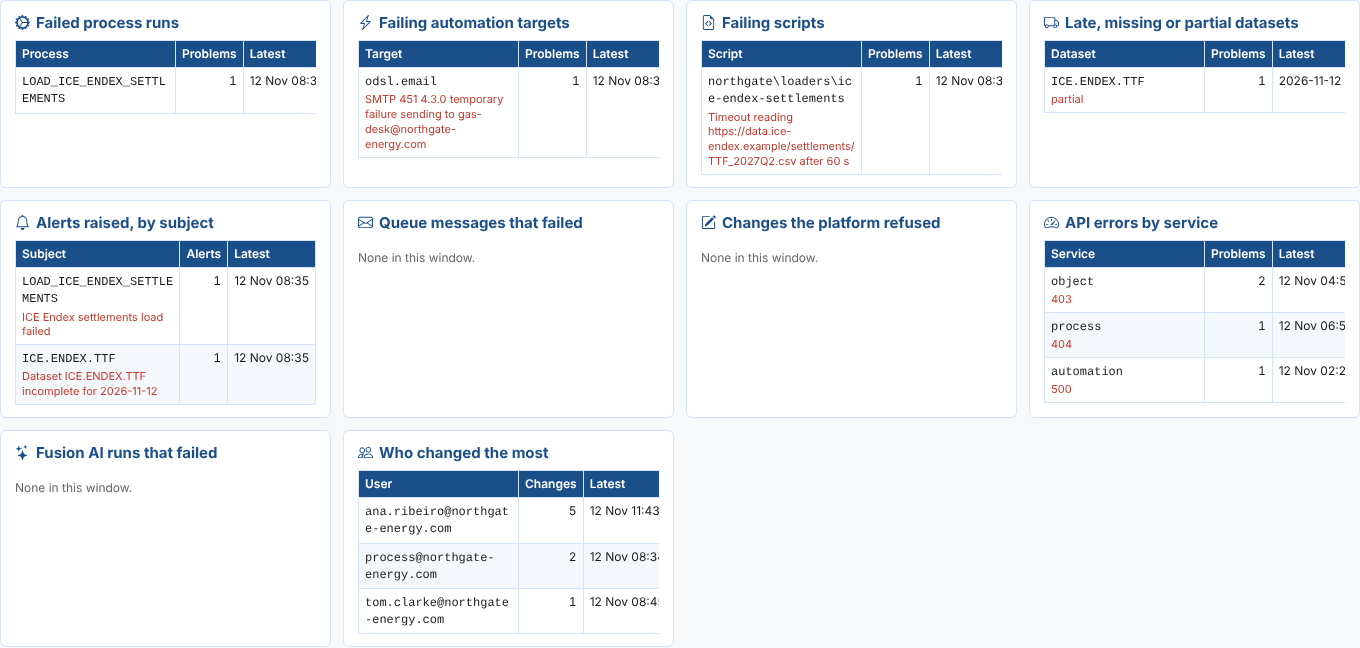
Select a row to see those records on the Timeline: the item (or user) is filled in and Problems only is ticked. Rows for a value that is not an item, such as an API service or a queue, add a condition chip under the log chips; select the chip to remove it.
The detail of a record
Select any row on the Timeline, Logs or Follow a run tabs to open its detail beside the list: the main fields, what is most useful for that log (the phases and log lines of a process run, the log of a script run, what a change changed, the deliveries and timeline of a dataset, the timeline of an alert), and the whole record.
| Button | What it does |
|---|---|
| Follow this run | Opens Follow a run with the record's ids |
| History of this item | Shows every log for the record's item in the time window |
| Around this time | Shows every log from 10 minutes before to 10 minutes after the record, with no other filters |
| Explain | Asks Fusion AI what the record means and what to check |
| Copy | Copies the whole record as JSON |
The small grey id chips (run, trace, inv, fire and so on) in any list or detail also follow that id.
The Auditing tab
The extension adds an Auditing tab to the Data and Master Data screens. It opens the same screen for the selected item over the last 30 days, starting on the Timeline. The item is matched by its start, so a master data record also shows the logs of its curves and timeseries.
Home page tasks
Installing the extension adds three tasks to the Home page:
| Task | Opens |
|---|---|
| Find out what went wrong | The Timeline with problems only for the last 24 hours |
| Follow a run through every log | The Follow a run tab |
| See who changed what | The Logs tab on Changes for the last 7 days |
Where next
- Timeline and logs: reading the logs together and one at a time
- Following a run: everything one piece of work did, and asking Fusion AI to explain it
- Reference: the fields of each log, how filters and following work, permissions and troubleshooting