Timeline and logs
The timeline
The Timeline tab merges every selected log into one list, newest first. It is the place to start when you know roughly when something went wrong but not where.
At Northgate Energy, Priya Shah gets a message from the gas desk that the TTF settlement prices look incomplete. She opens Auditing, ticks Problems only and selects Timeline:
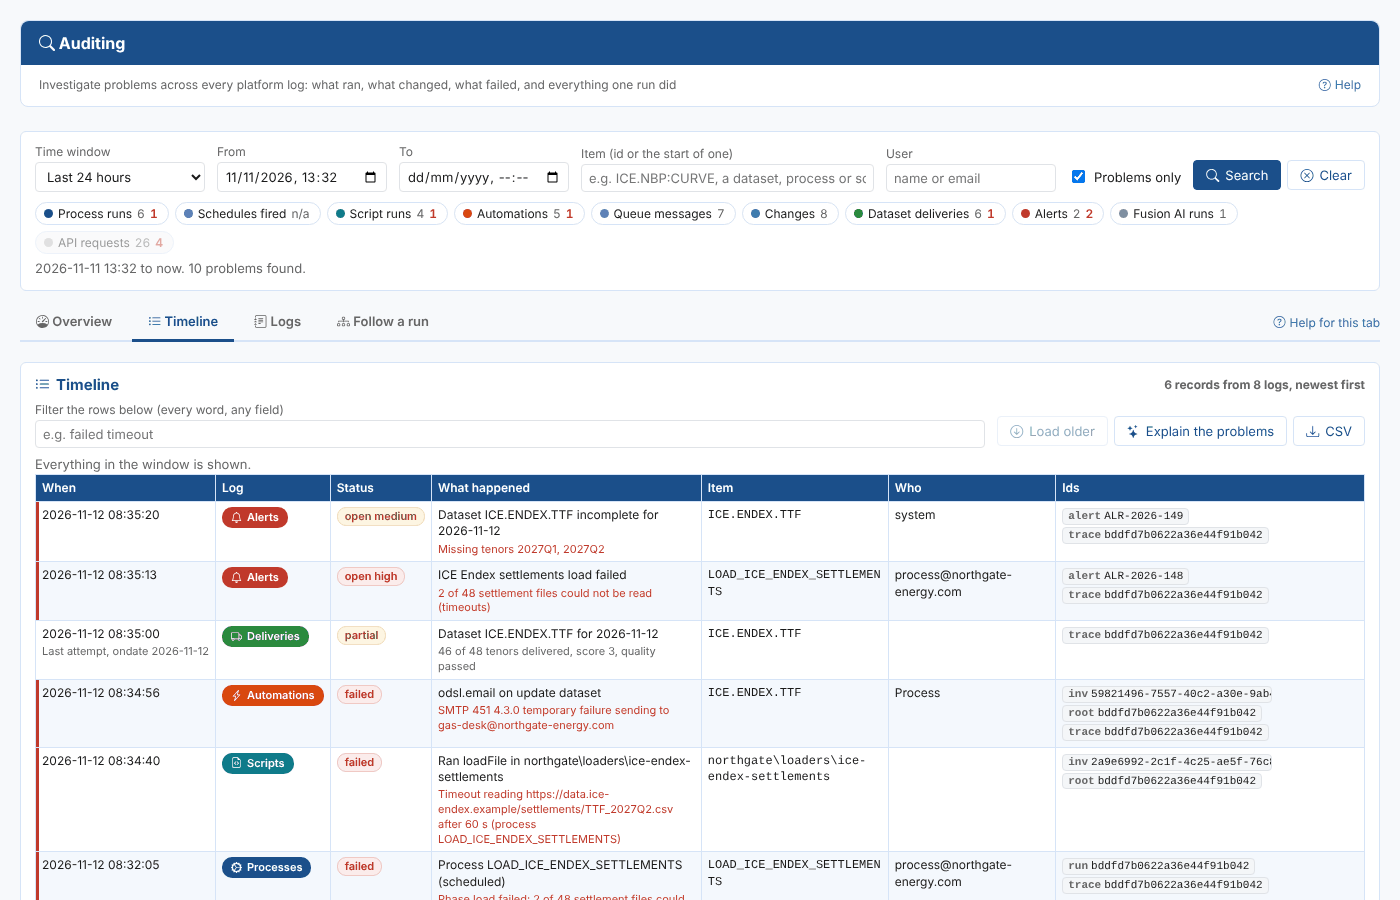
Six problems over three minutes this morning tell the story: the process LOAD_ICE_ENDEX_SETTLEMENTS failed, its script timed out reading two files, the email automation on the dataset failed, the delivery of ICE.ENDEX.TTF is partial, and two alerts were raised.
| Column | What it shows |
|---|---|
| When | When it happened, in your time zone. A dataset delivery shows when it loaded (or last tried), with its ondate underneath |
| Log | Which log the record comes from |
| Status | The record's status: red for problems, amber for warnings and work in progress, green for success |
| What happened | A one line summary, with the message or error underneath |
| Item | The item the record is about |
| Who | The user, the process user, or how it was called |
| Ids | The ids to follow the record by. Select one to open Follow a run with it |
Problems have a red bar on the left.
Reading further back
Each log is read in pages of 50, newest first. The list only goes back as far as every log has been read, so nothing in between can be missing. When there are older records, the line above the table says how far back it shows and which logs have more: select Load older.
Filtering and exporting
Filter the rows below narrows the rows already read: every word you type must appear somewhere in the row. To search the whole window, use the filters at the top instead.
CSV saves the rows shown. Explain the problems sends the problems shown (up to 150) to Fusion AI and asks which are connected, which matters most and what to check.
Narrow the window or the logs before you read far back. A busy day can have thousands of API requests, so they are hidden until you select their chip.
One log at a time
The Logs tab pages through one log on the server, with the columns that matter for that log. Use it when you know which log you want, or to read a log in full.
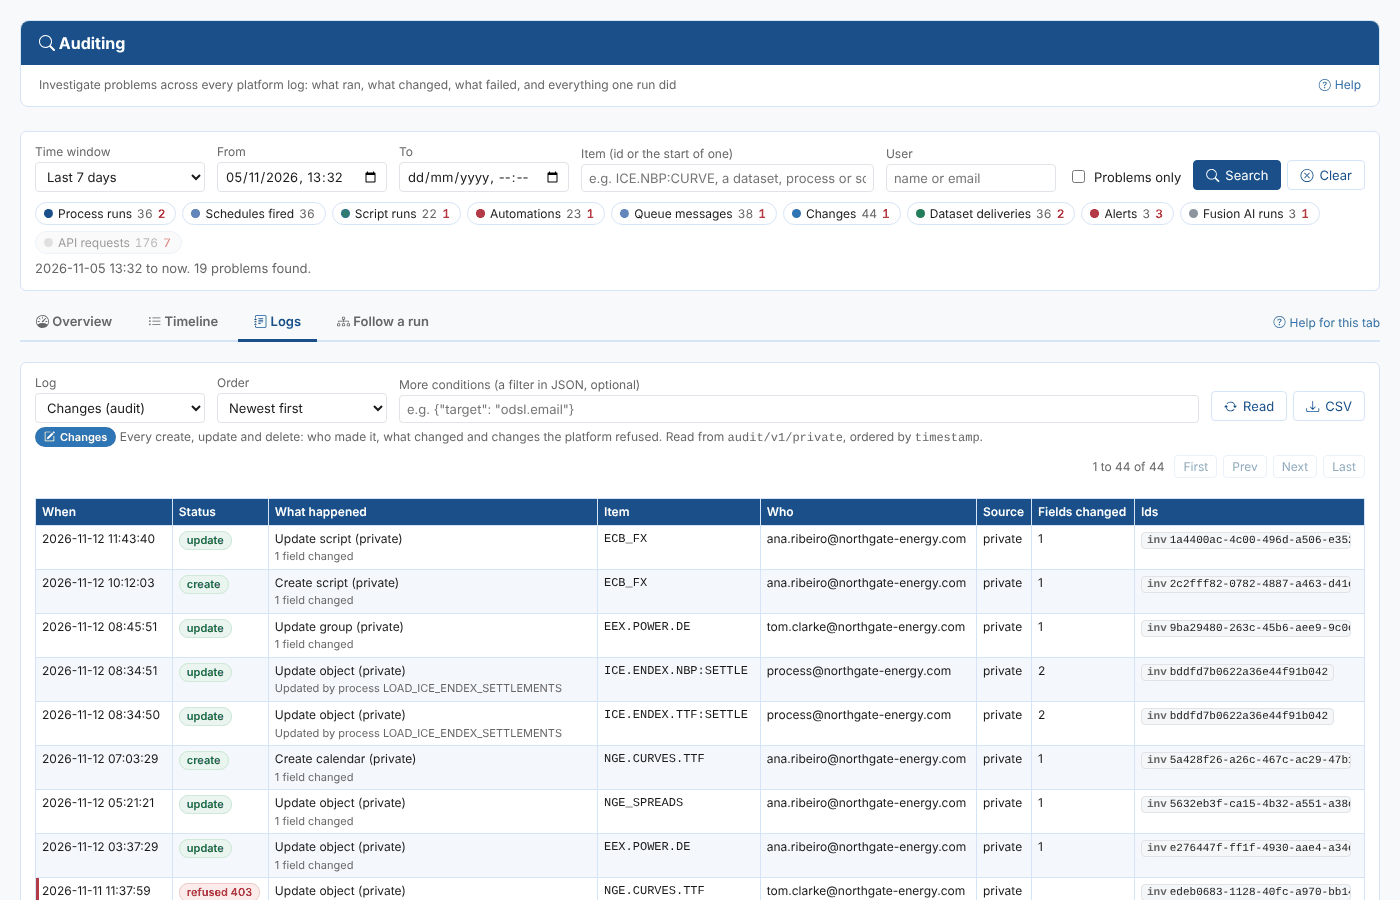
| Control | What it does |
|---|---|
| Log | The log to read. The line underneath says what it holds and where it is read from |
| Order | Newest or oldest first, sorted on the server |
| More conditions | An extra filter in JSON, added to the filters at the top, for example {"target": "odsl.email"} on Automations or {"httpstatus": 500} on API requests |
| First, Prev, Next, Last | Move through the pages of 50. The summary shows where you are of the total |
| CSV | Saves every record that matches, up to 5,000, with the log's own columns |
The extra columns for each log:
| Log | Extra columns |
|---|---|
| Process runs | Trigger, how long it took |
| Schedules fired | When it was due, how late it fired |
| Script runs | Function, trigger |
| Automations | Target, automation id |
| Queue messages | Queue, size |
| Changes | Source, number of fields changed |
| Dataset deliveries | Score, quality and critical check status |
| Alerts | Severity, who it is with, when it closed |
| Fusion AI runs | Tokens, current step |
| API requests | Duration, response size, application |
The field names for More conditions are in the Reference.