Concepts
This section introduces the core concepts of OpenDataDSL — what it is, how it works, and the key components and terminology used throughout the platform.
What is OpenDataDSL?
The name OpenDataDSL reflects the three fundamental aspects of the platform:
- Open — an open and transparent data management platform
- Data — data management is the primary focus
- DSL — Domain Specific Language: ODSL is a fourth-generation language (4GL) used throughout the platform
Architecture
The diagram below shows the functional architecture of the platform.
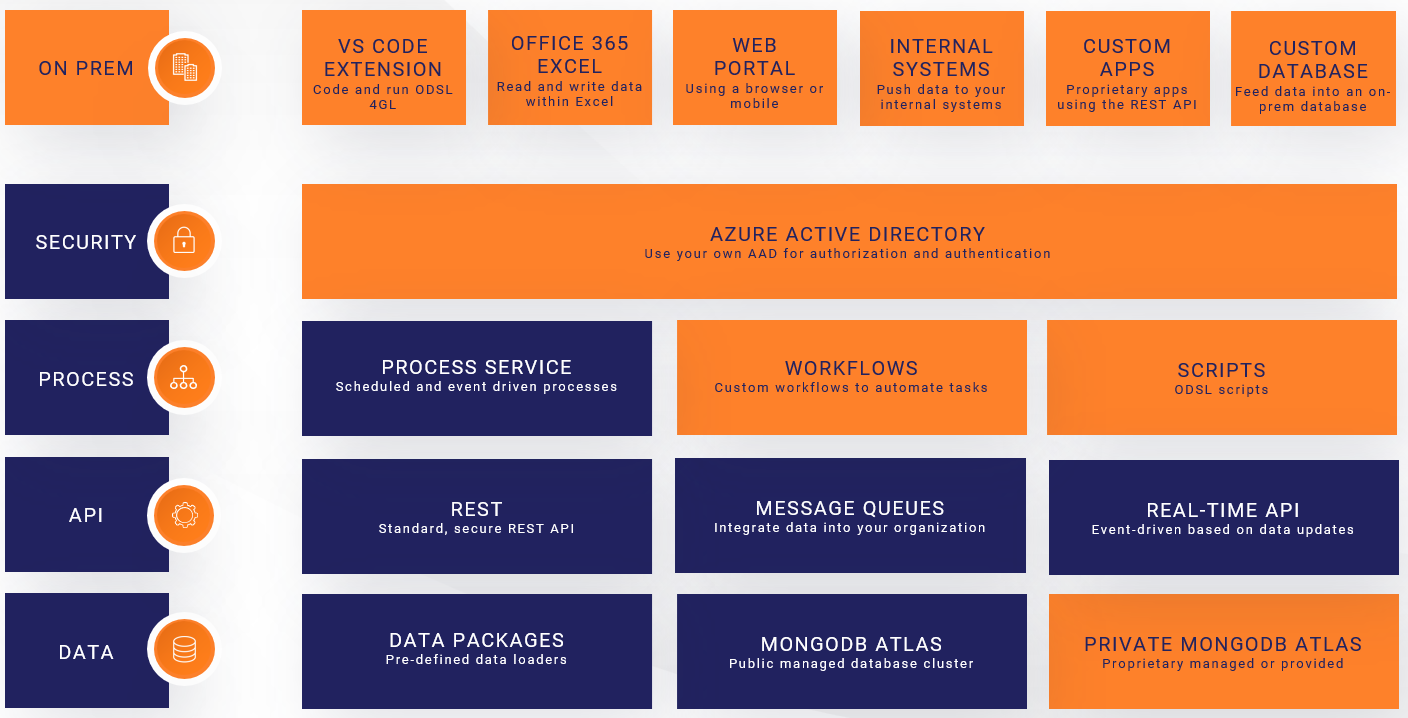
Architecture notes:
- All layers except "ON PREM" run in the Microsoft Azure Cloud
- All access to the platform is secured using your own Azure Active Directory
- The process layer runs on a scalable cluster of Azure Batch servers
Data Location
All data is stored in MongoDB Atlas, a cloud-based database service. Data falls into two categories:
- Public — freely distributable data accessible to all platform users
- Private — your own data, accessible only to users on your Azure AD tenant
Your proprietary private data is stored in its own dedicated database, completely isolated from other tenants.
Components and Terminology
The section below summarises the key components and terminology used within OpenDataDSL.
Master Data or Objects in OpenDataDSL are documents that contain descriptive information and properties which represent a specific product, entity or resource.
- An FX currency pair from a specific data provider
- A futures product on a commodity exchange
- A physical power generation plant
- A weather station
A timeseries is attached to master data and represents a value or metric recorded or observed at a point in time. Timeseries have a calendar which defines the expected interval between observations.
- The daily FX rates for an FX currency pair
- The temperature reading at a weather station
- The GDP of a country
- Price ticks from an exchange
A curve is a structure that represents values at a point in time that reference a future delivery period. Those values can either be:
- The market price today for a future delivery period
- A forecast value made today for a future period
- Futures prices on a commodity exchange — forward curve
- A weather forecast
A matrix is a table of values that relate two dimensions together. The values in a matrix are usually calculations or statistics derived from other data.
- A correlation matrix between asset prices
- A covariance matrix
- A statistical summary (min/max/mean/stdev) across multiple products
An event is an individual observation for a single time point. Each event has a reference time, a start and end time, and a set of values and properties.
- All FX rates for a single publication date
- All delivery prices for a single futures contract on one day
- An individual trade — price and volume
- A discrete sensor reading such as temperature
A report is any data in any structure that is generated and stored for a specific date. Reports can have a template that defines how the data is displayed — as charts, tables, or exported file formats such as XML, CSV, or JSON.
- A daily price and volume summary
- An aggregated forward curve
- A newsletter or commentary document
- A CSV export for a downstream system
An automation triggers a delivery action automatically whenever a watched data item changes. You define a condition (which item and which action) and a target (where to send the data), and the platform handles the rest.
- Send an email when a Smart Curve is rebuilt
- Push updated data to a downstream queue
- POST a webhook when a timeseries is updated
- Trigger a curve build when settlement data arrives
A queue is a conduit for messages sent from the platform to external systems. An application listening on the queue can retrieve messages and act on the data they contain.
- Deliver curve input data to an external curve-building application
- Feed market data into an ETRM system
- Trigger a downstream processing job
A calendar defines the valid observation intervals for a timeseries or curve — which dates or times are expected to have values, and which are not. Calendars can be built-in or custom, and can include holiday rules to exclude specific days.
- Daily — one value per calendar day
- Business — one value per weekday, weekends excluded
- Monthly — one value per calendar month
- Exchange — follows the holiday schedule of a specific exchange
A type (or declared type) is a reusable schema that defines the properties, expressions, and methods shared by all objects created from it. Types enforce structure and consistency across your master data.
- A Company type with name and registration number
- A PowerPlant type with capacity, fuel type, and location
- A CurrencyPair type with base and quote currency
- A WeatherStation type with coordinates and operator
A transformer is a mapping definition that converts extracted source data into the structure of a declared type. It is the T in ETL — separating the transformation logic from the extraction and loading steps.
- Map an XML response from a data vendor into a PowerPlant type
- Convert a CSV row into a CurrencyPair object with timeseries
- Restructure a nested JSON object into a flat list of rows
An action is a self-contained, reusable task written in ODSL that performs a single step within a workflow — such as fetching data from a URL, transforming it, or loading it into the platform. A public library of actions is available, and you can create your own.
- Extract XML from an HTTP URL
- Apply a transformer to map raw data into a declared type
- Save a batch of objects to the platform
- Send a notification on failure
A workflow chains actions together into a multi-step automated process, with routing logic to handle different outcomes at each step — including retries and error handling. Workflows can themselves be used as actions inside other workflows.
- Extract, transform, and load data from an external source
- Fetch data, validate quality, and trigger a curve build on success
- Retry a failed load up to three times before alerting
A process is a scheduled or event-driven workflow or script that runs in the cloud. Processes are the mechanism by which automation is triggered — either on a cron schedule or in response to a data event.
- Run an ETL workflow every weekday at 17:00
- Trigger a curve build whenever settlement data arrives
- Run a quality check script after each data load
A script is an ODSL code file saved to the platform. Scripts can be run directly as a process, used to define reusable functions, or referenced in Smart Curve expressions.
- A library of custom curve-building functions
- A data quality checking routine
- A one-off data migration or backfill script
- Helper utilities shared across multiple workflows
A policy defines who can perform which actions on which data. Policies control read, write, and delete access across your private data, and can restrict or deny access to specific datasets or services.
- Grant full access to a named set of admin users
- Allow all users to read private data but not modify it
- Deny access to data from a specific licensed vendor
- Allow specific users to manage queues and automations
A data identity is a named external reference attached to a data item — timeseries, curve, Smart Curve, matrix, or event. Each identity maps the item to the ID used by a specific downstream system, so that system can identify the data without a separate mapping table.
- A Smart Curve with a SAP commodity code and an ETRM reference
- A timeseries with a Bloomberg ticker and an internal risk system ID
- A forward curve with identities for three different downstream consumers
Next Steps
- Getting Started — sign in, onboard your company, and install the tools
- Security — configure access policies for your users
- Find Data — search and filter the data catalog
- Smart Data — build derived curves and timeseries using expressions
- Loading Data — ETL workflows, events, queues, and direct API writes
- Extracting Data — portal, Excel, API, automations, and reports
- Auditing — automatic audit trail, versioning, and rollback
- Dataset Monitoring — completeness, quality, and timeliness tracking
- Extensions — build custom portal and Excel views
- Data Identities — map data items to the IDs used by downstream systems