What is the Home extension?
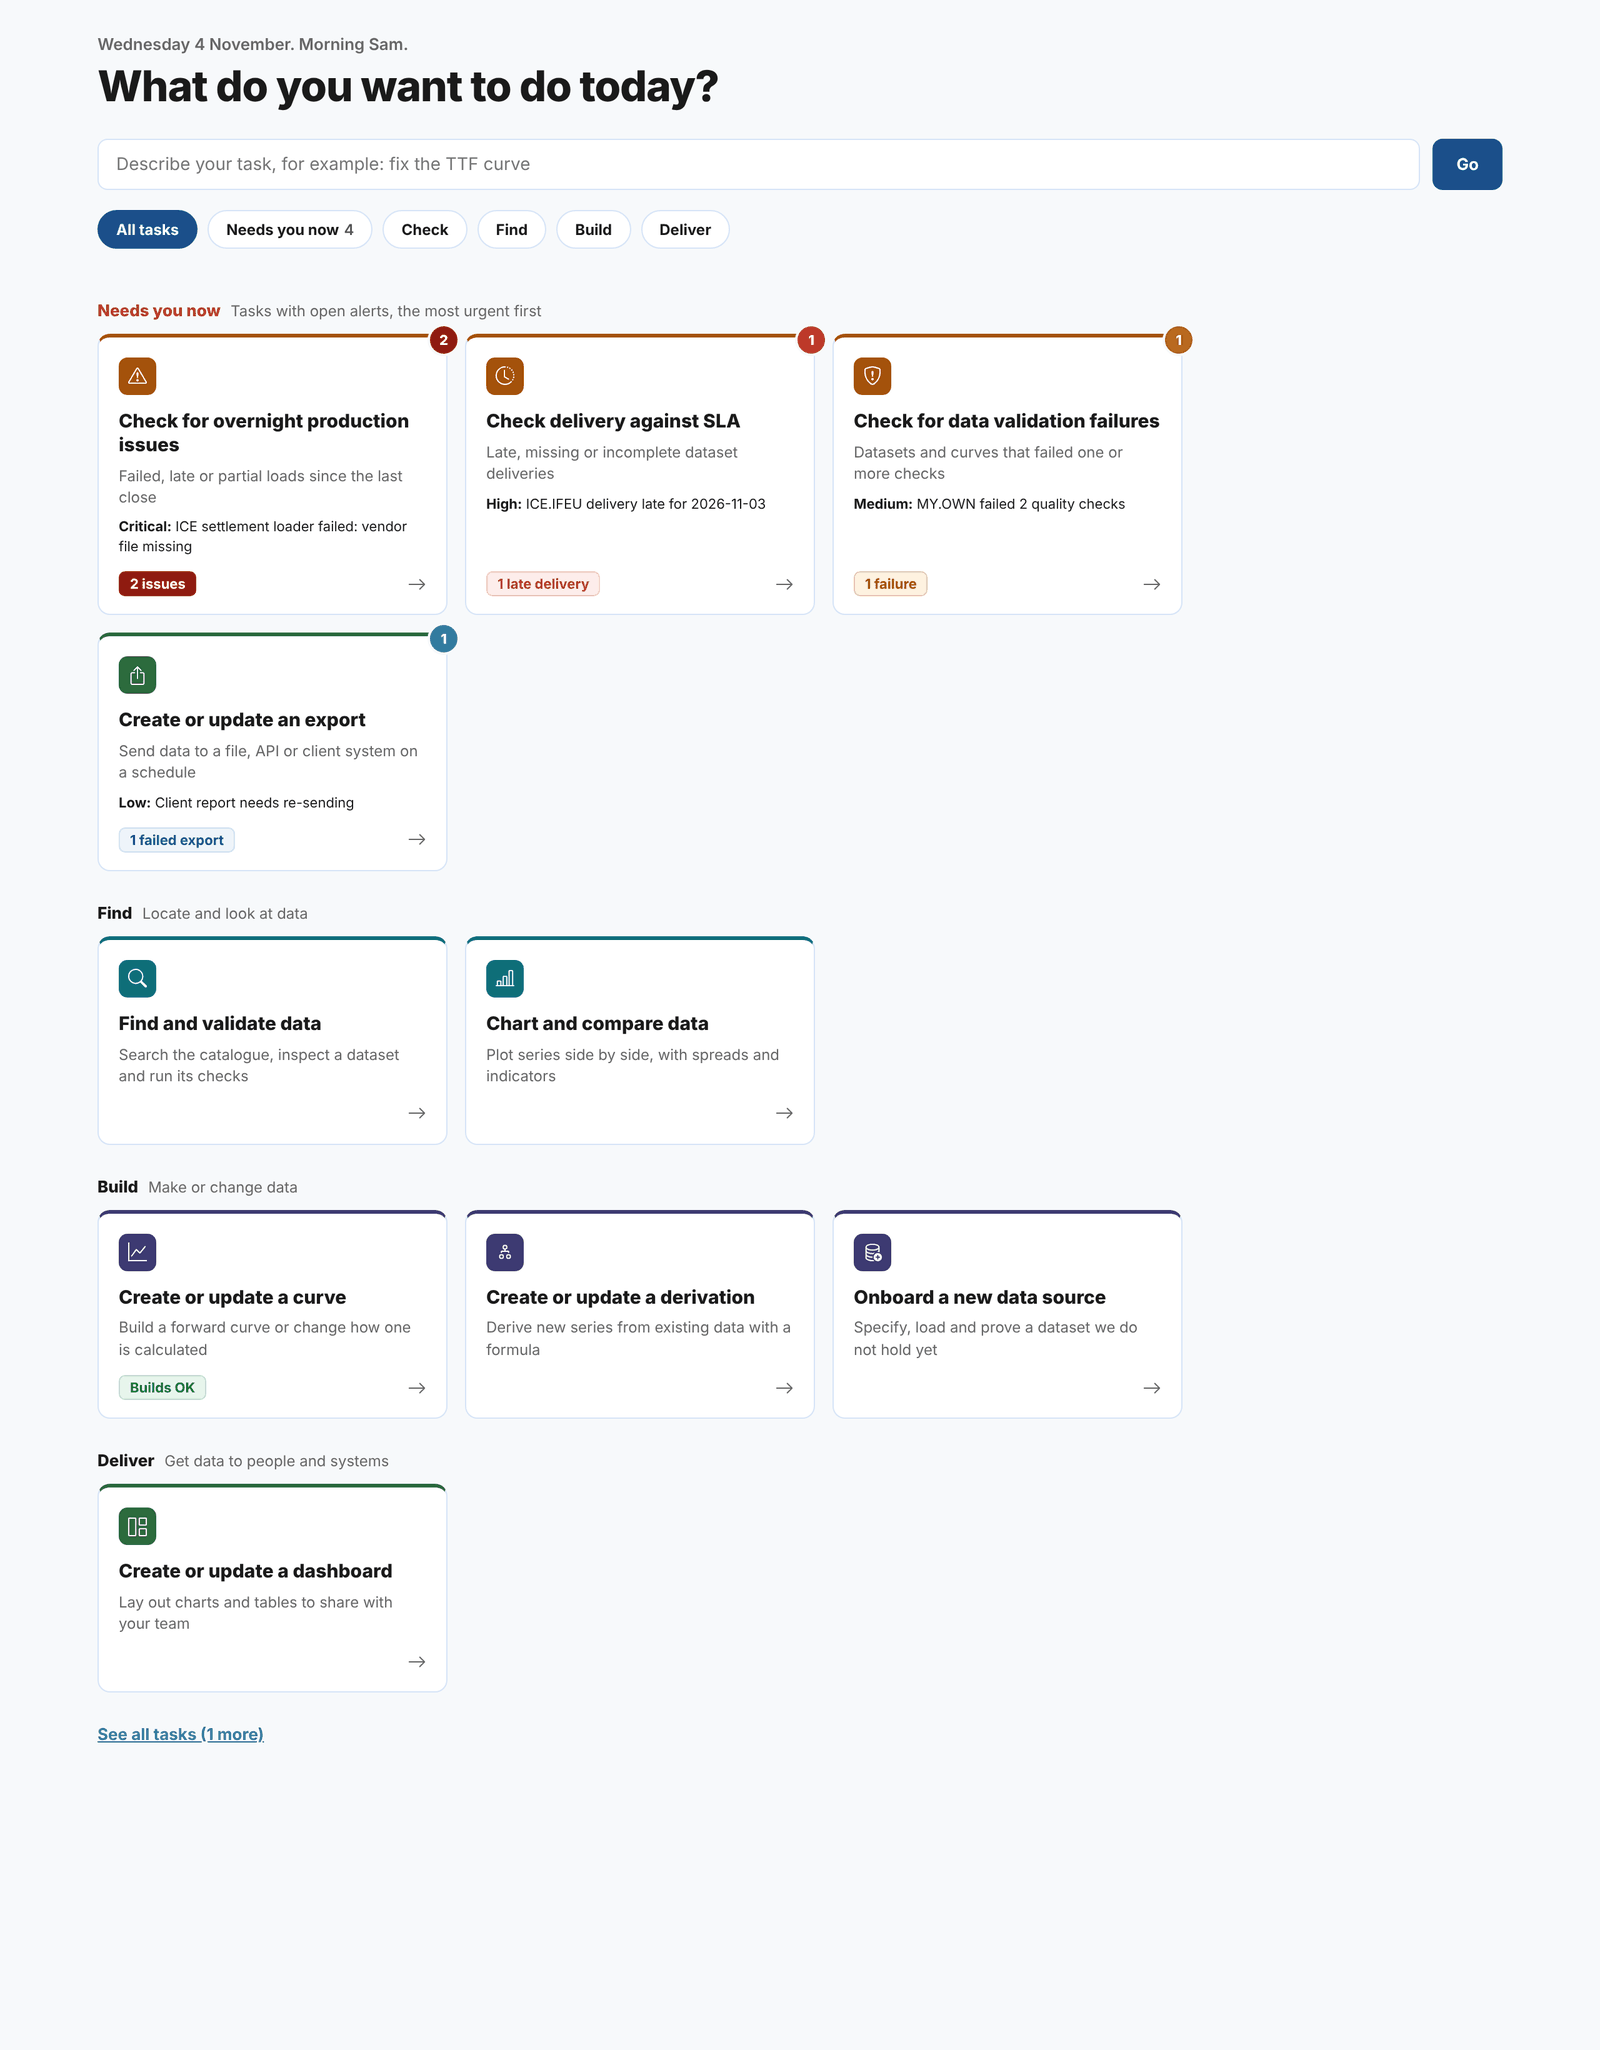
The Home extension gives the portal a home page that starts from the work, not from the menu. It asks one question, What do you want to do today?, and answers it with a set of task tiles: check for overnight production issues, look at validation failures, chart and compare data, build a curve, set up an export, and so on.
Each tile opens the screen that does the job. The tiles come from the extensions installed for your team, so the page grows as you add extensions, and every extension can add tasks of its own.
When something needs you, the page says so. A task with open alerts moves to the top under Needs you now, with a badge showing how many alerts are open and the most urgent one spelled out, so the first thing you see in the morning is what to do first.
Key concepts
| Concept | What it means |
|---|---|
| Task | One thing you might want to do, shown as a tile with a name, a short description and an icon. Choosing it opens the screen that does it |
| Group | Tasks are grouped by the kind of work: Check (see whether anything needs you), Find (locate and look at data), Build (make or change data) and Deliver (get data to people and systems). Extensions can add groups of their own |
| Priority | How high a task sits in its group. Tasks with open alerts always come first |
| Needs you now | The tasks that have open alerts, the most urgent first: highest alert priority, then the most alerts |
| Alerts on a task | A task can say which alerts belong to it, for example production issues are the root cause alerts raised by failed loads and timed out processes. Alerts can also name a task directly |
| Featured | Most tasks show straight away. Others only show under See all tasks, or when you search for them |
The tasks that come with the extension
The Home extension adds these tasks. A task only shows when the extension that does the work is installed.
| Group | Task | Opens | Counts these open alerts |
|---|---|---|---|
| Check | Check for overnight production issues | Alerts | Root causes, process and system alerts, failed loads and time-outs |
| Check | Check for data validation failures | Validation | Quality and validation alerts |
| Check | Check delivery against SLA | Alerts | Late and incomplete dataset deliveries |
| Find | Find and validate data | The Data screen | |
| Find | Chart and compare data | Composer | |
| Build | Create or update a curve | Smart Data | Curve build failures |
| Build | Create or update a derivation | Smart Data | |
| Build | Onboard a new data source | Fusion AI | |
| Deliver | Create or update an export | Export | Failed exports |
| Deliver | Create or update a dashboard | Composer | |
| Under See all tasks | Review automations, Edit a script, Promote changes between environments | Automations, Scripts, Promote |
Other extensions add tasks of their own when they are installed. For example, Integration adds checks for exports that failed, were held back by validation or missed their cutoff.
Shared alerts about common and public data are counted only for the datasets your team follows, the same as on the Alerts screen.
Next
- Using the Home page: the page, searching, and opening tasks
- Adding tasks: add tiles from your own extensions, and link alerts to them
- Reference: every field of a task tile, and the REST API