Microsoft VS Code Extension
Our free extension to Microsoft VSCode allows you to easily edit and debug ODSL source files and browse the ODSL Services
Installation
Installation of our VS Code extension is easy, follow these steps:
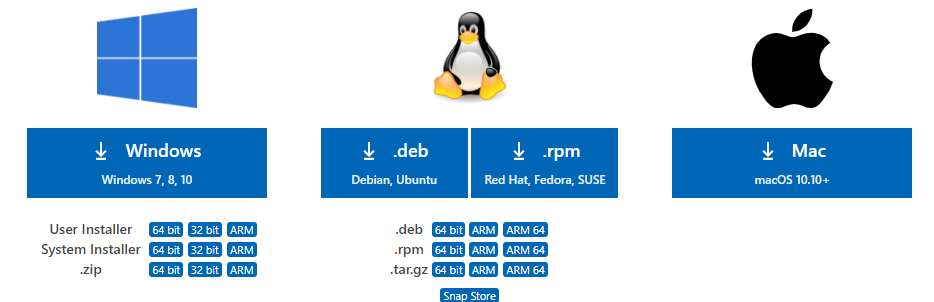
Install VSCode
If you haven’t done already, download and install the latest version of Microsoft VS Code here
Install the ODSL Extension
Open VSCode and click on the extensions icon in the Activity Bar on the left or press (ctrl-shift-X) and then search for odsl
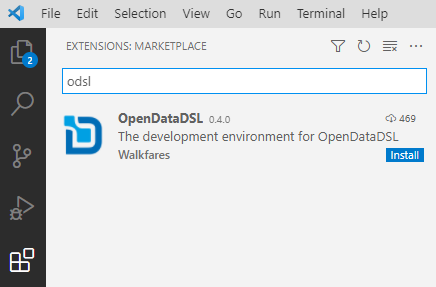
Click on the Install button to start the installation of the ODSL extension
Once installed, opening or creating a file with the extension .odsl initiates the ODSL editor
Editing ODSL files
There are many language features which are available when editing .odsl files, below is an introduction to what is available:
Standard VSCode Features
VSCode has many standard features to make editing source code easier, check out this link to get a flavour of what is available
Syntax Highlighting
The VSCode editor understands and highlights various parts of your source in order to make editing easier and the code to be more readable:
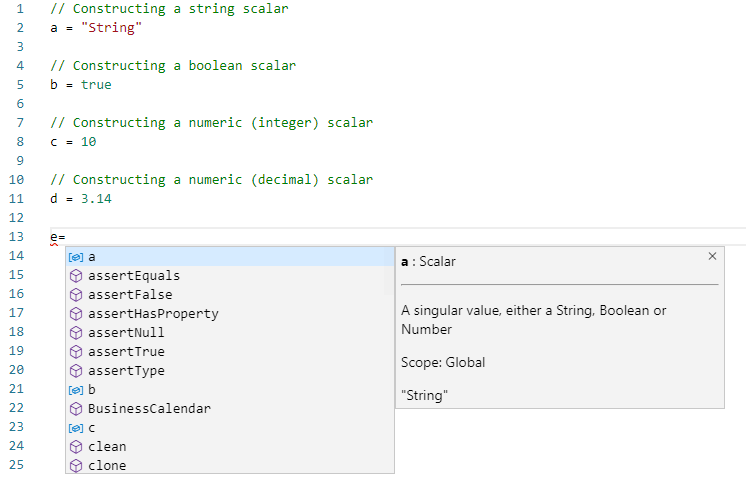
Code Completion
Code completion is a feature that helps you write code by suggesting options for you where the cursor is placed. Code completion is triggered as you type and specifically when you press the '.' dot character. Code completion can also be forced by pressing ctrl-space.
An example of variable and function suggestion:
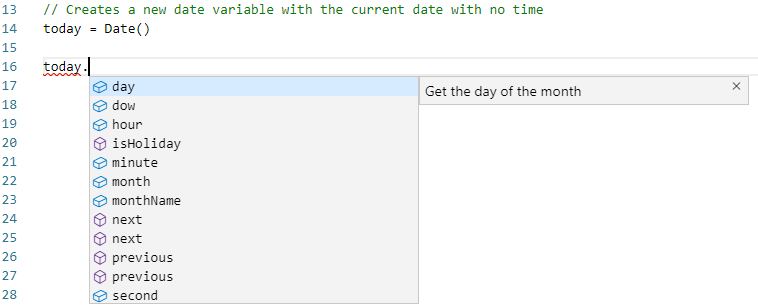
An example of property and method suggestion:
Problem Highlighting
The ODSL language server is constantly scanning your code to spot problems and it makes you aware of those problems by placing a squiggley red underline beneath the piece of code where the problem is, for example:

The statement when is not recognised, so it highlights it in order for you to fix it.
A problem message is also placed in the problems console giving you the line, column and error message:

Hover Information
Where it can, the ODSL language server gives you information about the code under your cursor. This can be information about syntax or details about a specific variable, e.g.
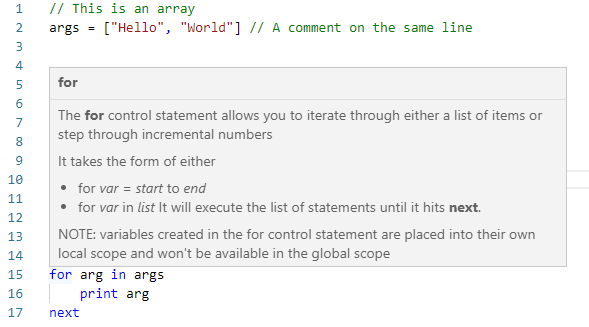
Syntax Information
Variable Information

Snippets
There are also a number of built in code snippets that help you with the language syntax, these are triggered when typing certain character combinations at the start of a line and also by pressing ctrl-space at the start of a line.
E.g. typing the word for prompts the following:
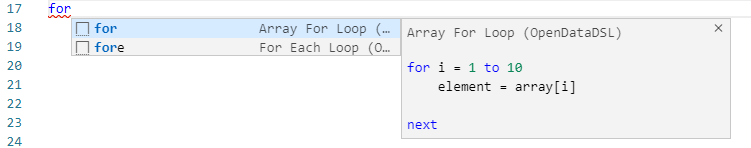
Selecting for by pressing the enter key gives you the following code:

You can now tab through the highlighted elements and change the variable names to the desired ones.
Pressing ctrl-space at the start of a line gives you a full list of the available snippets.
Debugging ODSL Files
A very powerful feature of the ODSL extension in VSCode is the ability to debug ODSL files, stepping through, checking variables etc.
To start a debug session on the currently edited ODSL file, right-click anywhere in the file and select the menu item Debug Editor Contents
Breakpoints
Breakpoints can be toggled by clicking on the editor margin or using F9 on the current line.
Code will run to the first breakpoint and then pause, at which point you can examine the variables and stack trace. You can also add watches or execute commands on the debugger.
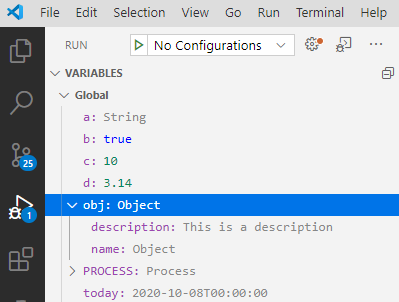
Examining Variables
In the variables viewer, you can see a list of the variables that have been created in your code up to the current line (which is highlighted in your code)
Stepping through the code
You can now step through your code using the debug toolbar
![]()
Or using the following keys:
-
Continue / Pause
F5 -
Step Over
F10 -
Step Into
F11 -
Step Out
Shift+F11 -
Restart
Ctrl+Shift+F5 -
Stop
Shift+F5
Debugging regions of code
You can create folding regions within your code that can break large scripts up into manageable sections that can be debugged independently.
A region wrapper looks like this:
//#region Add a name here if you like

//#endregion
You can also use the region snippet to create a region.
To debug a region of code, right-click anywhere in the file and select the menu item Debug Region
Running selected text
You can select an a line or lines of code in a file and just run that bit of code by right-clicking in the file and select the menu item Run Selected Text
You cannot debug when running selected text