Release Notes
Latest release July-2026
- Server: 3828 Build
- Client: 1.10.46218.841
- Excel: 1.10.20260715.1500
- VS Code Extension for OpenDataDSL: 0.17.0
This release adds the ability to visualize versions of curves and data, along with building and running curves directly in the Portal, a curve export automation target, custom calendars, and field-level security. It also includes numerous fixes to curve data display and consistency, plus improvements to the Excel Add-in and VS Code integration.
Moreover, we've laid the groundwork for Composer, a new upcoming feature that will let users build structured data tables, called compositions, by combining multiple data sources, expressions, and references into a single, unified view.
New Features
- Curve Version Visualisation in the Portal
- Curve dependency Insight Report - Flowchart using Mermaid
- Run/build curves in the Portal - Curves can now be built and executed directly from the Portal, without requiring a script trigger
- Curve export automation target
- Added support for defining custom monthly and fortnightly calendars addressing client requests for non-standard period definitions
- Introduced field-level security policies, allowing more granular control over which fields are visible/editable per user or role
- Added the ability to run ODSL code directly in VS Code without starting a debug session
Enhancements
- The data frequency slider now supports an hourly view for series that are natively quarter-hourly, making it easier to inspect data
- Curves that have been substituted are now clearly labeled as "Substituted" in the Data tab view, improving traceability of curves
Bug Fixes
- Fixed an issue where the UI displayed input curve contracts rather than the resulting output curve series
- Fixed handling of curve contract output when the BASE input itself is a curve series (previously not supported/handled incorrectly)
- Fixed incorrect data being displayed in Include/Exclude input selections
- Fixed an issue where currency and unit display would inconsistently reflect a previously selected curve rather than the currently selected one
- Fixed the curve chart rendering blank when input data was missing for the selected curve on a given date
- CURVE BUILD - Fixed a build failure that occurred when curve names contained spaces
- Fixed a null pointer exception when retrieving group version information for curve groups
- Fixed an issue causing the Excel Add-in to render blank
- Removed the _subtype filter from the query used to locate FX data in Excel
- Fixed an issue where certain events could not be retrieved within the VS Code integration
- Fixed an issue where automation was not updating the curve management dashboard
June-2026
A minor release covering maintenance and operational updates.
Bug Fixes
- Fixed a null pointer exception when retrieving version info for curve groups
- Fixed handling of asQuarterHours() for quarter-hourly input contracts
Improvements
- Added support for custom monthly and fortnightly calendars
- Added support for updating secret values
- Added support to restrict IP address ranges for specific tenants (backend)
- Added support for field level security policies to restrict certain metadata fields (backend)
- Improvements to smart curve expression editing (backend)
May-2026_II
New Features
- Add support for functions asQuarterHours() and asHalfHours() to split a contract into its quarter hours and half hours
- Add support for creating user groups for use with policies (in the Web Portal under Account Management->Organization->Security)
Bug Fixes
- Fix for eventtime curve tenor naming
- Fix forwardfill timezone issue
- Fix for missing values stored in simple json objects
- Fix for users in groups not getting deleted
Improvement
- Ensure curves with no valid contracts don't get saved
- Allow to create/delete api tokens in the Web Portal->Account Management->Personal
Hotfixes
- Fix for Curve Management Export Groups and Build Groups
- Fix to check for an error message in the report to send a failed automation
- Added support for variable names for skip, limit, sample and bucketAuto bucket size
- Throw exception when updating VarCurveDates if not an existing VarCurveDates
- Fix for retrieving event and data using find
- Fix to generate the token in order to connect via the API
- Simplification to curve builds, that can be initiated and run from various places, e.g. curve target, curve task
- Validate curve contracts when using older ondates
- Fix search parser bug and add support for searching named identities directly
- Revert -ONDATE functionality and create it as -ABSOLUTE (The functionality when using -ABSOLUTE:
- (1) Remove expired contracts and
- (2) Recreate the contracts based on the current ONDATE and the absolute contract)
May-2026
The following new feature, bug fixes and improvements are included into the maintenance release:
New Features
- Alternate identities for e.g. integrations with other systems
Bug Fixes
- Automations are not being run when a report is run
- Setting a calendar on a SmartTimeSeries should scale the result to that calendar
- Page size in Master data table list
- Fix security issue with common data on client tenant
- Refresh object embedded reports in Excel is not working
- On workbook reopen, the Excel Add-in does not honour previously applied filters
Improvements
- Performance improvements related to events and event aggregations
- Policy/Acess Rights/Sudo process in Dataset Monitoring
- Add support for creating event curves from event timeseries
- Support security policies for custom object
- Unit conversion: Added support for heat rate
Hotfixes
- Fix for Curve Management Export Groups and Build Groups
- Fix to check for an error message in the report to send a failed automation
- Added support for variable names for skip, limit, sample and bucketAuto bucket size
- Throw exception when updating VarCurveDates if not an existing VarCurveDates
Mar-2026_03
The following bug fixes and improvements are included into the release:
Bug Fixes
- Email Automations Not Received — resolved an issue where emails triggered by automations were not being delivered to recipients
- Data Recon — fixed a bug where the model failed to run when a process was triggered via an automation
- Discontinued DSID Picked Up by Smart Loader — the Smart Loader will no longer process discontinued DSIDs
- Fix on scalar values in scientific notation concatenating instead of adding
Improvements
- Alternate Identities - enhanced handling and management of alternate identities
- Node.js - various performance and stability improvements
- Curve Exports
- Add support for CurveSeries
- Add support for missing curves
- Fix group updates that create processes
- Add support for identities
- Curve Ancestry
- Use automations instead of subscriptions
- Stop ancestry calculation from automatically adding all curves to curve management
Mar-2026_02
This minor release resolves certain issues experienced by some users and introduces a few improvements.
Bug fixes
- Fix for “ArgumentNull_Generic” error affecting some users
- Resolution of repeated yellow update pop-up notifications for some users
- Fix for data reconciliation dashboard screens displaying panels without content
Improvements
- Email subscription – date included in subject line
- Support for non-ODSL script processes
Mar-2026_01
This release introduces Fusion AI integration across the web portal, expands Excel Add-in capabilities, and extends process execution to support generic command-line commands and non-ODSL scripts.
Bug Fixes
- Fix for calendars not displaying all holidays
- Quality Check Group: Stored information in the curve quality setup was not displayed correctly when editing
- Smart Curve/Data configuration:
- Fixed error where expression parameter could no longer be empty
- Fixed error when adding a time series as an expression parameter to a curve setup
- Changing the caching property no longer resets the selected smart curve script
Improvements
- Remembering selected color scheme changes across sessions
New Features
- Allow processes to execute generic command-line commands (e.g., Python scripts)
- Support non-ODSL script processes - groundwork completed
- Add build script version to curve properties for auditing purposes
- Running different reports as an automation
- Fusion AI integration across the web portal (e.g., Home, Datasets, Process Execution)
- Excel Addin:
- Allow updating object and data names without requiring a ref-ID
- Reverse your last action (CTRL+Z) on extracted data in an Excel sheet
Jan-2026
The primary focus of this release is Fixes and Improvements to Datasets, Monitoring, Reports. In line with this, the following items specifically related to this area got addressed, including:
- Fix to Evaluate function - example found in the documentation
- Support for partial loading in Smart Loaders
- Resolution of a number format issue affecting values containing hexadecimal characters
- Automation advice - Data Reconciliation (#ONDATE variable)
- Enable JavaScript scripts to run within automations
- Error while sending emails
- Dataset monitoring – improvements to alerting support
- Report versioning causes out of memory error
- Quality Check Group - quality check and substituted curves
- Emails with attached data appear encrypted (base64)
- Error building report - JAVA related error
Release History
2025
Dec-2025
This hotfix release contains the following fixes:
- Replacing report configuration
- Automations - triggering a report from the result of another report
- Crontab tasks did not fire as expected
- Booleans in ODSL code getting name as value
Additionally, a new feature - Fusion AI - is added to the portal. This feature will be constantly enriched over the next periods.
Nov-2025
The primary focus of this release is Fixes and Improvements to Datasets, Monitoring, Loaders.
In line with this, we concentrated on addressing items specifically related to this area, including:
- Force choice of reason for Manual Loader run
- Improve subscription logging in process execution logs
- Enable/Disable option to Dataset Loader
- Add support for completeness checks on Smart Loaders
- Auto generated monitoring leads to Alerts
- Smart Loader status
- Schedule displayed in Monitoring Feed Tab for Smart Loaders
- Mystery of vanishing Datasets due to incorrect counter
- Handling discontinued DSIDs
In addition, the release also incorporates other enhancements and fixes, such as:
- Bulk delete improvements
- Support for policies restricting installing and uninstalling extensions
- Support ‘half’ to write the expiry rule for half-yearly contracts
- Geo Maps improvements
Oct-2025
This release will include a set of important fixes and improvements:
- Performance
- Scale and overlay formula
- Automation
- Automatic creation of series based in event updates
- Automation to email when data had been received
- Scheduled reports did not get triggered
- User Interface
- Timeseries presentation in graph and table using pre-defined ranges like 1M
- Midnight timestamp for sub-daily timeseries
Hotfixes
- DS_LATENESS - delivery status when loader is complete
- Unexpected tasks in process execution
- Retry strategy in SmartLoaders file collection
- SmartLoader - picking up discontinued dsid
- Renaming dataset to be applied on deliveries
- Add tryParse function for parsing dates
- Add option to pass report date when saving reports
Sep-2025
This release will include a set of important fixes and enhancements:
- Support critical lists for Datasets
- Support to view Dataset status by Delivery or by On-date
- Support Audit Records for Curve Series
- Fixes to Automations
- Support the renaming of Reports to preserve history
- Support Queue Log access via VS Code
Aug-2025
This release will introduce a standalone new feature: Automation, along with a series of bug fixes and usability enhancements.
New feature - Automation
Looking ahead, Automation will gradually replace the current Subscriptions. Automations are designed to be more user-friendly, flexible, and easier to extend—both by our team and by clients.
Improvements
- Option to switch off Alerts in dataset Monitoring
- Improvements to tracing of queue messages
- Smart data - showing all the inputs in the table
- Add Forward/back arrow in Datasets and Curves
- Header/Footer for widgets in Dashboard
- Data properties update
- Support input properties for any type of report
- Extension improvements: add extension to standard sections (information, automation and manage), add refresh button and clean-up insigts
- Empty object attributes: Added setting default_property to default new properties to null
Bugfixes
- Dataset - Discontinued still create delivery records
- Frequency slider not having all options available
- Performance Issues when incrementing numbers in a loop
- Portal charting error
- Dataset - tenant copy missing with Calendar attribute
- Avoid generating 'NaN' in the correction report if one profile among many is not updated
Hotfixes
- Remove admin restriction on listAutomations
- Internal EventCurve not visible in Portal or Excel but working in ODSL code and reports
- Add health check service
Jul-2025
Hotfixes
- Upgrade MongoDB Java driver
Jun-2025
This release will support Extensions (Apps) and enhanced Dashboards incl. Widgets as new highlights of the OpenDataDSL platform. Moreover the release contains accumulated bugfixes and a group subscription enhancements.
Extensions (Apps)
OpenDataDSL extensions are a collection of components which form some bespoke functionality that gets added to the Web Portal. This will allow us, partners and customers to extend/add new functionality and features dynamically to the Web Portal.
Also check out the available documentation pages:
- Topic: Extension Basics to get a good understanding of how extensions work
- Topic: Extension Example for a simple example of creating a basic extension
- REST API Extension for the REST API for the extension service
- Developer Guide: Extension Service for the extension service in the ODSL language
Dashboards incl. Widgets
The idea behind Widget Reports is that they are custom charts and reports that fit within a regular size on a grid as either a single or multiple cells. Users could create their own Widgets and customise the Dashboard to create their own Home Screen. The Dashboard(s) can optionally be shared.
Group subscriptions
This new feature is to add a special subscription on a static group, which synchronises the group items with subscription items whenever the group changes. The subscription targets will work on the items of the group.
Bugfixes
- Hourly prices within a month not correct
- Intraday calendar not correctly using timezone for Event Timeseries
- Issue saving existing group changing shared from false to true
- Disabling a subscription asks for QueueTarget which is already there
- View Tenor History for Absolutes Tenor is returning Relative Tenor History
Hotfixes
- SFTP changes for EPEX
- Fix for connections issue causing failure and others. Included commits:
- Close mongodb connections after running a process
- Close MongoDB connection after creating a task
- Fix to ensure api keys are not removed when updating a user
- Add support for curve tenor listing for event curves
- Intraday data is being shifted by 1 period
- Calendar alignment fix
May-2025
This release will support Groups/Favourites and enhanced Insight Reporting as new highlights of the OpenDataDSL platform. Moreover the release contains accumulated bugfixes and general enhancements.
Groups/Favourites
Groups and favourites in OpenDataDSL come along with the following features:
- Dynamic or static groups - a dynamic group uses a filter to find the items belonging to the groups
- Shared groups - option if you want to share the group with your colleagues
- Managing groups - manage the groups you are the owner of
- Group subscriptions
- Access rights following your policies
There are some pre-defined special groups which control specific functionality within the OpenDataDSL platform:
- Curve Build Group - has specific configuration information regarding the cut-off time for when curves need to be ready for and the rules to run if they are not ready by that time
- Quality Group - a list of checks to perform on curves or datasets
- Export Group - a list of items that a function is run at a set time, usually to export the data to a downstream system
- Approval Group - a list of email addresses of users that can approve the list of curves
- Subscription Target Group - a list of targets to send subscriptions to
Additionally every OpenDataDSL user has its frequently and recently used groups.
Also check out the available documentation pages:
Insight Reports extension
We have extended OpenDataDSL Insight Reports - we now support the use of Insights across the platform:
- Master Data - Master Data Insights
- Data - Data Insights
- Events - Event Insights
- Curves - Curve Management Insights
- Processes - Process Insights
- Executions - Process Insights
- Queues - Queue Insights
- Types - Type Insights
- Calendars - Calendar Insights
- Scripts - Script Insights
- Alerts - Alert Insights
- Excel Add-in - Excel Insights
Check out the available documentation page
Bugfixes
- Out of memory versioning a report
- Issue triggering processes from other processes
- Fix for duplicate alerts
Enhancements
- Widget Reports
- Add _created timestamp to all entities
- Automate dataset alert closure once waited for/late data is received
- Smart feed improvements
Hotfixes
- Change the implementation for the -ONDATE functionality incl. Smart Curves
- Fix for issue where group gets duplicated when changing the shared status
Apr-2025
Hotfixes
- Fix for timezone issue over DST
- Fix for issue running processes from other processes
Mar-2025
Hotfixes
- Fix for retrieving absolute periods from a curve affected by the timezone
- Fix for clashing inserts - changed to upserts
- Fix for saving quality checks on private datasets
- Fix for feature policies
- Fix for null pointer when saving a dataset from the portal
Feb-2025
This release mainly contains bug fixes/enhancements related to the Dataset Monitoring. Additionally, the release contains an isolated new feature to the Excel-Addin: The Insight Reports. This new enhancement provides the flexibility for the users to include insight reports to Excel. But not just that - from a product perspective it is a major step as we keep any new insight report idea separated from new product development releases, which makes us far more flexible.
Enhancements
- Excel Insights including Documentation update
- Support Audit Report on behalf of the client
- Support for using absolute period codes for expected tenors
- Expose event status and version information to time series and curves
- Add support for CurveSeries for dependant builds
Bugfixes
- Curves Management tab - Error message on Unhandled Exceptions
- Datasets: >4h Alert not triggered
- Error message in the Load phase
Hotfixes
- Check for event curves to trigger building dependent smart curves
- Simplifying Alert Monitoring by adding a key to Alerts
- Removing subscriptions for curves that are deleted
- Fixing the behaviour: Closing an Alert increments the number of Alerts rather than removing the Alert
Jan-2025
This release mainly contains improvements and extensions to the Dataset Monitoring, which enhances data quality by identifying inconsistencies, ensures accurate tracking and maintains compliance with your business standards.
Additionally, the release also includes some general improvements and bugfixes not related to Dataset Monitoring. For more information, check the lists further down.
Dataset Monitoring Enhancements
- Performance improvements
- Ability to clearly view Alerts that require attention - filtering on Datasets based on results of Completeness (based on number of expected tenors) and Quality Checks
- Screens for adding/editing Quality and Completeness checks on Datasets
- Include Completeness and Quality check results to General-tab overview
- Screens for adding, editing, publishing human curated Alerts to subscribers (ODSL operations updates) with a means of capturing multiple updates in one Alert
- Screens for easily viewing and subscribing/unsubscribing to Events and Alert records via MS Teams/email/queue channels
- Screens for closing system generated or human curated Events with reason/message
- Support links to specific filter setting (quick drill down) from main Dataset Monitoring page
- Support to add/remove Datasets from monitoring
- Support to filter for names and status in Dataset list
- Show overriden Dataset properties
- Support additional information (Alerts and Smart Feed status) for Datasets
- Support different impact status (Critical, High, Medium, Low) for Datasets
- Support additional properties/grouping options (Category, Priority, Provider) for Datasets
- Support Dataset Webportal actions (Save actual as expected, Mark as waiting, Run quality checks, Send alert) in sub-tabs
- Support additional delivery status (Active, Missing) for Datasets
- Support Smart Loader edit/configuration screen for Datasets
- Support Smart Loader edit/configuration in Feed-tab
- Include Loaders log information to Feed-tab
- Add new sub-tab Timeline for visualisation of the overall loading process including Process Log information
- Support for documentation and report links on Datasets
- Add new sub-tab Insights that includes individual Dataset reports (Auditing, Corrections, Data Usage, Delivery Scores, Holiday, Loaded Time Analysis, Tenor Delivery, Usage)
- Improve Dataset monitoring queue and SignalR usage
- Support client specific view of Dataset Monitoring
- Collecting and storing performance metrics - for further operational and/or reporting options
- Support Smart Loader to send ONDATE variable to process
- Data Management Topic Guide update
- User Guide update
General Bugfixes
- 403 error when writing events
- Aggregating from 1-minutely to 15-minutely seems to shift results
General Enhancements
- Gas day representation
- Support creating smart timeseries with Event Curve Dates as BASE
- Adding calendar to Event Curves
- Ensure curve substitution only works according to the configured calendar
- Support GET method on a timeseries to handle non-aligned dates
- Add feature policies to reduce portal clutter for basic users
- Support additional subscription targets
- Support metric based Alerts
Hotfixes
- Some curves not visible in Web-Portal because curve dates are autoscaled
- Fixes to rounding/precision
- Support building standard curves from curve series
- Support adding alerts for invalid tenant activity
- Improvement to policies for dataset management
- Option to update DSID to existing events
2024
Dec-2024
Bugfixes
- Use range end for rescaling data and fix index out of range issue
Enhancements
- Date range improvements
- Support properties and methods after expressions within parenthesis
- Allow specific data id to search for (combining filtering in search field)
- Support helpful functions to VarContract (extend Comparing/ordering forward contracts)
- Policy reporting: Fix for tenant policies and added create and run for rights
- Support for searching logs in process execution
- Support for rules for quality checks on datasets
Oct-2024/Nov-2024
This release contains server and Excel fixes and enhancements.
Bugfixes
- Loaders stuck at Initialising Process - add timeout handling to the LOADER
- Ensure numbers are not stored in scientific notation
- JSON Service - losing null values from “stringSeriesValues“ list
- Duplicated ondate after curve substitution
- #ONDATE problem when running a report (retrieving values from older date)
- Saving data aggregation type dropdown in Portal
- Events not visible in Portal - prevent an empty array (or anything else) from removing a data reference
- Updating a time series without a start date - add defensive code to prevent updating data VarReferences
- Push log messages from the script in real-time so the Portal can display them
- Fix disappearing log messages when a script fails
- Handle scripts with no return value
- Excel add-in (erase data from previous retrieval, timezone usage in range)
- Support precision after autoscaling
- Null pointer for conversions
- End date in curve tenor time series
- Fixing TypeError: Cannot read properties of undefined (reading 'forEach') - Refreshing a block of CurveTenorSeries in Excel
Enhancements
- Data Monitoring
- Aggregated Curve Chart in web portal
- Support Curve Series in Excel add-in
- Documentation in Portal - render code blocks using css with language specific syntax highlighting
- Curve ondates sorting in json
- Expose azure metrics as time series
- Support GET for multiple ids with expressions
- Support running a report with date rules
- Support progress status while loading data in Portal
- Add Portal and Excel support for VarMetricTimeSeries
- Performance improvements for large time series
- Support merging history data profiles - using a SmartTimeSeries with a special function sequence([])
- Add cron timezone to task information
- Add defensive code for while loop usage - add limit for while loop (1000 iterations); allow user to overwrite the limit with set while_limit n
- Time is now included in the range for time series, curve series and events
- Support setting autoscale off|on
- Support text based custom date formats in Excel add-in
- Support usage of "-" in Excel sheet naming
- Support currency and units conversion in Excel add-in
- Update some
attributein Excel add-in functions to$<attribute>
Sep-2024
Dataset Monitoring
The Dataset Monitoring GUI MVP allows users to inspect dataset loading and quality checks.
Add range support for curveseries
Added support for using a date range with a curveseries.
Aug-2024
Attachment filename
Added support for configuring attachment file name for the subscription email target.
Optional curve inputs
Added support for optional curve inputs.
Ignore precision setting
Added new syntax to ignore precision and use all available decimals.
set precision ignore
Support for last trading day in delivery rules
Added support for using the last trading day (expiry) in the delivery rules.
Generate relative property
Added support for dynamically generating relative tenors on the fly. This allows run to store absolute events and dynamically generate relatives for curves based on the curve expiry calendar.
Process execution termination
Added support for terminating running process executions
Jul-2024
Process history flag
Added support for running history loaders which do not trigger subscriptions
Process rescheduling
Added support for re-scheduling failed processes
Smart loaders
Added support for creating loaders that use dataset information intelligently to run processes to load data
Add support for date rules in queue subject
Support is added to enable adding custom date rules in the subject of a message to a subscription queue target
Jun-2024
Build a curve for a range of dates
You can now build a curve for a range of dates
ODSL Code:
run curve "AAA:ECS" with "between(2024-06-01,2024-06-05)"
REST API:
GET {{url}}/curve/v1/build/AAA:ECS
  ?_run=true
  &_range=between(2024-06-01,2024-06-05)
Authorization: Bearer {{token}}

GET {{url}}/curve/v1/AAA:ECS
  ?_function=build
  &_range=between(2024-06-01,2024-06-05)
Authorization: Bearer {{token}}
Added mytags for searching
Added support for customer specific tags on Master Data called mytags. These properties are included in free searching and tag searching
Support for running multiple instances of VSCode Extension
Now 10 instances are supported for language support (intellisense/ hovering etc.) and debugging.
Script Management
Added script management into the portal with the following features:
- View all public and private scripts that you have access to
- Visual comparison of script versions
- Tag and delete script versions
- Rollback to the previous version
- Merge code chunks from previous versions into the latest version and save it
Add Report Links
You can now add reports as links to various resources to display the report in the portal with the selected resource
For example, you can add a link to a report to an object and when viewing the object, the report will be shown as an additional tab.
Added Support for Azure Data Lake Storage
You can now push data to Azure Data Lake Storage using subscriptions.
Added support for API-TOKENS
You can now create and use API-TOKENS as an alternative way of authentication
Added support for webhooks
A new subscription target for webhooks which will POST the resource to the supplied webhook target URL
Added holiday/expiry function
A new function to return a list of holidays or expiries from a list of calendar id's and a date range
New function - combine
A new curve function which will combine 2 curves into 1 with the option to replace tenors in the base curve or only add new tenors.
Added support for value transformation in Event Curves
You can now add a valueTransformation property to an Event Curve as an expression to transform all input values, e.g. value * 1.1
New period code GCY
Added a new period code for handling of Gas Calendar Years
The GCY period code delivery is for a full calendar year with a gas day offset
Fixes
- Datetimes in timeseries and curveseries now always store the full datetime string
- Fix for financial spot tenor (SP) sorting
- Fix small issue running functions in scripts via REST API
May-2024
Selection of environment in Portal
Added support for switching to a data environment other than production. This can be done by clicking on your username at the top right of the portal and selecting the environment name to switch to
Edit documentation in Portal
Support documentation can be added to processes as per the documentation service. You can now edit the documentation directly in the portal using markdown
Change to script ids
Private script ids now contain the full path from the project directory to the filename
For example, if you have your scripts in a folder called ch-odsl-scripts and you place a script called test.odsl in a sub folder called process, the _id of the script will be:
ch-odsl-scripts\process\test
Apr-2024
Insight reports
Added support for interactive insight reports - See public report #INSIGHT_DM_CORRECTIONS
Subscribe buttons
Added subscribe buttons to allow a quick method of adding a subscription to:
- Master Data
- Data (curves, timeseries, matrices)
- Event Lists
- Reports
- Processes
Curve management buttons
Added manage button onto curves to allow you to manually push curves into curve management. Also added a delete button in curve management to allow you to remove curves from curve management.
Holiday calendar on event curves
Added support for attaching a holiday calendar onto an event curve which will provide the calendar for event curve tenor timeseries.
Added correction service
Added a service to report on data corrections
Mar-2024
Azure blob subscription target
Add support for sending subscribed data to an Azure Blob, this will allow for greater integration with Azure middleware services.
Amongst others, Azure Data Factory pipelines can be triggered from Azure Blob updates.
Documentation service
Added a new service documentation - this will be used for both:
- Product documentation in multiple languages - added by us in public
- Operational support documentation - added by the client in private
Support Documentation can be created using the VSCode extension in Markdown (file extension .md) and uploaded using the context menu item (Upload this document)
Support Documentation can be added to the following entities:
- Process - will display in the Process and Execution dashboards
- Curve - will display in the curve dashboard
Metric improvements
We have added some extra fields on the metrics that are recorded.
- httpstatus
- duration (ms)
- action
- responseSize (bytes)
Feb-2024
Custom period codes
Added support for custom period codes, allowing you to set specific expiry and delivery dates. Custom period codes start with 'C', e.g.
CFEB24_MAR24
Email subscription target update
Added support for adding subscribed data as email attachments.
CurveSeries performance improvements
Improved the read/write performance for Curve Series.
A Curve Series is used for forward curves with a few thousand tenors, e.g. hourly curves with 5 years of tenors.
Severe quality status for curves
Added a quality status severe indicating that the curve has been built, but it is incomplete or insufficient quality and needs to be rebuilt before using for exports etc.
Jan-2024
Timeseries auto-scaling
When retrieving timeseries with a large amount of observations, we now auto-scale the timeseries according to the following rules:
- Intradaily -> Daily
- Daily -> Monthly
- Monthly -> Yearly
The auto-scale thresholds are:
- Portal = 5000 observations
- Excel = 25000 observations
- api = 25000 observations
Curve Management Dashboard
We have introduced a curve management dashboard to monitor the lifecycle of curves managed in the system.
It has the following features:
- Configuration of build, quality, approval and export groups
- Build cut-off times with missing curve substitution rules
- Automated curve quality checks
- Manual approvals
- Export scripts to manage the export and feedback from the export system
Python SDK
Added a python SDK in PyPI
The python SDK for OpenDataDSL has the following features:
- Find any data in OpenDataDSL using the
listcommand - Retrieve any data using the
getcommand - Update any data (if you have permission) using the
updatecommand
2023
New data type - Events
Events are data that happened at a point in time for an amount of time, such as power station outages. We allow capturing these events and creating dynamic timeseries and curves from them.
New data type - Matrix
Added support for storing matrices for various statistical uses, e.g. correlation and covariance matrices. Added support for converting timeseries and curves into matrices
New service - Reports
New custom report functionality using custom ODSL code to generate any shape data to be presented in a report.
Reports can be formatted using Mustache which is a popular HTML templating syntax.
Granular Security Policies
Support for more granular security policies which can filter down to an individual document.
Correlation and covariance matrix functions
Add function to calculate correlation and covariance matrices.
Improvements to searching
Added more ways to perform searching for data
ODSL language improvements
- Added publish command to publish data to other tenants
- Added sendmail command to send data as an email
- Added set credentials command to store custom source user credentials
- Added element-wise multiply and divide operators for matrices
- Added single line if statements and conditional expressions
- Improved type creation, adding support for bespoke error messages
- Extended run command to support running reports
2022
Smart Data on Types
We add the ability to define smart timeseries and curves on a type. All objects that directly implement the type will have those smart data objects dynamically added.
User Tasks
User tasks are manual tasks assigned to users either by other users or by processes such as data quality. Tasks can be:
- Emailed
- Pushed to JIRA
More Statistics Functions
We will be adding for statistical functions for Timeseries and Curves.
More Statistics Functions
We have added a few more functions that can be used in your ODSL scripts:
- csum - Cumulative Sum
- cmax - Cumulative Maximum
- cmin - Cumulative Minimum
- cave - Cumulative Average
Calendar improvements
Improvements to the Intraday calendars:
- Add timezone
- Add a flag to indicate that it is an intraday calendar
Bulk updates and deletes
Add support for performing bulk updates and deletes
Added community version
Added FREE community version of the ODSL VSCode editor.
Quality Checks on Objects
Added support for defining constraints (checks) on an object type, and also defaults for null values
Aggregation Framework in the ODSL Language
Added language support for defining aggregations and aggregation stages.
Custom MongoDB Collections
We have added support for clients to connect to your own MongoDB clusters and use the tools directly on the collections holding your own data.
Data Packages
Data packages are pre-defined processes that users can deploy to their own environment to load data from providers into their private database. These data providers do not provide data that we can freely distribute, therefore the client has to load the data into their own private environment.
Events
Events are a thing that has happened at a point in time, similar to an observation in a TimeSeries only with a lot more information. Example events are:
- An order placed with a broker, exchange etc.
- A trade made with a broker, exchange etc.
- A planned or unplanned outage (REMIT Urgent Market Message)
Curve Change Values
Added a 'change' value to show the absolute change of all tenors in a curve from the previous built curve
Region support in ODSL code
Allow users to create regions in ODSL code to break a script up into smaller sections. These regions can be folded and run/debugged independently
Date Rule Grammar
Added support for using dynamic dates such as T-1W (go back 1 week)
Support for unit conversion custom factors
You can now add properties on TimeSeries or Curves to provide absolute conversion factors to a specified unit
Smart Curve Caching Improvements
Added support for caching options, you can now choose from:
- Never cache
- Cache on demand
- Cache when any dependencies are updated
- Cache based on a cron schedule
Curve Calendar Enhancements
Various minor improvements
- Use of holiday calendars for absolute movement of expiry calendars
- Add support for timezone offsets when using hourly period codes
Add support for TOP in FIND command
Allows you to return a small sample of items when using the find command in ODSL
Smart TimeSeries
The exciting introduction of Smart TimeSeries allowing you to create on-demand TimeSeries using a formula/expression.
Portal Smart Curves and TimeSeries
A new Smart Data section in the portal to 'play around' with Smart Curves and TimeSeries and save them to the Database.
Excel Add-in
Initial release of the Excel Add-in which will allow you to:
- Retrieve and update Objects
- Retrieve and update TimeSeries, Curves, Smart Curves and Smart TimeSeries
Gas Days
A new calendar supporting Gas Day hourly data aggregation and reporting.
Smart Curves
The exciting introduction of Smart Curves allowing you to create on-demand curves without using a Curve Builder.
Custom Period Codes
Support for custom, one-off and special period codes for use on contracts on Curves. See documentation
2021
Command Line Interface
Initial release of the CLI which will allow you to run scripts locally and initiate interactive sessions
New account management option in the Portal
This is the place to go to manage your OpenDataDSL account:
- Edit your personal details and upload an image
- Edit your company details and configuration settings
- Accounting information such as cost analysis, invoices and payments
- Support - raise a support ticket, data or enhancement request
TimeSeries Scaling
Added support for rescaling TimeSeries for both aggregation to a lower frequency and distribution to a higher frequency. See the documentation here
Improvement to calendar holiday rules
Added support for options on the following rule types:
New pause command
Add added a new command pause allowing you to pause execution of a script.
Syntax:
pause number ('second'|'seconds'|'minute'|'minutes'|'hour'|'hours')
Added support for using XSLTs in the XML Service
You can now use an XSLT transformer when reading XML data, e.g.
xdata = ${xml:xml,"xslt="+xslt}
Added new email target for queues
You can now emails using a subscription - see here for more information
A few minor enhancements
- Added daylightSavings function to test if the passed in date is a DST changeover day
Getting ready for the soft launch!
We are putting the finishing touches on the Web Portal that will allow us to start welcoming prospective clients to start using it. Designing the screens that will get you started
Added support for real-time events
We completed the first stage of the real-time API allowing for a more responsive experience in the GUI and the more collaboration opportunities in other applications
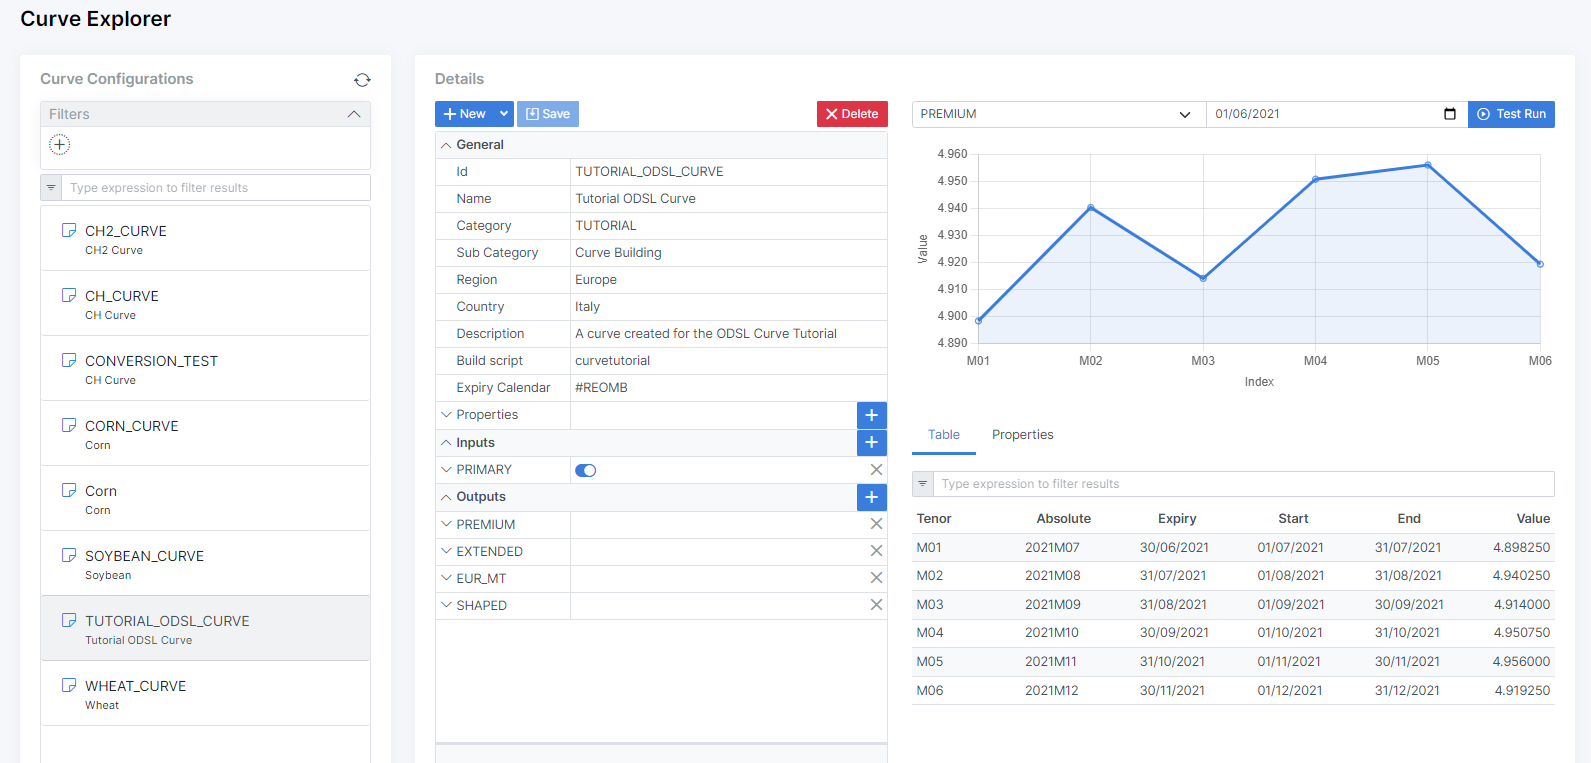
Curve configurations in the web portal
We have added the capability of creating and editing curve configurations in the web portal:
Added unit REST API
Added support for getting a list of units of measure symbols and details
ODSL grammar updates
Added support for manually triggering configured subscriptions
trigger subscriptionname for date
Added logout command to log your user account out and clear the user cache
logout
Added support for referencing tenors in a curve
tenor = curve["M01"]
Improvements to CRON configuration for processes
We have added support for the following special characters in cron expressions for processes:
-
'-' for a range of values in all fields
22 13-15 ? * MON-FRI *
-
'/' for increments in the MINUTE, HOUR, DOM and MONTH fields
-
0/15 13 ? * FRI-SUN * -
0 0/4 ? * FRI-SUN * -
0 0 1/5 * FRI-SUN * -
0 0 5 1/3 FRI-SUN *
-
-
'W' for nearest weekday - this will fire on a Friday if the DOM falls on a Saturday or a Monday if the DOM falls on a Sunday
0 0 15W 1 ? *
-
'#' for week of month as DOW#week number
-
0 0 ? 1 6#3 * -
0 0 ? 1 6#1,6#3 *
-
-
'L' for last DOM or DOW
-
0 0 L 1 ? * -
0 0 * 1 L *
-
REST API improvements
We added a _search query parameter to allow for text searching of objects. Simply pass in a search expression to get results based on values in the fields: _id, name, description and classification.
Base Object Type
We defined a base object type that all types derive from which contain the following fields:
- name
- description
- classification
- geolocation
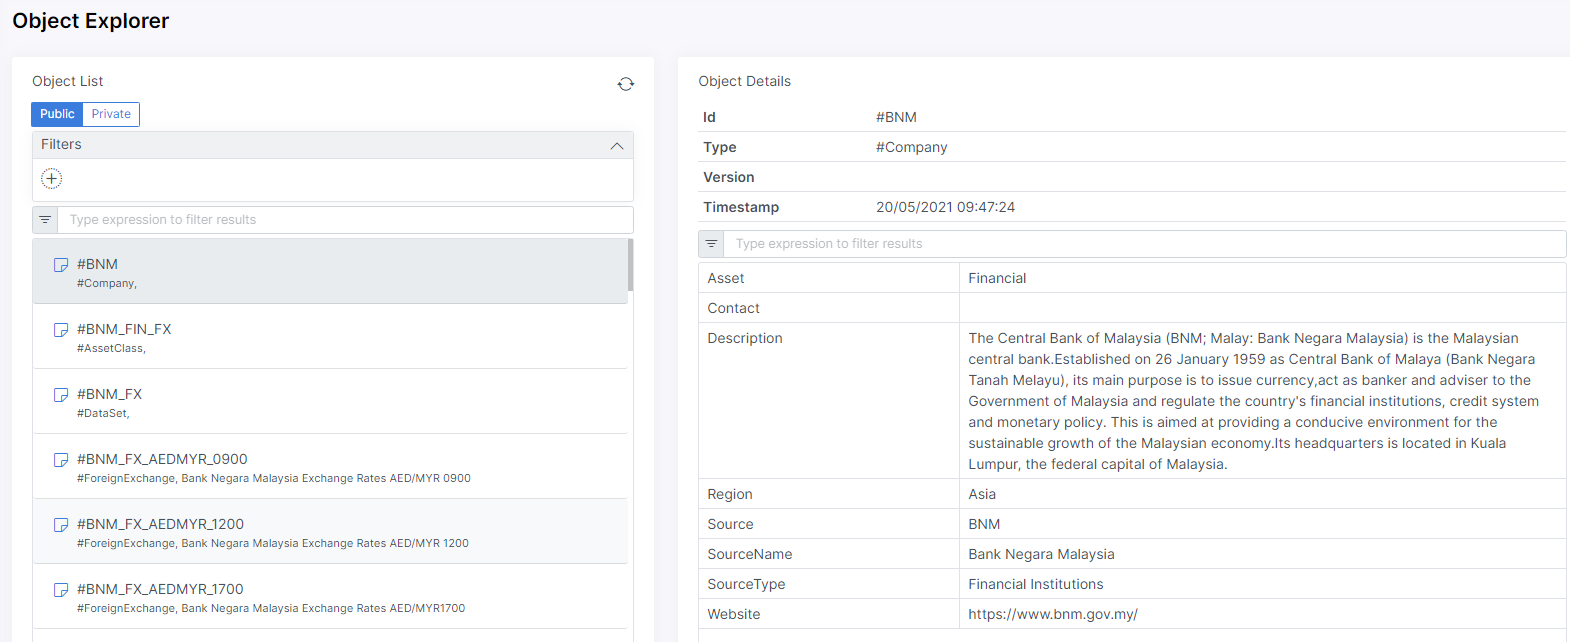
Objects and Data in the web portal
Charts in the web portal
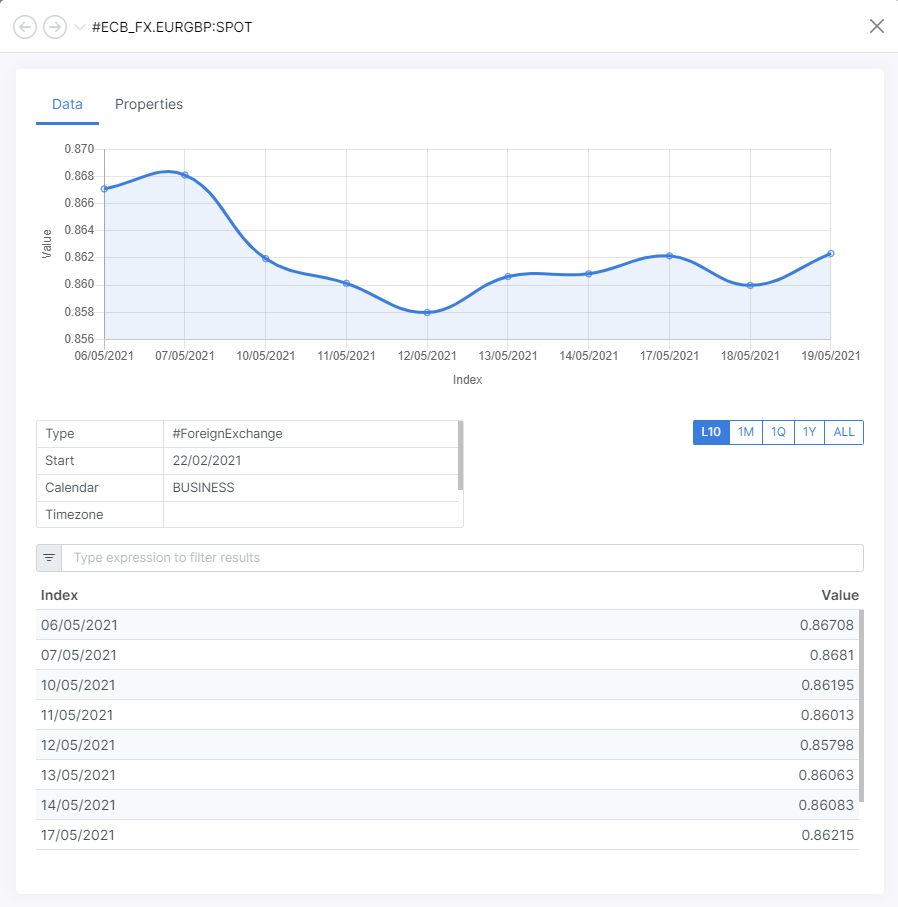
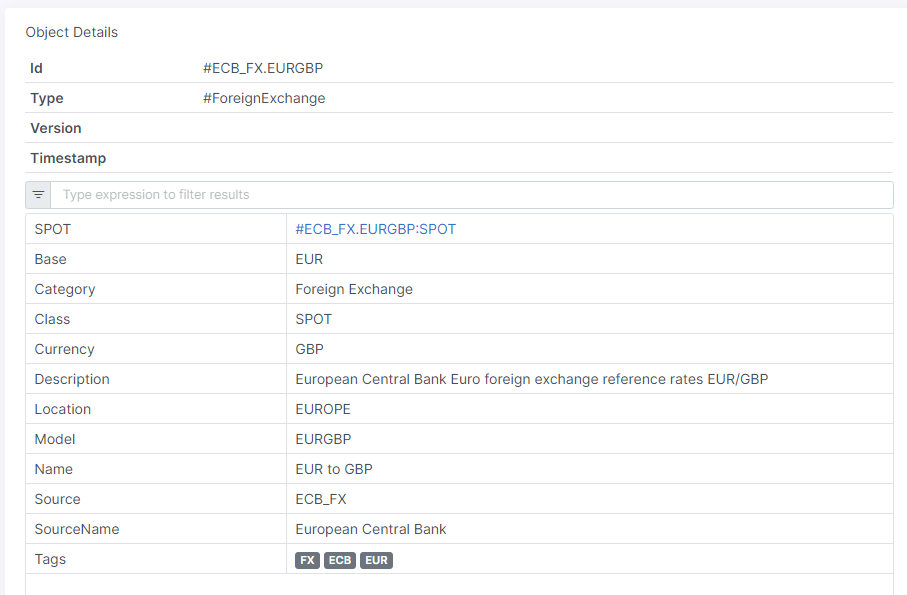
Links in the web portal
Links allow you to view related data and information
Curve Building Support
We added support for creating your own forward curves using logic created in OpenDataDSL scripts. You can create an object of type #CurveConfig with 1 or more inputs and 1 or more outputs and save to the new CURVE service, example configuration:
MY_CURVE = object as #CurveConfig
    name = "My Curve"
    expiryCalendar = "REOMHENG"
    buildScript = "simplecurve"
    inputs\[0\] = object as #CurveConfigInput
        key = "PRIMARY"
        id = "#MATBAROFEX.ROS.SOJA.FUT:CLOSE"
        required = true
    end
    outputs\[0\] = object as #CurveConfigOutput
        name = "CURVE"
        code = "multiplyByFactor(PRIMARY, factor)"
        factor = 1.5
        currency = "EUR"
        units = "MWH"
        expiryCalendar = "REOMHENG"
    end
end
save ${curve:MY_CURVE}
Data aggregation support
Added the ability to filter, group and aggregate any data using ODSL and the REST services, e.g.
summary = aggregate ${exec}
    match service="ETL"
    group _id="$status", qty=count()
    sort qty desc
end
Add range support for time-series
Add _range query option to specify a date range for time-series retrieval. Add 3 methods:
- last(n) - last n observations
- from(d) - from date d to the latest
- between(d1, d2) - between 2 dates, d1 and d2
Object and data storage
Improvements to the way objects and data is stored to allow greater query flexibility. Users can now query across all types of objects.
Custom save and delete reasons
Added the ability to define a ‘reason’ on all save and delete methods. This reason is placed in the audit log and the saved object (if versioned)
Search object properties and return data
Added the ability to query object properties, but return data entities using the profile command, e.g.
// Fetch all data for all ECB_FX currencies data = find profile SPOT from ${currency:public} where source == "ECB_FX"
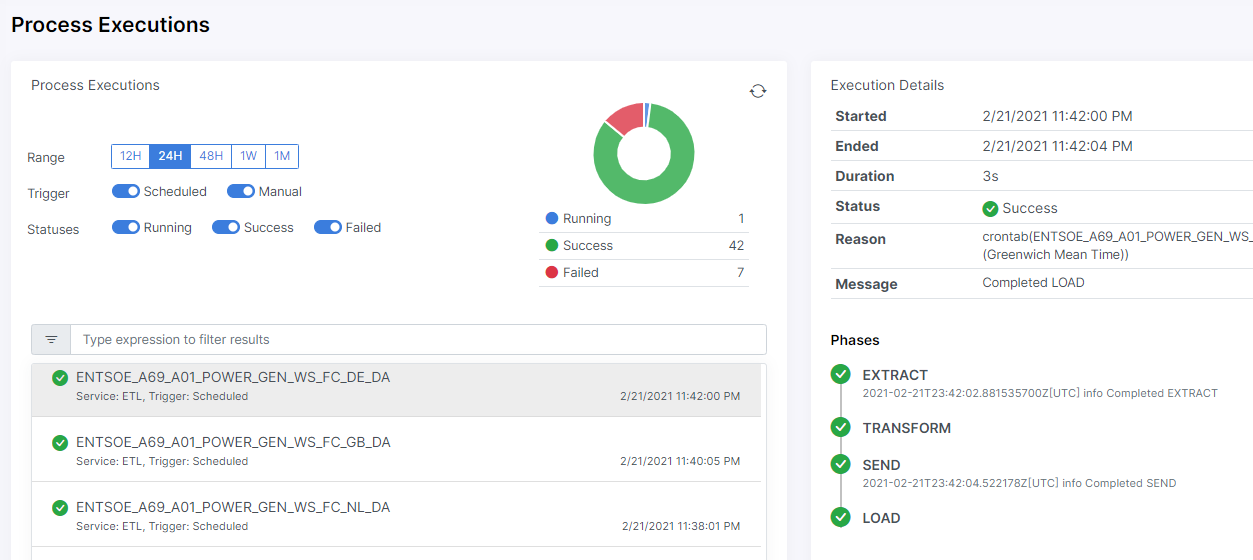
Process Executions in the web portal
Added the ability to view process executions in the web portal:
Indexes
Add ability for users to create custom database indexes to improve query performance.
Queues
Add ability for users to create and manage their own queues. Each queue can either be consumed by the loader process or can be left open to be consumed on-premises - see more here
2020
Geospatial queries
Add ability to add geometric shapes as a data property on objects and support geospatial queries on data, such as finding all objects within a radius of a point or within a polygon - see more here
Versioning
Add consistent versioning of data in the following services:
-
Types
-
Objects - definable by object type
-
Transformers
-
Extractors
-
Calendars
-
Actions
-
Workflows
-
Scripts
-
Processes
Auditing
Add audit records for all create, update and delete actions on all services
Queue Management
Allow users to add new queues and configure automatic data loading into proprietary ODSL database
Maths Functions
- Simple regression
- Basic descriptive statistics (min, max, mean etc)