Building an aggregation
In this walk-through you build the aggregation Northgate Energy's market data team uses each evening: every dataset delivery for the day, with its status, the time it loaded and its score, problems first.
1. Open the Aggregator
In the portal menu, open Information, then Aggregator. The Aggregations tab lists the aggregations your organisation has saved, with examples to start from below them.
Select New aggregation. The workspace opens with an empty pipeline on the left and the results on the right.
2. Choose the service and the test dates
Fill in the toolbar:
| Field | Example | Notes |
|---|---|---|
| Service | Dataset deliveries (dataset_delivery) | The data the aggregation reads |
| Source | common | The deliveries of the common datasets. Only asked for services with more than one source. |
| Ondate | 15/10/2026 | The test value for @{ondate} |
| Start, End | 01/10/2026, 15/10/2026 | The test values for @{start} and @{end}. This aggregation does not use them. |
The test dates are only used in the workspace. A report fills the placeholders with its own dates.
3. Look at the fields
Under the pipeline, select Sample documents. The Aggregator reads five documents of the service and lists their fields.
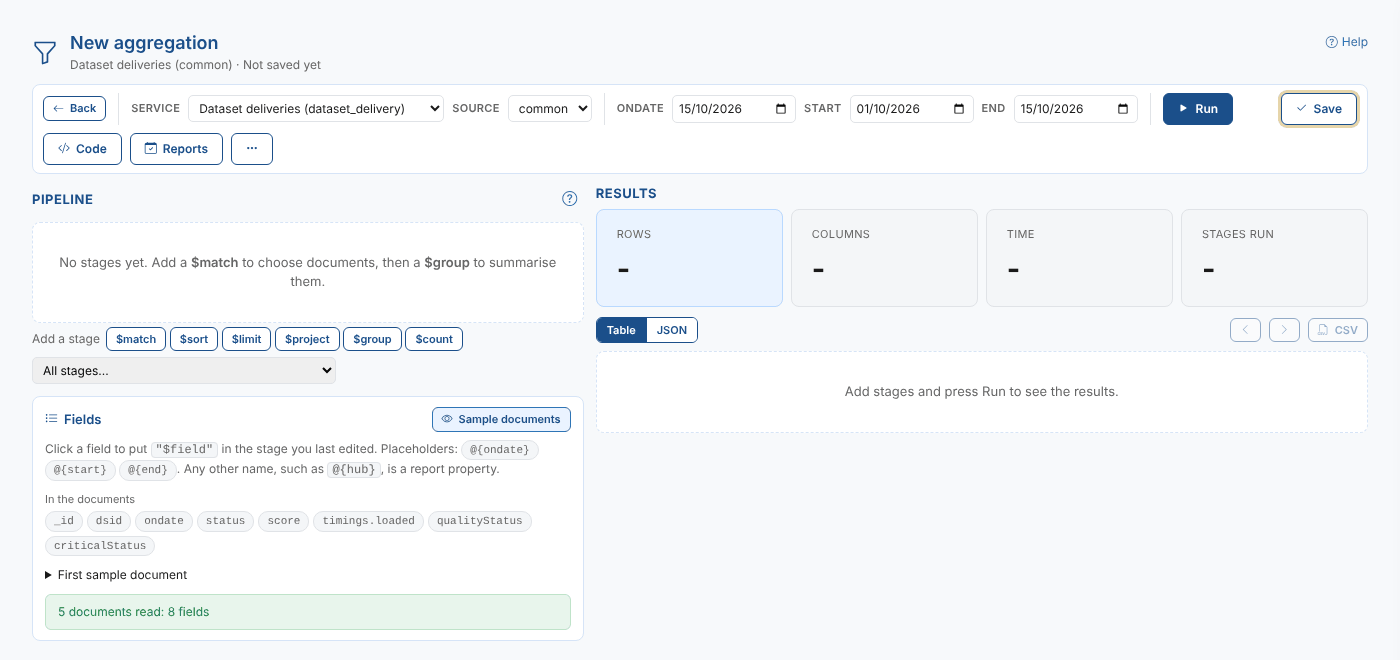
A delivery has a dsid (the dataset), an ondate, a status (such as loaded, partial, late or missing), a score from 0 to 4 and timings, with the time it loaded. Click a field to put it, as "$field", into the stage you last edited.
4. Add the stages
Add three stages with the buttons under the pipeline, and type their values:
| # | Stage | Value | What it does |
|---|---|---|---|
| 1 | $match | {"ondate": "@{ondate}"} | Keeps the deliveries of the day |
| 2 | $project | {"_id": 0, "dataset": "$dsid", "status": 1, "loaded": "$timings.loaded", "score": 1} | Keeps four fields and gives them the names to show |
| 3 | $sort | {"score": 1, "dataset": 1} | Puts the lowest scores, the problems, first, then sorts by dataset |
Use $project to give fields simple names, such as loaded instead of timings.loaded. The report template shows fields by name, so simple names make the report easier to read and to edit.
5. Run it
Select Run (or press Ctrl+Enter). The results show twelve deliveries for 15 October: the Argus assessment is late, the Platts assessment is missing and the EEX EUA futures are partial. The rest have loaded.
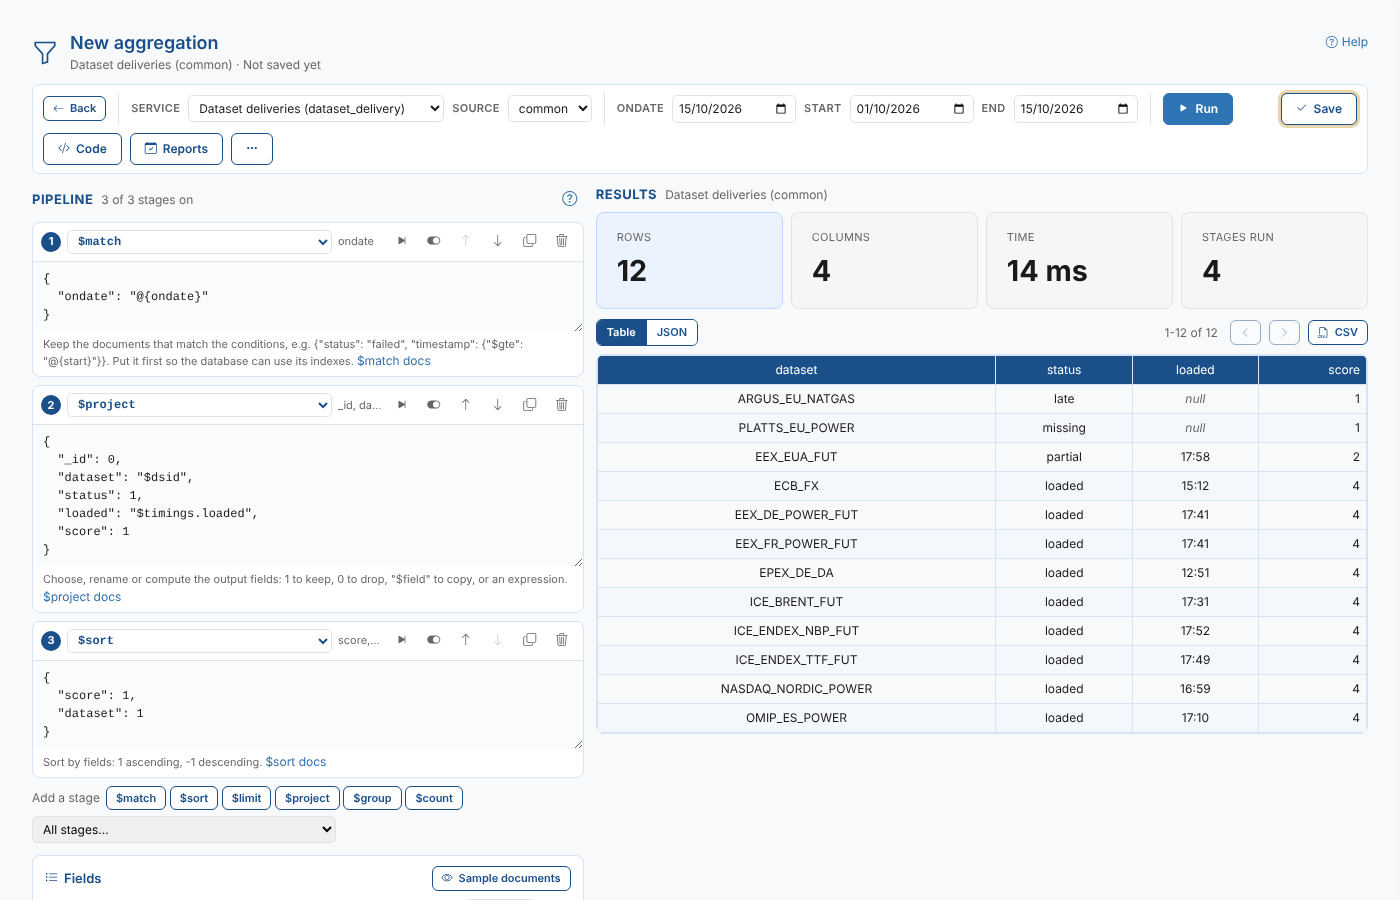
To see what the pipeline produces part way, select Run up to this stage on a stage. To try the pipeline without a stage, turn the stage off.
6. Save it
Select Save and fill in the dialog:
| Field | Example | Notes |
|---|---|---|
| Name | Dataset deliveries for the day | Shown in the lists, in the report and in the email |
| Description | Every dataset delivery for the ondate, with its status and load time, problems first | Shown under the name |
| Key | dataset_deliveries | Made from the name, and can be shortened. Lower case letters, digits and underscores. It cannot be changed later. |
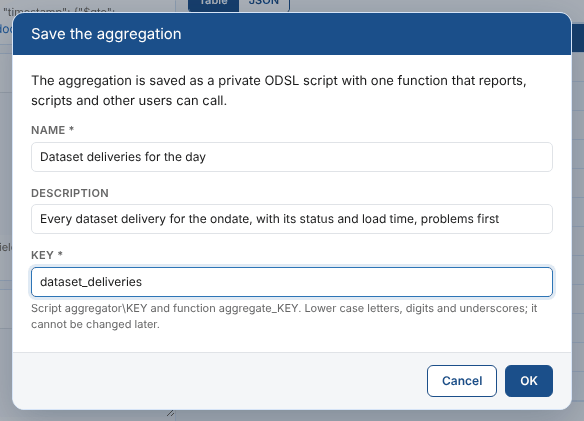
The aggregation is saved as the private ODSL script aggregator\dataset_deliveries, with the function aggregate_dataset_deliveries. The header of the workspace shows the script, and the aggregation is listed on the Aggregations tab.
The menu (... in the toolbar) has more:
| Menu item | What it does |
|---|---|
| Name and description | Changes the name and description |
| Save as a new aggregation | Saves a copy under another name and key |
| Download the definition | The aggregation and its pipeline as JSON |
| Paste a pipeline | Replaces the stages with a JSON array of stages, for example one copied from another tool |
| View the saved script | Shows the ODSL script that was saved |
| Delete | Deletes the aggregation, after asking. Its reports, their templates and their email automations are deleted with it. |
Next
- Running it from code: call the aggregation from ODSL, curl, Python or JavaScript
- Creating a report: store the result for each date and show it in the house style