Creating a report
A report runs a saved aggregation for a date and stores the result for that date. Stored reports can be opened on the Reports screen, shown with a house-style template, kept as a record of what the data looked like on the day, and emailed.
In this walk-through, Northgate Energy's market data team turns Dataset deliveries for the day into a report that runs each weekday at 18:00.
1. Open the reports panel
Open the aggregation in the workspace, select Reports in the toolbar, then New report.
A report runs the saved script, so the aggregation must be saved. If you have unsaved changes, the Aggregator offers to save them first.
2. Name the report
| Field | Example | Notes |
|---|---|---|
| Report ID | AGG_DATASET_DELIVERIES | AGG_ and the aggregation key by default. Letters, digits, _, . and -. It cannot be changed later. |
| Name | Dataset deliveries for the day | Shown on the Reports screen, in the template and in the email |
| Description | Every dataset delivery for the ondate, with its status and load time, problems first | Shown under the name |
3. Set the schedule
Tick Run on a schedule and store the result for each date, and choose When: Weekdays at 18:00 UK time. The cron, 0 18 * * MON-FRI * EU1, is filled in for you.
Schedule and email lists the other choices and explains the default range.
4. Choose the template and its columns
The template decides how a stored report looks. There are two:
| Template | What you get | When to use it |
|---|---|---|
| House-style Mustache template | A header with the report name, description and date, and a table of the columns you choose, in the OpenDataDSL house style. Saved as the script aggregator\templates\AGG_DATASET_DELIVERIES, which you can edit. | Reports people read every day |
| Generic table | Every column of the rows, sortable and paged, with CSV export | Quick reports, or rows whose columns change. Nothing to maintain. |
Northgate Energy keeps the house-style template. The Columns come from the last results in the workspace; Columns from a test run takes them from a run on the platform instead. For each column you can:
| Change | How |
|---|---|
| The heading | Type it under Heading: Dataset, Status, Loaded, Score |
| The type | text, number (right aligned) or date |
| The order | Move up, Move down |
| Leave it out | Leave out |
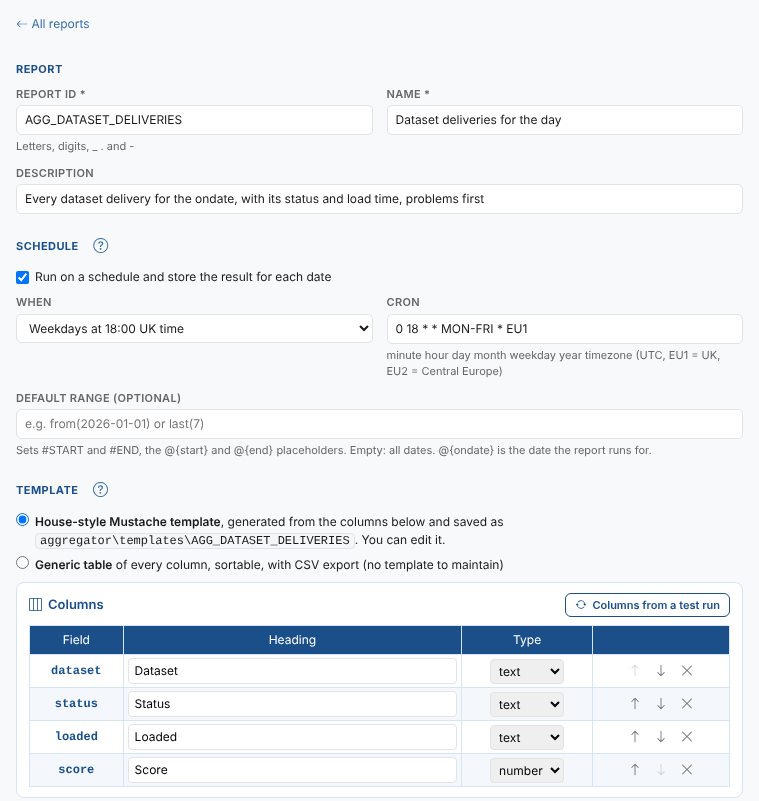
Changing a column writes the template again. Once you edit the template by hand it is kept as it is, and Generate again goes back to the generated one.
5. Preview it
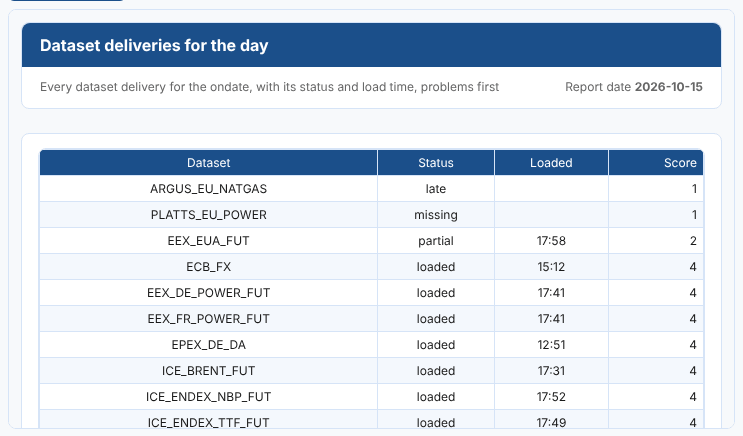
Select Preview. The saved aggregation runs on the platform for the Ondate test date, without storing anything, and the result is shown in the template.
6. Save the report
Select Save report. The report configuration and its template are saved, and the report is listed on the Reports tab of the Aggregator and on the Reports screen. From now on it runs at 18:00 each weekday and stores that day's deliveries.
The report runs aggregate_dataset_deliveries(#ONDATE, #START, #END, #REPORT): the date it runs for, its default range and the report configuration itself. Saving the aggregation again changes what the report produces from its next run.
7. Build a date and look at it
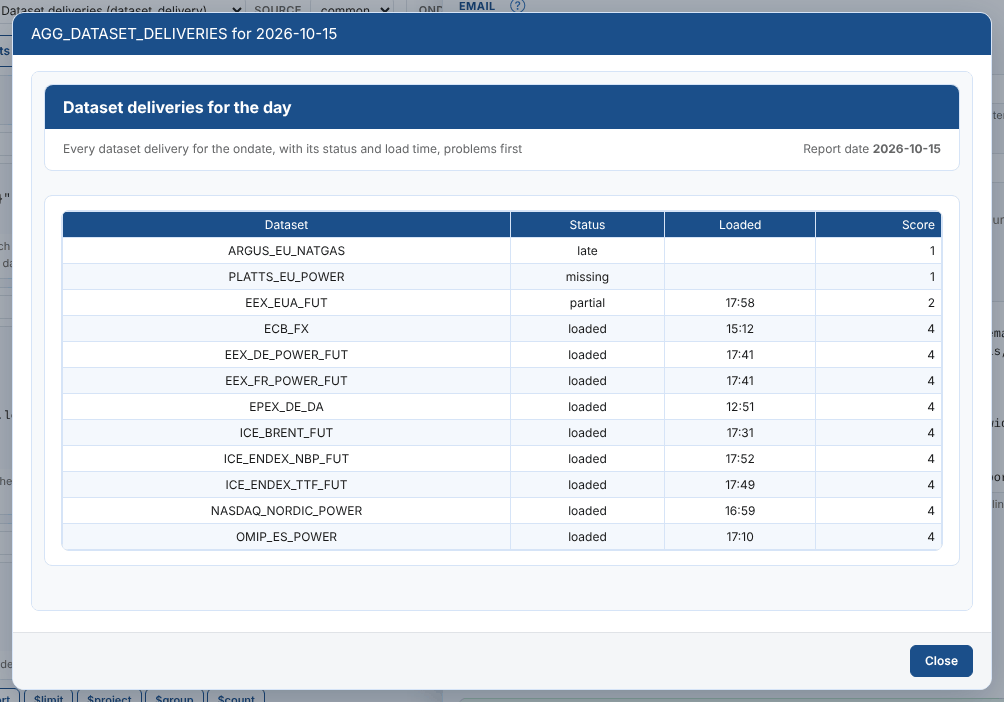
You do not have to wait for the schedule. Under Builds, choose a date and select Build this date: the report runs for that date and is stored, exactly as the schedule would do it, and the email is sent when the report has one.

Select a stored date to see it as the platform shows it:
One aggregation, several reports
When the aggregation uses report properties, each report fills them with its own values. Northgate Energy's ICE desk wants only the ICE datasets, so the market data team adds @{datasets} to the aggregation's $match (test value .*, every dataset) and creates a second report:
| Field | Example | Notes |
|---|---|---|
| Report ID | AGG_ICE_DELIVERIES | |
| Name | ICE deliveries for the day | |
| Description | The day's deliveries of the ICE datasets, problems first | |
| @{datasets} | ^ICE_ | A regular expression: dataset IDs that start with ICE_ |
Report properties in the report editor lists each placeholder the aggregation uses. A new report starts with the test values.
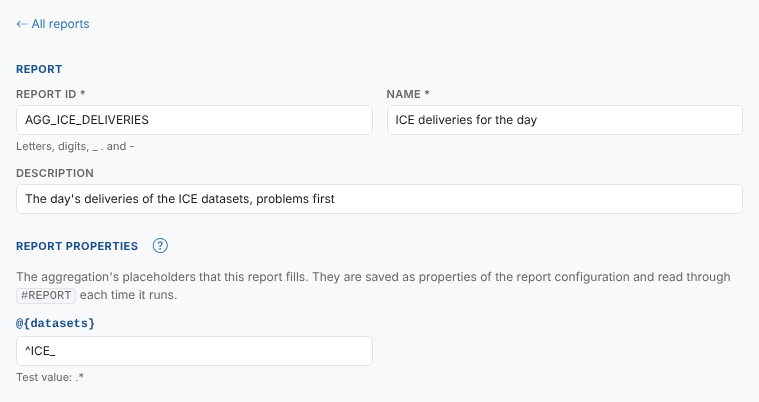
The values are saved as properties of the report configuration, properties.datasets here, and Preview runs with them:

The original report, AGG_DATASET_DELIVERIES, does not set datasets, so it uses the test value and still lists every delivery. Both reports run the same saved aggregation, so a change to the pipeline reaches both.
Change a report's value at any time by opening the report and saving it: the next run uses the new value. You do not need to save the aggregation again.
Editing the template
The generated template is ordinary Mustache with the house style included. {{name}}, {{description}} and {{ondate}} are the report's, and {{#data}} ... {{/data}} repeats for each row, with the fields of the row by name. The rows of Northgate Energy's template:
{{#data}}
<tr>
	<td>{{dataset}}</td>
	<td>{{status}}</td>
	<td>{{loaded}}</td>
	<td class="num">{{score}}</td>
</tr>
{{/data}}
{{^data}}
<tr><td colspan="4" class="loading-note">No rows for this date</td></tr>
{{/data}}
A template can only show fields with simple names, such as status or _id.playbook. Use $project to give fields the names and values you want to show, and $round to round numbers, which the template prints as they are.
Next
Schedule and email: email the report to the market data team each time it is stored.