What is the Aggregator?
Most questions about your platform data are summaries: how many, how much, which ones, since when. The Aggregator answers them with an aggregation pipeline that you build and run in the portal, on any platform service. For example:
- Which of today's dataset deliveries are late, partial or missing?
- How many Fusion AI tokens did each user use this month?
- Which automations failed this week, and with what error?
- How many timeseries and curves of each type do we hold?
When the answer is useful every day, the Aggregator turns it into a report: stored for each date, shown in the house style, emailed to the people who need it, and callable from your own scripts and code.
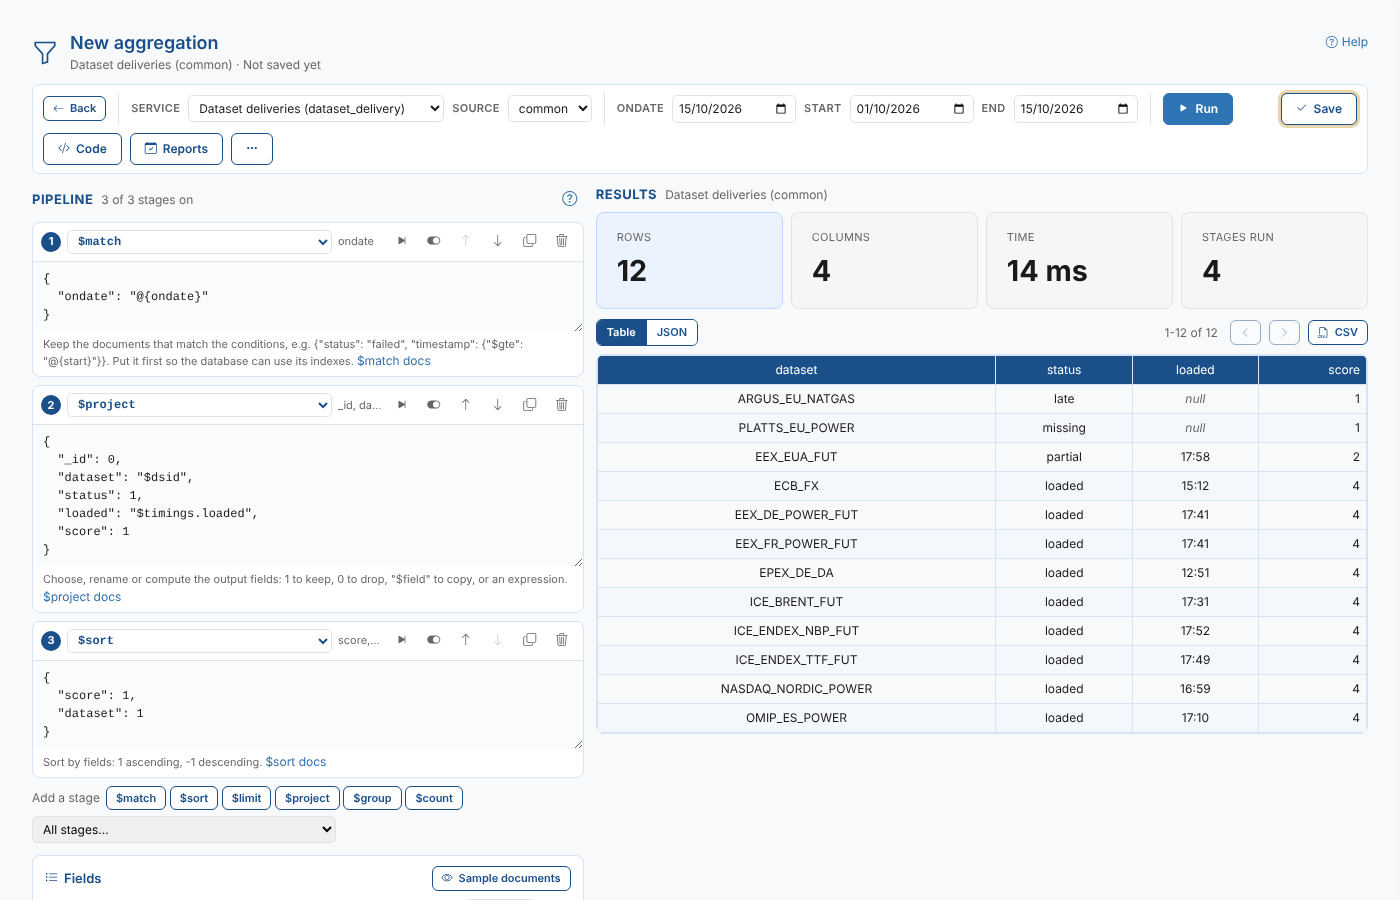
Throughout these pages we follow the market data team at Northgate Energy, a gas and power trading company. Each evening they need to know whether the day's settlement prices arrived: ICE Endex TTF and NBP futures, EEX German and French power, EUAs, Brent, the ECB FX rates and a few assessments. They build one aggregation, Dataset deliveries for the day, that lists every delivery with its status, and email it to market-data@northgate-energy.com at 18:00 each weekday.
Key concepts
| Concept | What it is |
|---|---|
| Service | The platform data an aggregation reads: dataset deliveries, master data objects, timeseries and curves, automation logs, Fusion AI usage and more |
| Pipeline | A list of stages run in order. Each stage takes the documents from the one before and passes on new ones: $match keeps some, $project reshapes them, $group summarises them, $sort orders them. These are MongoDB aggregation stages. |
| Placeholders | @{ondate}, @{start} and @{end} in a stage are replaced with dates, so one aggregation works for any day or range. Any other name, such as @{datasets}, is a report property, so one aggregation can serve several reports. |
| Aggregation | A pipeline saved as a private ODSL script with one function that runs it and returns the rows |
| Report | Runs a saved aggregation for a date, by a schedule or when you ask, and stores the result for that date |
| Template | How a stored report looks: a house-style Mustache template generated from the columns you choose, or a generic table |
| An automation on the report that formats each stored date with an email template and sends it |
What you get
The extension adds these screens to the portal:
| Screen | What it does |
|---|---|
| Information, Aggregator, Aggregations tab | Your saved aggregations, and examples to start from |
| Information, Aggregator, Reports tab | Every report made from an aggregation, with its schedule and email |
| The workspace | Build the pipeline, run it and see the rows; save it; get the code; create and edit its reports |
| Reports, Aggregator tab | For the selected report: its aggregation, schedule, email and stored dates |
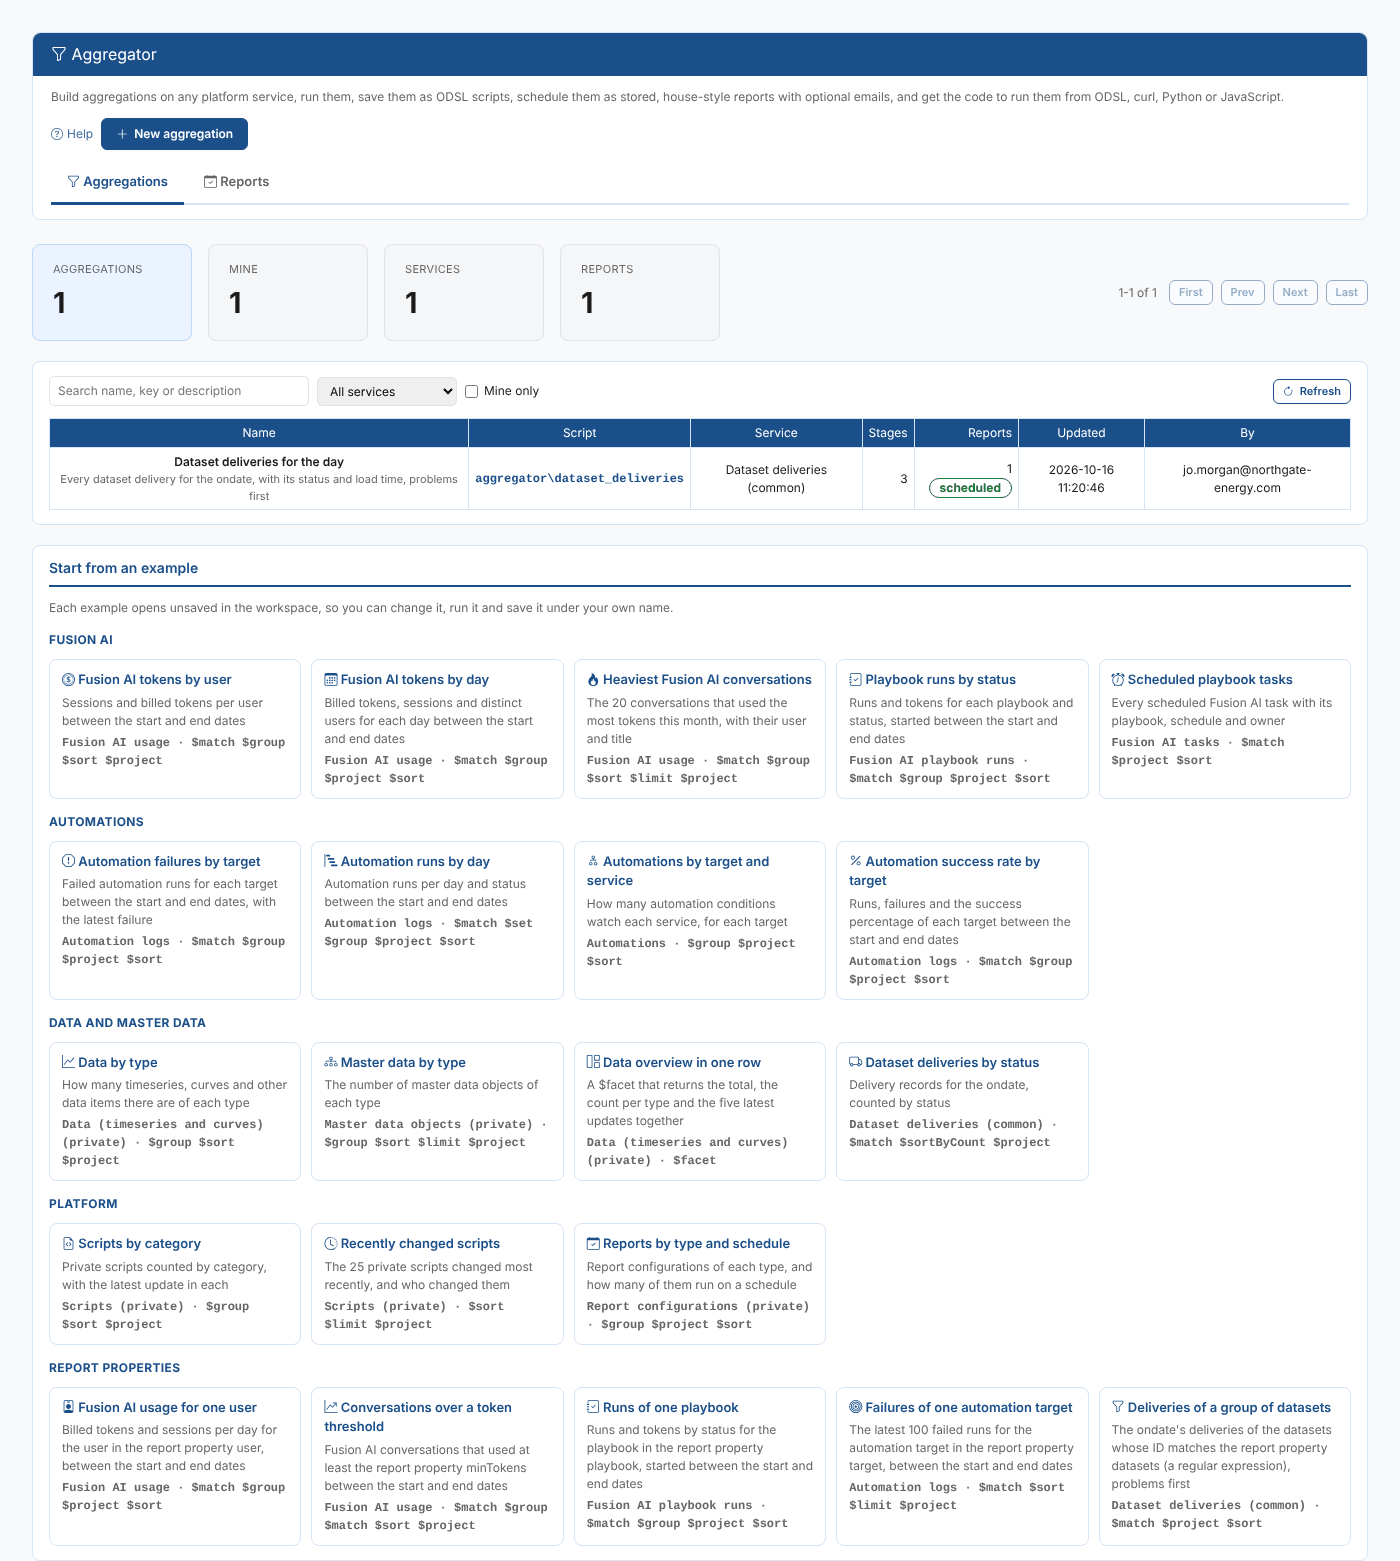
The quickest way to start is an example. On the Aggregations tab, pick one under Start from an example, select Run, then change it to suit you and save it under your own name.
Where next
- How it works: services, stages, placeholders and what is saved
- Building an aggregation: build the dataset deliveries aggregation step by step
- Running it from code: ODSL, curl, Python and JavaScript
- Creating a report: store the result for each date, in the house style
- Schedule and email: run it every day and send it
- The Reports screen tab: the Aggregator tab on the Reports screen
- Examples: the examples to start from
- Reference: where everything is saved, and troubleshooting