The chart board
The Chart board tab puts several curves and timeseries on one chart. The number beside the tab is how many series it holds. The board is kept for you as it is, on any computer you sign in to.
Adding series
- In Explore, tick curves and timeseries and select Chart (or Chart them on the selection bar).
- Open an item and select Add to the board; on a curve's Curve tab it goes on as it is shown (latest, an ondate, or against the previous curve), and Tenor history adds the chosen tenors.
- On a record's Overview, Chart them adds all its curves and timeseries.
- On an option chain, select a strike to add its history.
- On the board, Add takes a data id: a curve, a timeseries, or a curve id followed by a tenor (
NGE.GAS.TTF:FORWARD:M01) for that tenor's history.
The board holds at most 24 series.
The series
Each series has a row on the right, coloured as on the chart.
| Control | What it does |
|---|---|
| The tick | Shows or hides it |
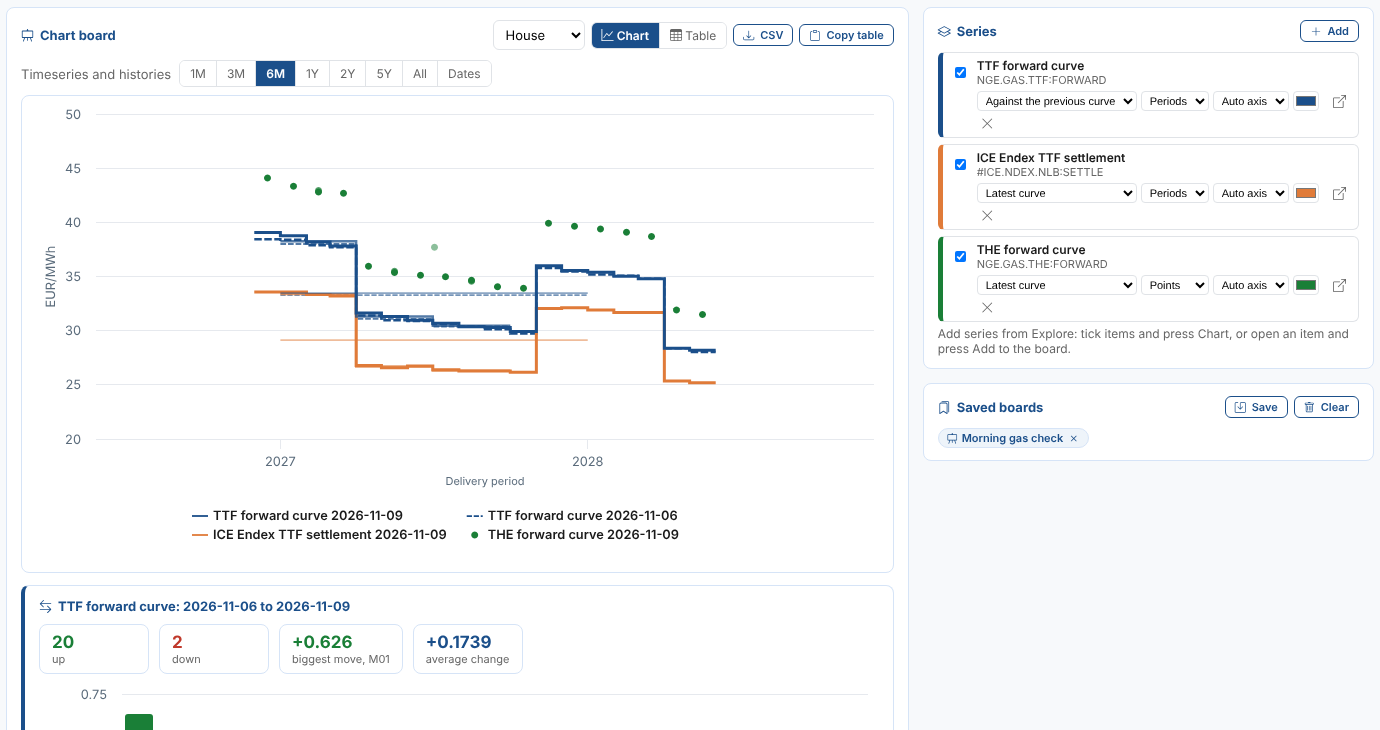
| What to show (curves) | Latest curve, On an ondate (choose the date: the curve on it or the last one before), Against the previous curve (the previous curve is drawn dashed, and a What changed card is shown below the chart), or Tenor history (type the tenor) |
| Drawn as | For curves Periods, Line, Column, Area or Points; for timeseries and histories Line, Column, Area, Steps or Points |
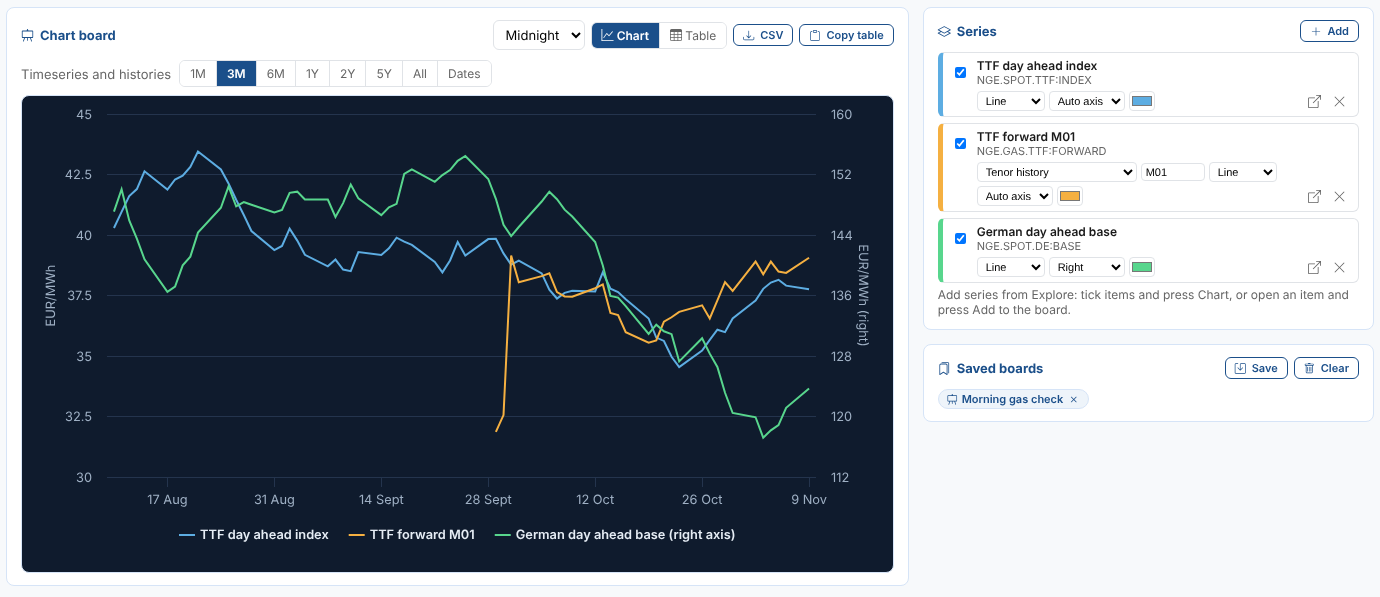
| Axis | Auto axis puts a series on the right axis when its currency or units differ from the first series, or its values are of a very different size; Left or Right to choose |
| The colour | Any colour |
| Open | Opens it in Explore |
| The cross | Takes it off the board |
When the board has curves, everything is drawn on one date axis by delivery period, and a timeseries is drawn as a line through its values. With timeseries and tenor histories only, the axis is their dates. The range above the chart (1M to 5Y, All or Dates) applies to timeseries and tenor histories.
Themes, table and CSV
Choose a theme for the chart: House, Midnight (dark), Paper or Neon. Table shows the values instead of the chart, a row per delivery period or date and a column per series. CSV downloads them and Copy table copies them, to paste into Excel.
What changed on the board
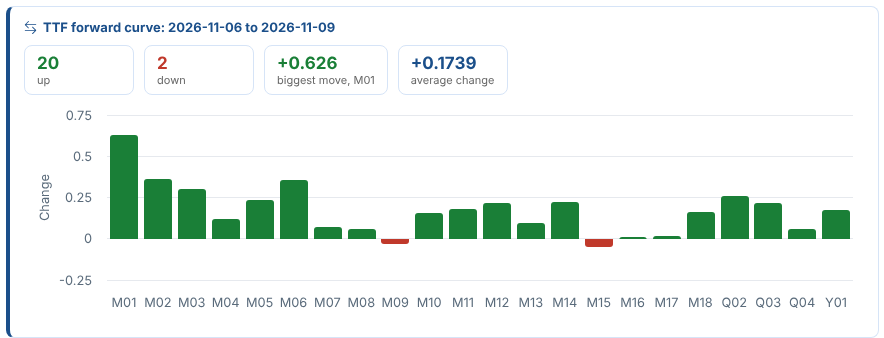
Every curve shown Against the previous curve gets a card below the chart: how many contracts went up and down, the biggest move and the average change, and the change of each contract.
Saved boards
Save keeps the board under a name, such as Morning gas check: its series, range and theme. Select a saved board to open it again (it replaces what is on the board), or its cross to delete it. Clear empties the board.