Options
Options data (event options, see Options data) has an option chain for every ondate: for each tenor a table of strikes with call and put values such as the settlement price, volatility, delta, open interest and volume. Find options with the Options kind in the finder. Priya opens NGE.GAS.TTF:OPTIONS, the TTF options.
Every options tab has an Ondate (latest by default, or one of the last 90) and CSV (all tenors), which downloads every tenor, strike and side of the chain, and Copy table, which copies them to paste into Excel.
The option chain
Option chain shows one tenor: calls on the left, the strike in the middle and puts on the right. Choose the tenor, and the columns to show above the table. The at the money strike, where the call and put prices are closest, is outlined.
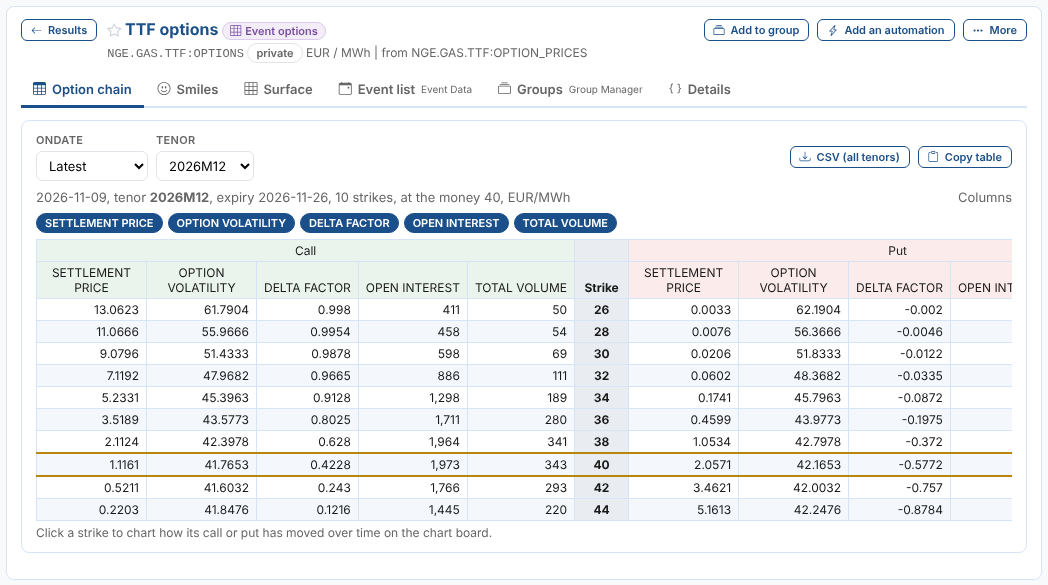
Select a strike to chart its history: choose the call or the put and the column, and it goes on the chart board as a timeseries of its value on each ondate (the id is the options id followed by the tenor, strike, C or P and the column).
Smiles
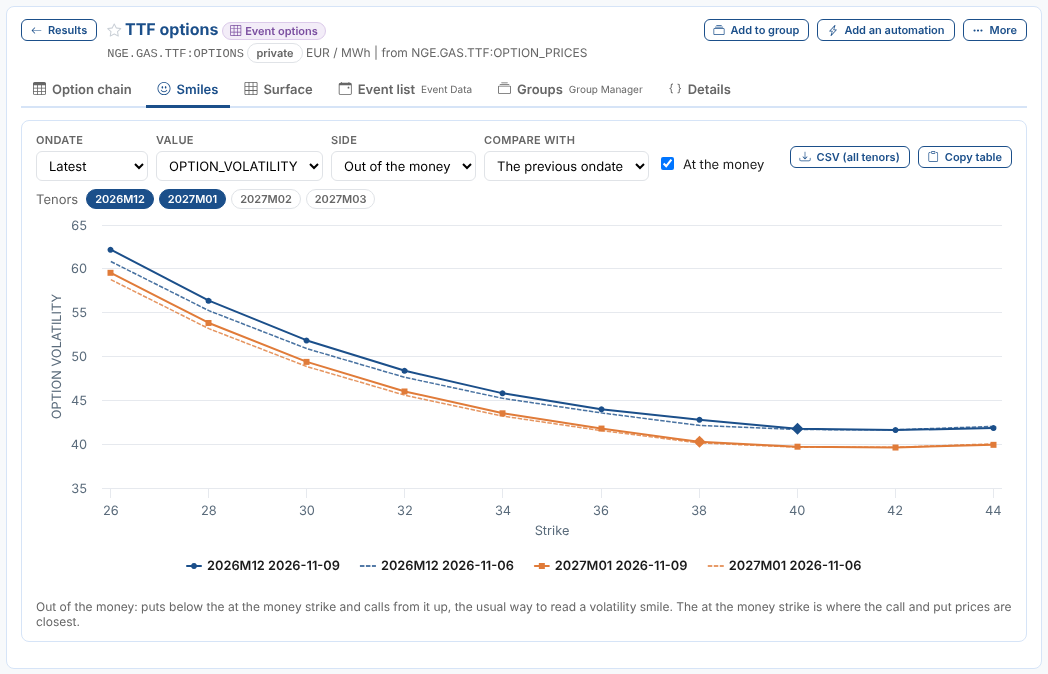
Smiles draws the value of each strike, one line per tenor. Choose the tenors above the chart.
| Control | What it does |
|---|---|
| Value | The column to draw; a volatility column is chosen first |
| Side | Out of the money (puts below the at the money strike, calls from it up, the usual way to read a smile), Calls, Puts, or Calls, else puts |
| Compare with | The previous ondate, or another ondate: its smiles are drawn dashed in the same colours |
| At the money | Marks the at the money strike of each tenor with a diamond |
The surface
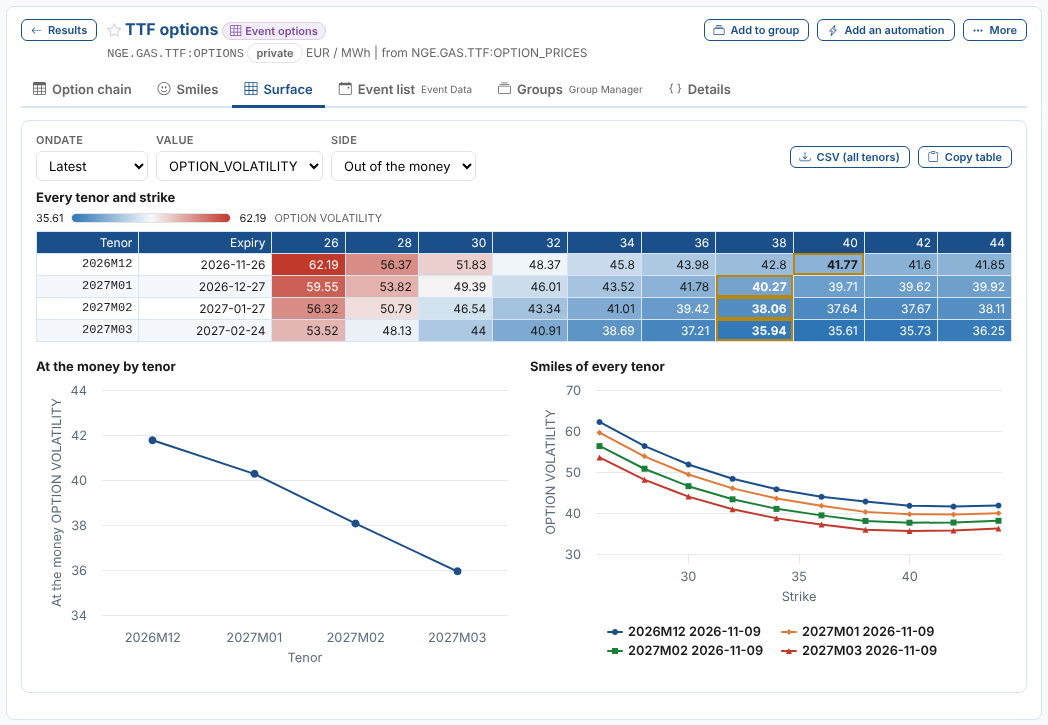
Surface shows the whole chain at once:
- Every tenor and strike: a heat map with a row per tenor and a column per strike, coloured from the lowest value (blue) to the highest (red), with the at the money strike of each tenor outlined.
- At the money by tenor: the term structure, the at the money value of each tenor.
- Smiles of every tenor: every smile on one chart.
Choose the Value and the Side as for smiles.