What is the Data Explorer?
Every analyst starts the day the same way: find the curves and timeseries that matter, look at what moved overnight, and check the odd one out. The Data Explorer is one screen for that. It brings master data and data together, so you can go from a record to its curves, from a curve to what changed since yesterday, and from a handful of items to one chart, without changing screens. It answers questions like:
- Where is the German power base curve, and which other power curves do we hold?
- What changed in the TTF forward curve since the previous ondate, and which tenor moved most?
- How has the front month moved over the last six months, next to the day ahead index?
- What does the TTF option smile look like today, and how did it look on Friday?
- Can I keep these ten curves as a group, or have a group that always holds every spot price?
- Can I be emailed when this curve is updated?
Throughout these pages we follow Northgate Energy, a fictional gas and power trader. Priya Shah looks after its market data: the TTF, NBP and THE gas curves, the German, French and Dutch power curves, the EUA carbon curve, the day ahead indices and the TTF options.
Key ideas
| Idea | What it means |
|---|---|
| Master data | The records that describe what is traded or measured (NGE.GAS.TTF, NGE.POWER.DE), with properties such as commodity and region, and tags |
| Data | What a record holds: curves (one curve per ondate), timeseries, options and event lists, each with an id such as NGE.GAS.TTF:FORWARD |
| Private and public | Your own data, and the public data (ids start with #) |
| Search | The platform search: words, tags, field=value conditions |
| Filters | Master data dimensions (commodity, region, product ...), Type and Tag, and data properties (currency, units, calendar) |
| Groups | Named lists of data or master data, static (you pick the members) or dynamic (a rule finds them) |
| Starred | Your own favourites, kept as a group only you can see |
| Chart board | One chart of several curves and timeseries, with what changed since the previous curve |
| Tabs from other extensions | Other extensions add their own tabs and actions, such as Edit, Smart Data, Event Data and Validation |
| Insights | The platform's insight reports for an item (audit, usage, rights, seasonality, the history of a curve's ondates ...), run in place |
What you get
| Screen | What it is for |
|---|---|
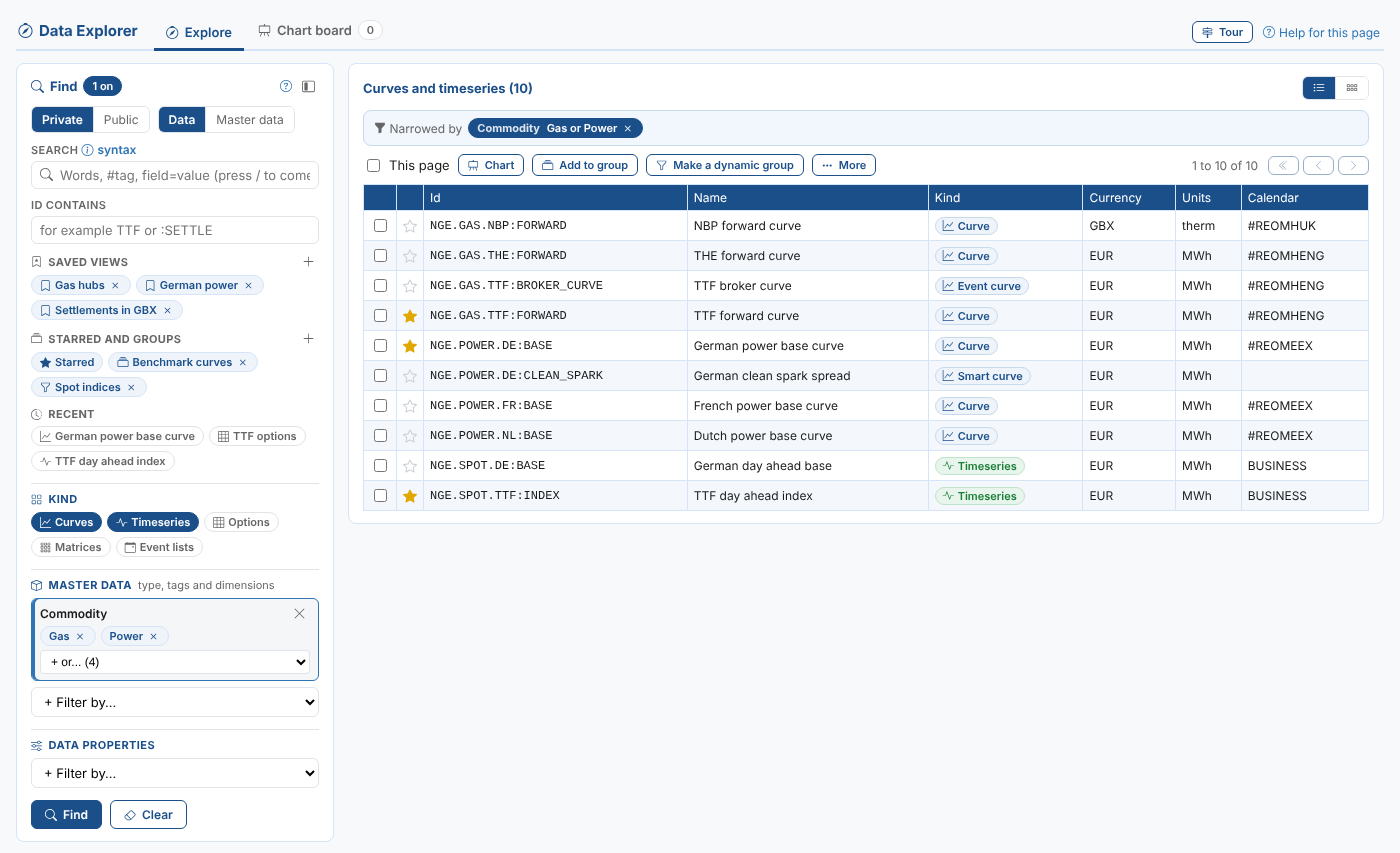
| Explore | Find master data and data, and see the results as a table or as cards |
| An opened item | A curve against its previous curve with what changed, tenor histories, a timeseries chart, an option chain, smiles and surface, a correlation, covariance or statistics matrix and how it changed, what a metric timeseries measures, a record with its data, insight reports, and the tabs other extensions add |
| Chart board | Several series on one chart, with themes and saved boards |
The Data Explorer is in the Information menu. It is also on the Home page as the Find data, Chart and compare curves and Look at option chains and volatility smiles tasks.
Where next
- Finding data: search, filters, saved views, starred items and groups
- Looking at data: curves, tenor histories, timeseries, master data and details
- Options: option chains, smiles and the surface
- The chart board: several curves and timeseries on one chart
- Groups and automations: adding to groups, dynamic groups and automations
- What other extensions add: editing, smart data, event data, validation, and adding your own
- Reference: properties, where things are kept, and troubleshooting