Finding data
The tour
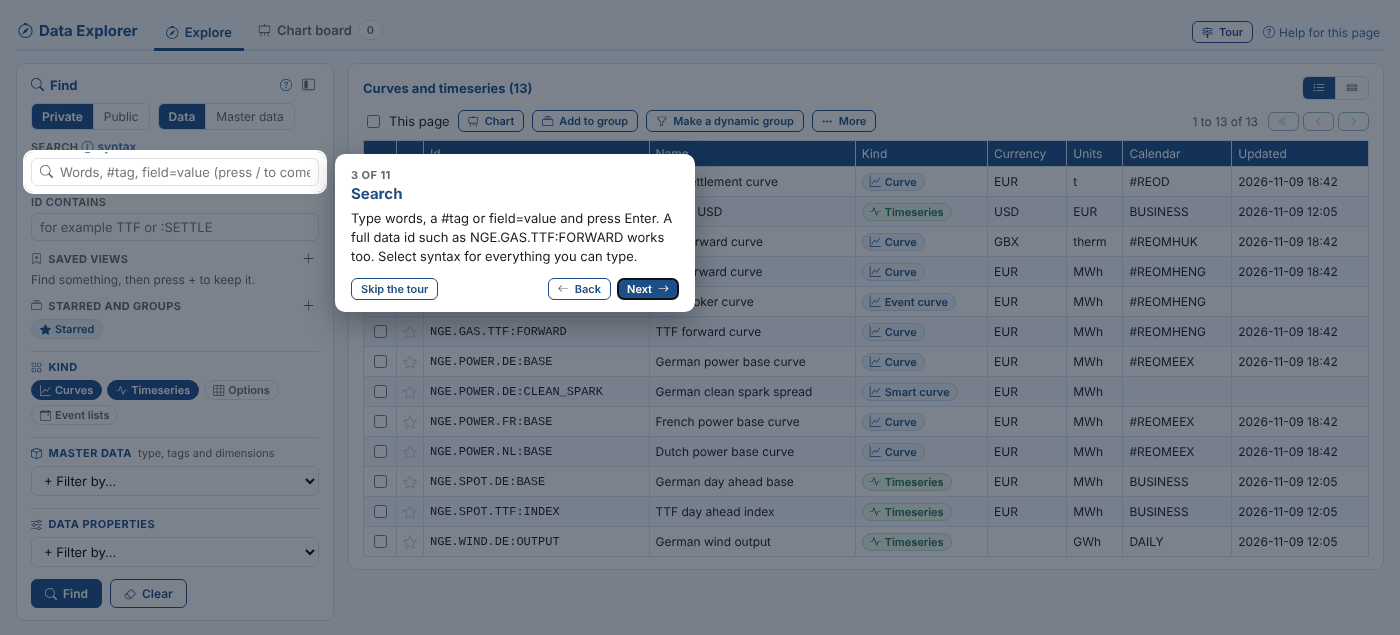
The first time you open the Data Explorer, a short tour shows you around: each step highlights a part of the screen with a note beside it. Use Next and Back (or the arrow keys), Skip the tour or Esc to leave it. It is not shown again once you have finished or skipped it; select Tour at the top right to take it again at any time.
The finder
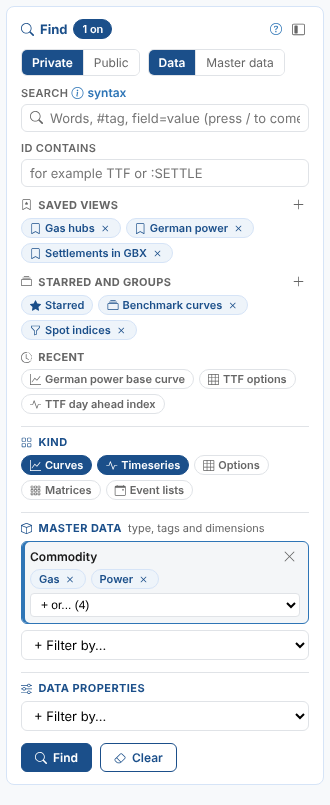
The finder is on the left of the Explore tab. Everything in it narrows the results on the right, which update as you go. The finder remembers what you used last on this browser.
Where to look
| Control | What it does |
|---|---|
| Private / Public | Your own master data and data, or the public data (its ids start with #) |
| Data / Master data | List data items (curves, timeseries, options, event lists) or master data records |
| Kind (Data only) | The kinds of data to list: Curves, Timeseries, Options, Matrices, Event lists. Curves include smart, event and composed curves; timeseries include smart, event and metric timeseries; matrices are correlation, covariance and statistics tables |
Searching
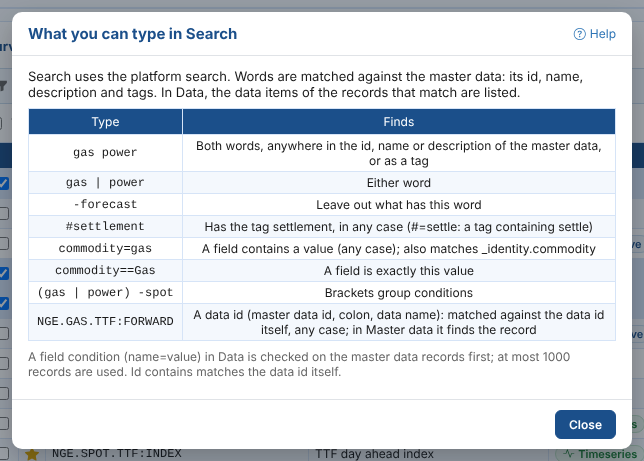
Search uses the platform search. Words are matched against the master data: its id, name, description and tags. In Data, the data items of the records that match are listed. Press Enter to search, or / anywhere on the page to jump to the box. Select syntax for this table on screen.
| Type | Finds |
|---|---|
gas power | Both words, anywhere in the id, name or description of the master data, or as a tag |
gas | power | Either word |
-forecast | Leave out what has this word |
#settlement | Has the tag settlement, in any case (#=settle: a tag containing settle) |
commodity=gas | A field contains a value, in any case; also matches _identity.commodity |
commodity==Gas | A field is exactly this value |
(gas | power) -spot | Brackets group conditions |
NGE.GAS.TTF:FORWARD | A data id (the master data id, a colon, the data name): matched against the data id itself, in any case. In Master data it finds the record |
Id contains is different: it matches the data id (or, in Master data, the record id) itself, in any case, so :SETTLE finds every settlement curve and TTF every id with TTF in it.
In Data, a search with a field condition (region=DE) is checked on the master data records first, then their data is listed. At most 1000 records are used; if the search matches more, a note says so. Add a filter to narrow it.
Filters
Master data
Choose + Filter by... under Master data to filter by Type, Tag or a dimension of the master data types (for Northgate: commodity, region, product and provider). Then choose its values: several values of one filter are any of them (Gas or Power), different filters must all match (Gas and DE). Each list only offers the values left by the filters above it, and the dimensions offered are those of the types that still match. Select a value's cross to remove it, or the cross of the filter to remove it all.
Data properties
In Data, + Filter by... under Data properties filters on the data items themselves: Data name (the part of the id after the master data id, such as SETTLE in ICE.NDEX.NLB:SETTLE), Currency, Units, Calendar, Expiry calendar and Timezone. For example Data name SETTLE finds every settlement curve, and Currency GBX the NBP curve.
Seeing what narrows the results
Everything that narrows the results stands out, so a forgotten condition never hides data:
- Search and Id contains are outlined and shaded blue while they have something in them.
- A master data filter or data property with values chosen is outlined, and Kind says narrowed when it is not the usual curves and timeseries.
- The Find heading counts the conditions, for example 2 on.
- Above the results, Narrowed by shows each condition as a chip. Select a chip to remove that condition, or Clear all to remove them all.
The chips show what the results were found with: a search typed but not yet run (press Enter) is outlined in the finder but not yet a chip.
Saved views
A view keeps everything in the finder: source, kinds, search, id text and filters. Select + beside Saved views, give it a name such as Gas hubs, and it is one click away from then on, on any computer you sign in to. Select a view's cross to remove it.
Starred items
Select the star beside a result, or beside the name of an opened item, to star it. Starred on the shelf lists your starred data (in Data) or master data (in Master data). Starred items are kept as your own favourites group (type favourite, category Data Explorer), which only you can see, so you can also use it anywhere a group is used.
Groups
Select + beside Starred and groups to see the groups of data and master data you can see: your own and the shared ones. Filter them by name or category, select one to list its members, or Pin it to keep it on the shelf. Dynamic groups list whatever their rule finds now. While a group is listed the filters are not used; Back to the filters returns to them.
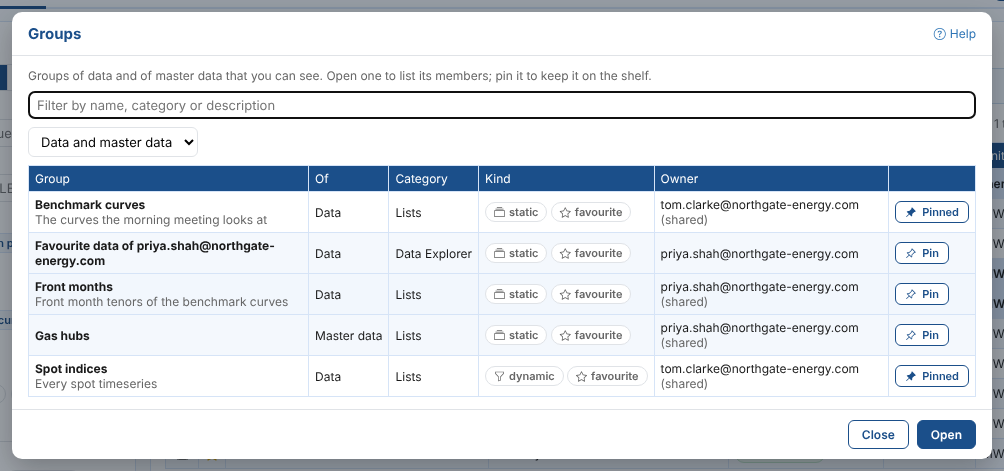
A data group can also hold a tenor of a curve, written as the curve's id, a colon and the tenor: ICE.NDEX.NLB:SETTLE:M01 is the front month of the ICE Endex TTF settlement curve. It is listed as a Tenor, with the curve's name and the tenor, currency and units, and opens as a timeseries: the tenor's value on each ondate. More > Open the curve opens the curve it comes from.
Curve build, quality, approval and export groups and policy user groups are not listed here: use Group Manager for those.
Recent
The last items you opened are under Recent, newest first. Select one to open it again.
The results
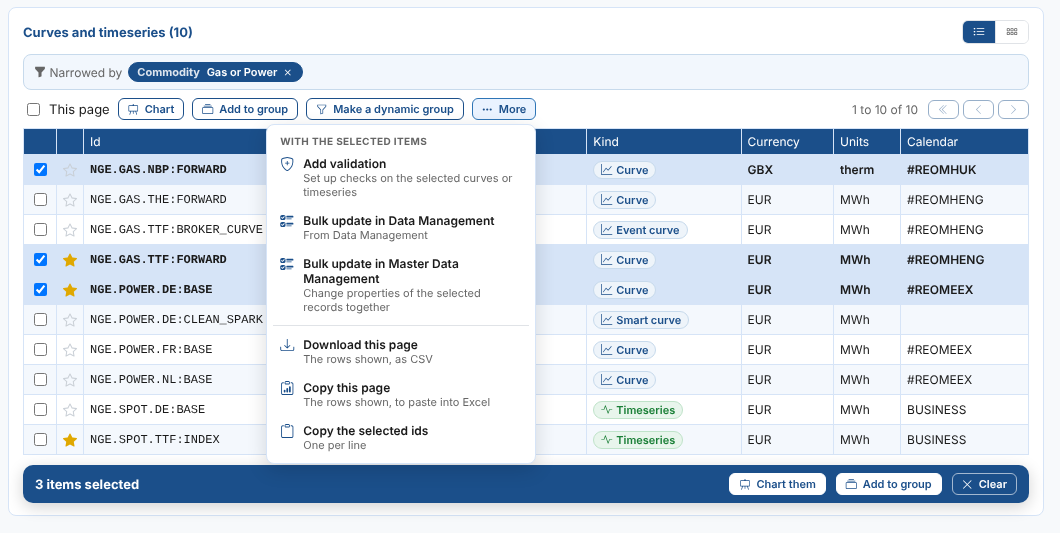
The results show 50 at a time, with the pager at the top. Table shows the id, name, kind, currency, units and calendar (for master data: type and tags; select a tag to find everything with it). Cards show each item as a card with a small sketch of its latest values: the latest curve from the first tenor to the last, or the last 30 values of a timeseries, green when it ended higher than it started and red when lower.
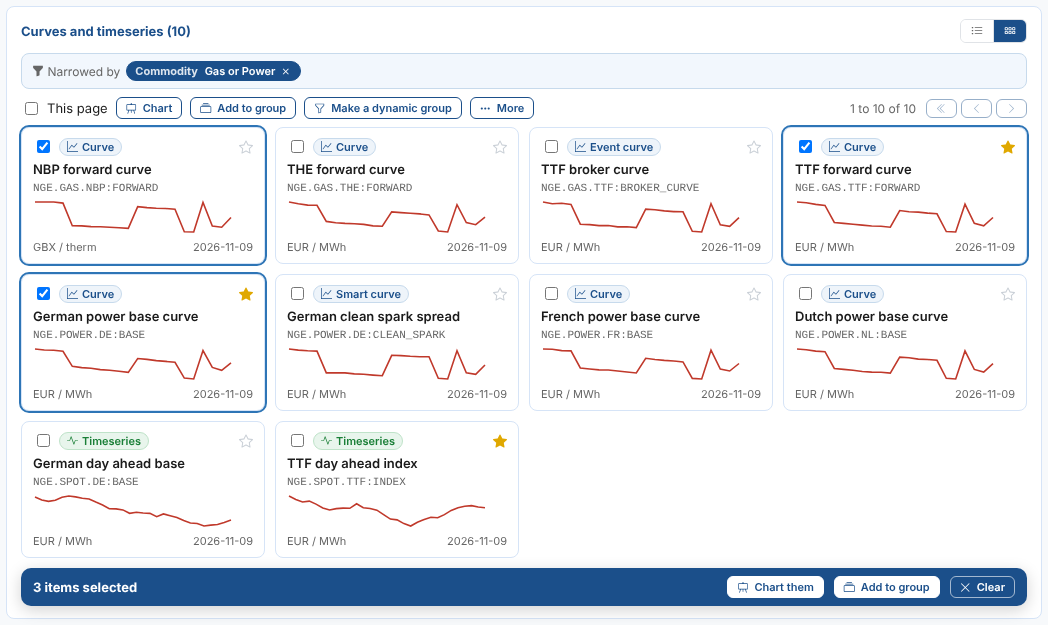
Select a row or card to open it (see Looking at data). Tick items to select them: ticks are kept when you change page or search, so you can gather items from several searches. This page ticks every item on the page. With items selected, a bar at the bottom offers Chart them, Add to group and Clear.
| Button | What it does |
|---|---|
| Chart | Puts the selected curves and timeseries on the chart board |
| Add to group | Adds the selected items to a group, or makes a new group of them (see Groups and automations) |
| Make a dynamic group | Makes a group from the filters, so it always holds what they find (see Dynamic groups) |
| More | What other extensions do with a selection (bulk updates, adding validation), Download this page as CSV, Copy this page to paste into Excel, and Copy the selected ids |