Looking at data
Select a result to open it in place. The header shows its name, kind, id, source and its main facts (currency and units, calendar, timezone, the event list it is built from). Results goes back to the list as you left it.
| Button | What it does |
|---|---|
| The star | Stars it or unstars it (see Starred items) |
| Add to the board | Puts a curve or timeseries on the chart board |
| Add to group | Adds it to a group or a new group |
| Add an automation | Something the platform does when it changes (see Automations) |
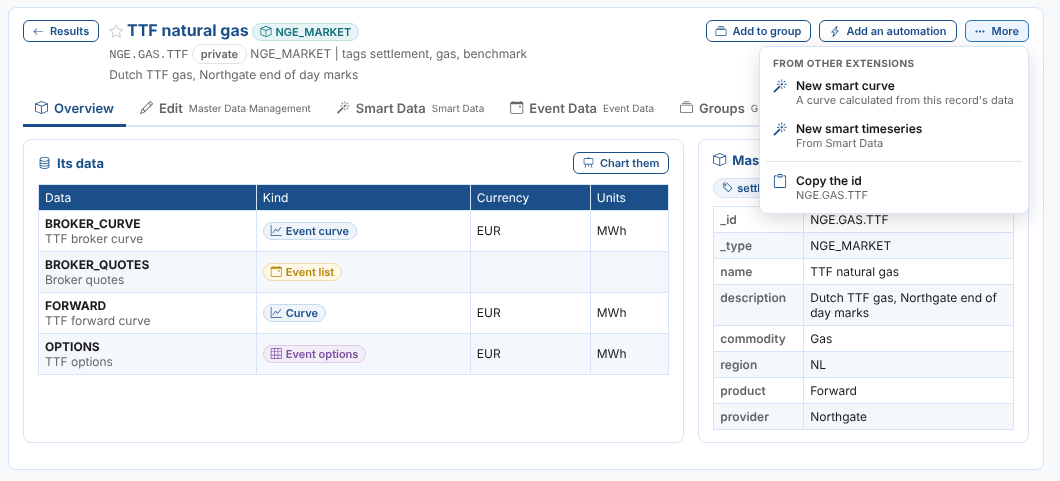
| More | What other extensions do with it, Open its master data and Copy the id |
The tabs depend on what it is: the Data Explorer's own tabs come first, then the tabs other extensions add (their extension is named beside the tab), then Insights and Details. See What other extensions add.
Curves
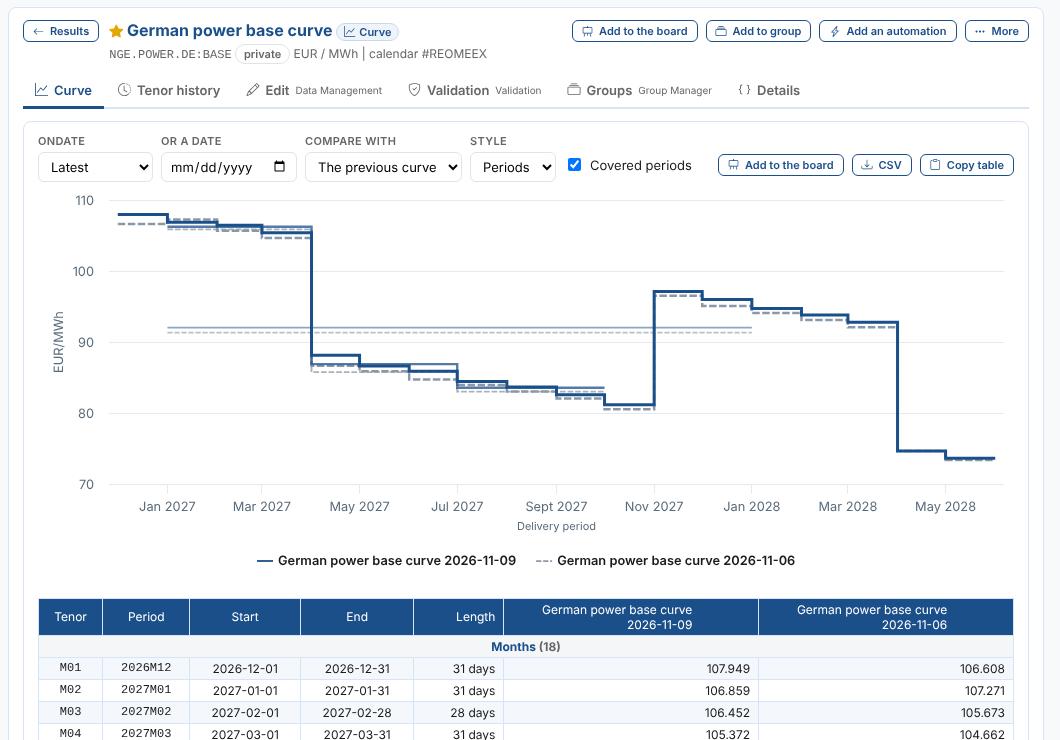
A curve opens on the Curve tab with its latest curve compared with the previous one. Priya opens NGE.POWER.DE:BASE, the German power base curve:
| Control | What it does |
|---|---|
| Ondate | Latest, or one of the last 90 ondates |
| Or a date | Any date: the curve on that date, or the last one before it |
| Compare with | Nothing, The previous curve (the last curve before this one, so Friday for a Monday), or another ondate |
| Line up by | When comparing: Delivery period (the same month with the same month) or Tenor (M01 with M01, even when it was a different month on the other ondate) |
| Style | How each curve is drawn: Periods (a flat line over each delivery period), Line, Column, Area or Points |
| Covered periods | Untick to hide quarters and years whose months are all shown |
| CSV | The grid below the chart as a CSV file |
| Copy table | The grid, to paste into Excel: each value lands in its own cell |
Contracts are drawn over their delivery periods, so months, quarters and years line up on one date axis: the shorter periods are on top and the longer ones thinner and lighter behind them. Periods of a week or less get a marker. Intraday and gas periods are shown in the curve's timezone. The grid lists every contract by period type, with its start, end and length, and a column per curve. Values implied from another tenor (for example months shaped from a quarter) are in italics.
What changed
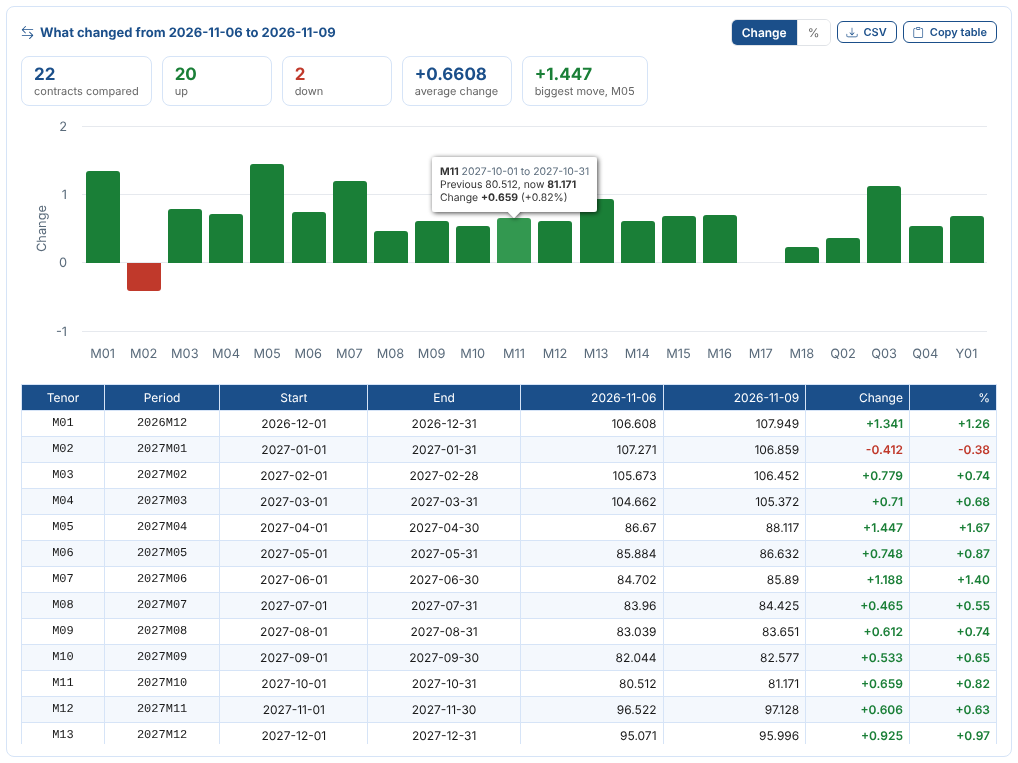
When the curve is compared with another, What changed below it shows how many contracts were compared, how many went up and down, the average change and the biggest move, a chart of the change of each contract (Change or %), and a table with both values, the change and the change in percent. Contracts that are new or gone are marked. CSV downloads the table and Copy table copies it, to paste into Excel.
Lining up by tenor
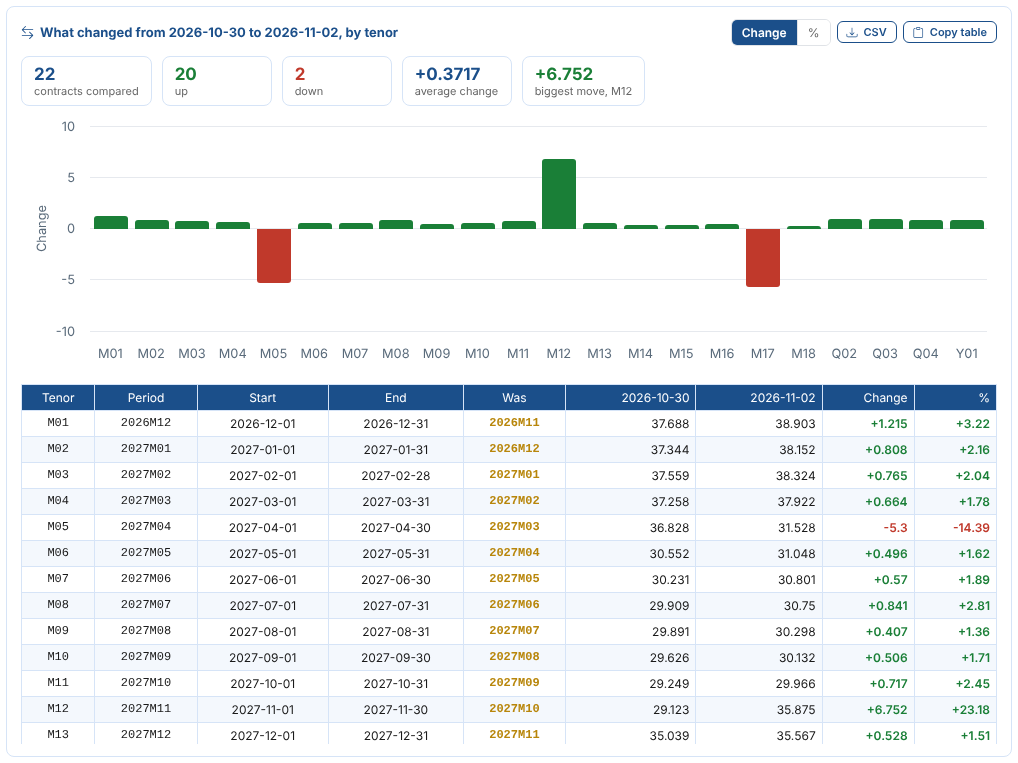
By default the two curves line up by delivery period: December is compared with December, whatever tenor it had on each ondate. Choose Line up by Tenor to compare each tenor with the same tenor instead, for example to see how the front month moved over a month end, when M01 rolls from November to December. The earlier curve is then drawn over the delivery periods of the curve shown (its M01 over this M01), and the grid and What changed have a row per tenor. What changed adds a Was column with the period the tenor had on the earlier ondate, highlighted where it differs. Intraday tenors are matched without their timezone offset, so QH01[+02] lines up with QH01[+01] across a clock change. Tenors the earlier curve has that this one does not are in the tables but not the chart. The choice is kept as you change ondates, and CSV and Copy table follow it.
To watch a curve change every day, put it on the chart board Against the previous curve: the board shows its changes too, next to other curves.
Curve series
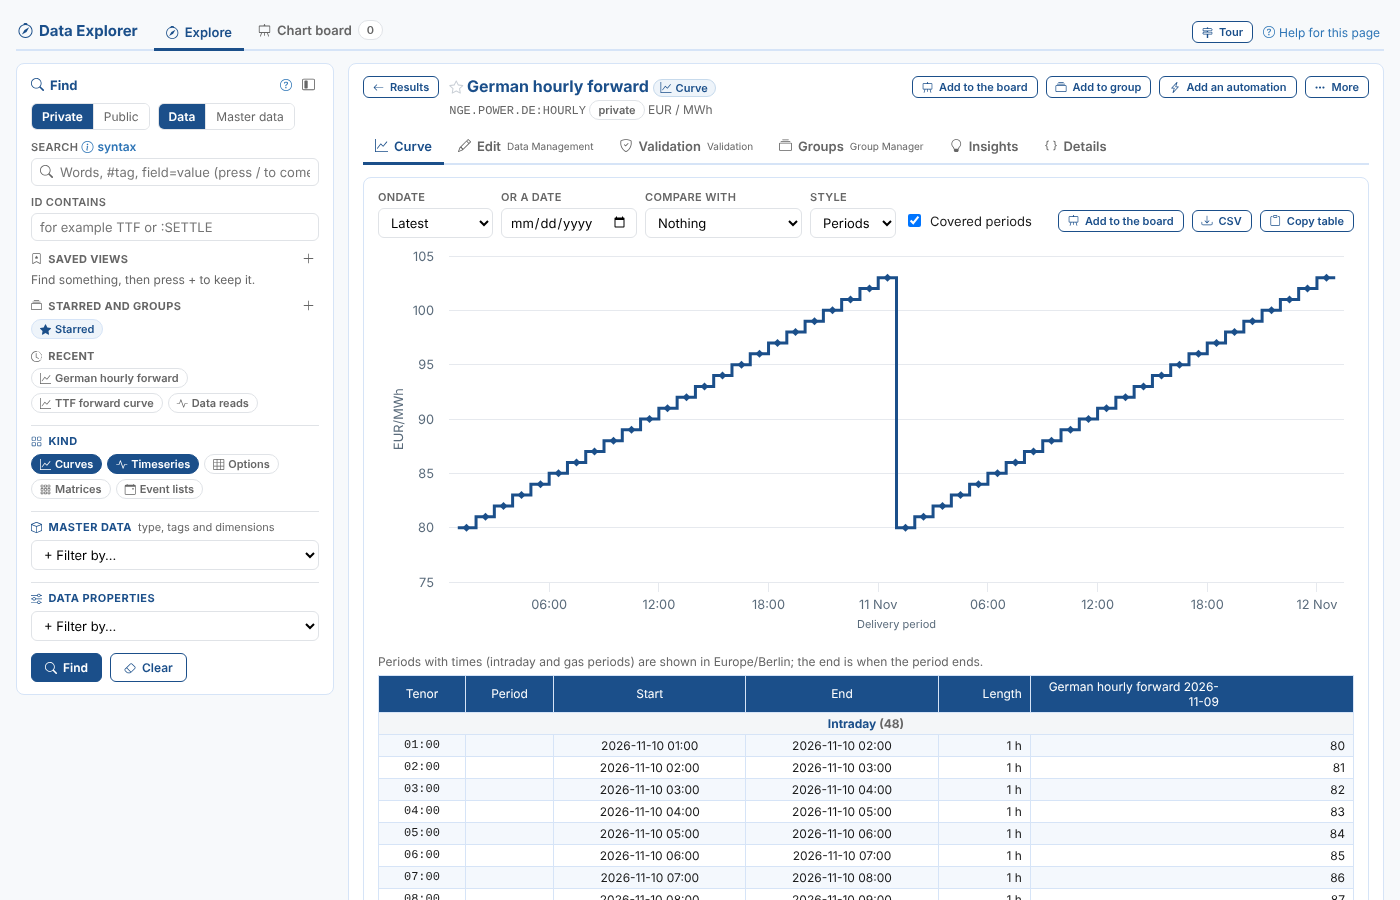
A curve series is a curve whose ondates each hold values at delivery times (hourly, half hourly or daily) instead of tenors. Each one can be large, so it opens with Compare with set to Nothing: only the curve itself is read. Choose The previous curve or an ondate to compare it. A curve series has no Tenor history tab, because it has no tenors.
Tenor history
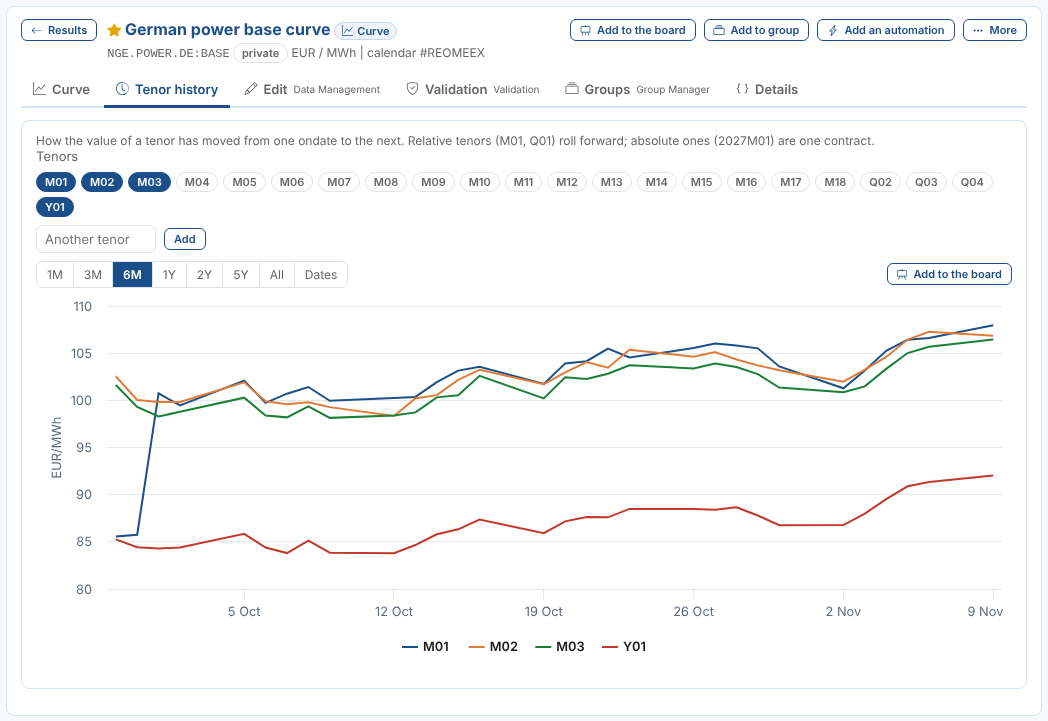
Tenor history shows how the value of tenors moved from one ondate to the next. The first three tenors of the latest curve are chosen; select tenors to add or remove them, or type another (for example 2027M01) and select Add. Relative tenors such as M01 and Q01 roll forward with the ondate; absolute ones such as 2027M01 are one contract. Choose the range above the chart. Add to the board puts the chosen tenors on the chart board.
Timeseries
A timeseries opens on Chart, with its values over the last year and the table below. Choose 1M to 5Y, All, or Dates for a range of your own, and how it is drawn: Line, Column, Area, Steps or Points. CSV downloads the values and Copy table copies them, to paste into Excel.
A tenor of a curve kept in a group (see Groups) opens here too, with its value on each ondate. Its header says which curve it comes from.
Metric timeseries
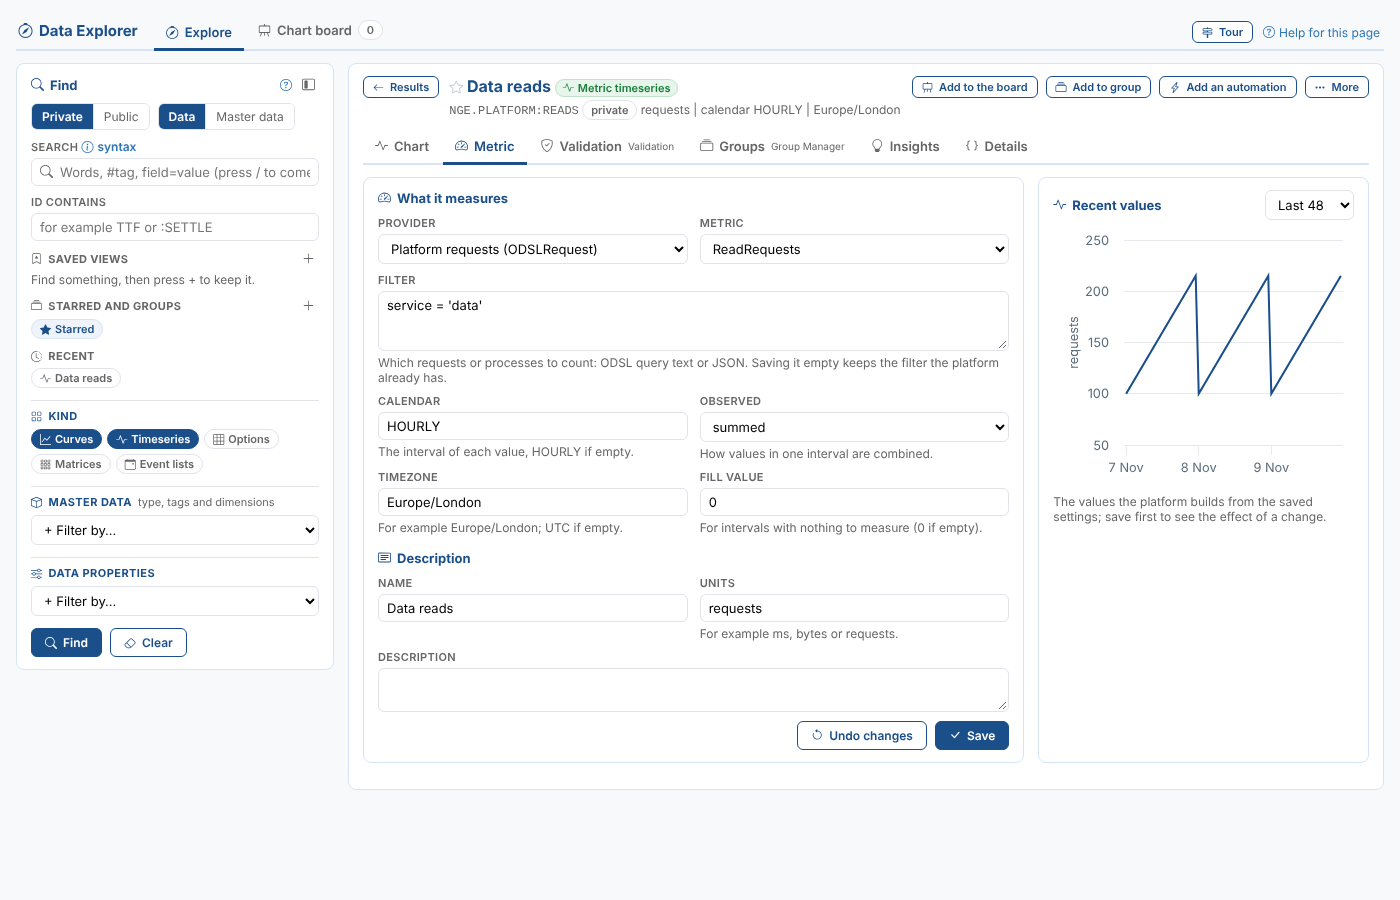
A metric timeseries is built by the platform from what it measures, for example how many data requests your team made each hour. Besides Chart, it has a Metric tab to see and change what it measures. Priya keeps NGE.PLATFORM:READS, the data reads of the Northgate team:
| Field | What it is |
|---|---|
| Provider | Where the measurements come from: Platform requests (ODSLRequest), Processes (ODSLProcess), or Azure Service Bus, Azure Batch or the Azure web server farm |
| Metric | What is measured. The list is read from the provider: for platform requests ReadRequests, ReadRequestDuration, ReadRequestResponseSize, WriteRequests and DeleteRequests; for processes RunRequests, RunRequestDuration and PhaseDuration |
| Phase | For PhaseDuration: the name of the process phase to time |
| Filter | Which requests or processes to count, as ODSL query text or JSON |
| Calendar | The interval of each value, HOURLY if empty |
| Observed | How the measurements in one interval are combined: summed, averaged, beginning, end, high or low |
| Timezone, Fill value | The timezone of the intervals, and the value for an interval with nothing to measure (0 if empty) |
| Name, Units, Description | How it is described |
Save keeps the changes on its master data record; the platform checks that the metric belongs to the provider. Undo changes shows it as it was saved. Recent values charts the last 24, 48 or 168 values the platform builds from the saved settings, so save first to see the effect of a change.
Saving a field empty leaves the value the platform already has, so a filter cannot be removed by clearing it here. Use the Details tab to see what is stored.
A metric timeseries has no Edit tab from Data Management: the Metric tab replaces it. Public metric timeseries, and those you cannot update, are shown but cannot be changed.
Matrices
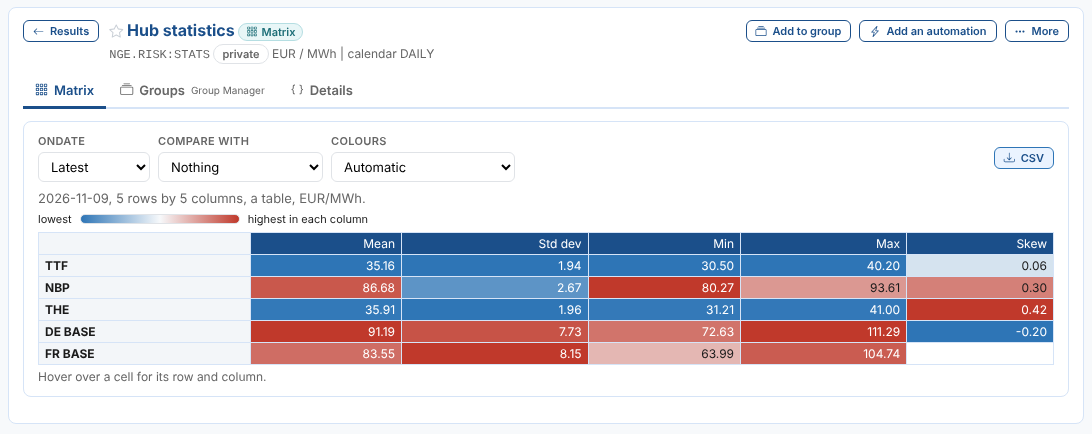
A matrix (a VarMatrix) is a table of numbers with labels down the side and across the top, kept for each ondate as a curve is. It is usually a correlation or covariance matrix, but it can be any table of statistics. A matrix opens on the Matrix tab with its latest ondate.
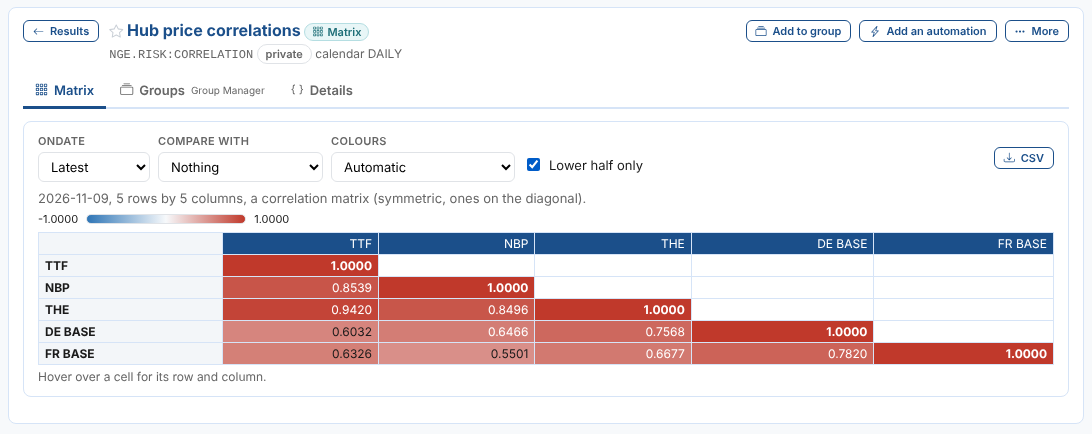
The line above the table says how big it is and what it looks like: a correlation matrix when it is symmetric with ones on the diagonal, a covariance matrix when it is symmetric with variances on the diagonal, otherwise a table. Hover over a cell for its row and column. A value the matrix does not have (stored as NaN) is left empty. When the matrix has a precision, its values are shown to that many decimal places.
| Choice | What it does |
|---|---|
| Ondate | The matrix of another ondate; Latest is the newest |
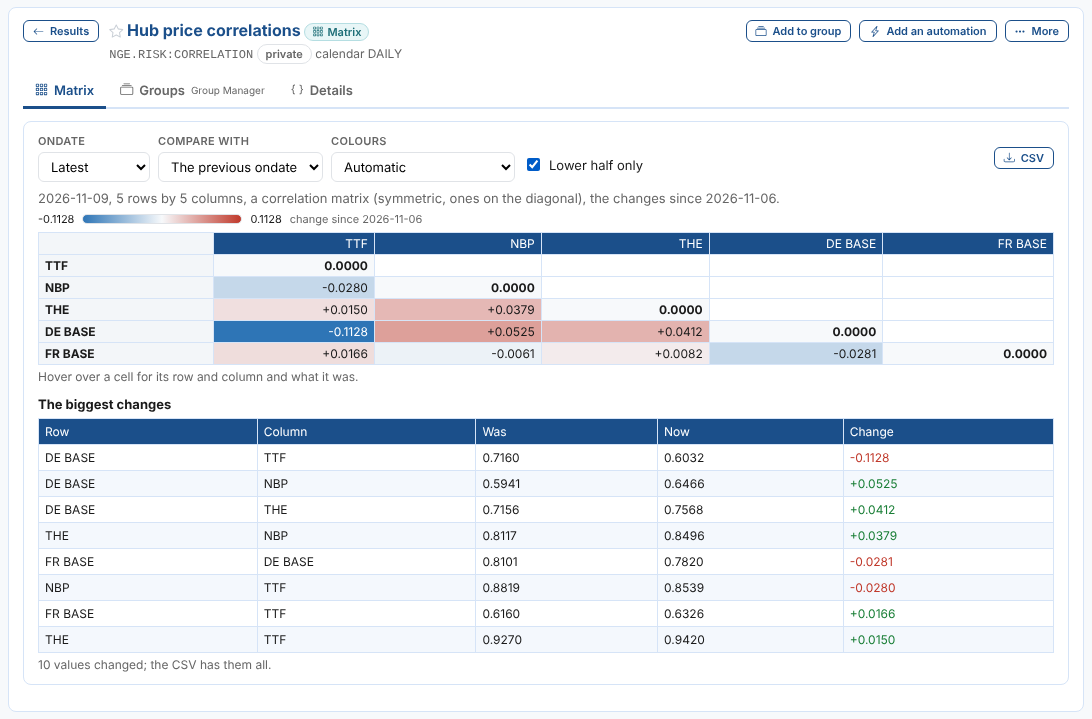
| Compare with | The previous ondate or any other: the table shows the change in each value, and The biggest changes lists the largest moves with what they were and are now |
| Show | For a covariance matrix: As correlations divides each covariance by the two standard deviations |
| Colours | How the cells are coloured. Automatic colours a correlation matrix from -1 to 1, changes centred on nought, a statistics table each column on its own, and anything else from its lowest to its highest value; No colours turns it off |
| Lower half only | For a symmetric matrix: hides the half above the diagonal, which repeats the half below |
| CSV | Downloads what is shown, with the labels: the values, or the changes when comparing |
| Copy table | Copies the same, to paste into Excel |
Priya opens NGE.RISK:CORRELATION, the correlations of the hub prices, with the lower half only:
She compares it with the previous ondate. The correlation of German power with TTF fell the most:
A statistics table is not square: here each hub has a row and each statistic a column, so each column is coloured on its own. FR BASE has no skew:
Master data
A master data record opens on Overview: its data on the left (select one to open it, or Chart them to put its curves and timeseries on the chart board) and its properties and tags on the right. Select a tag to find everything with that tag.
Definitions
Curve series, matrices, event curves, event timeseries and event options have a Definition tab to change how they are defined. Save keeps the changes on the item's master data record; Undo changes shows it as it was saved. Public items, and those you cannot update, are shown but cannot be changed.
Curve series and matrices
Their values are saved by the processes that load or build them, so the definition only describes them.
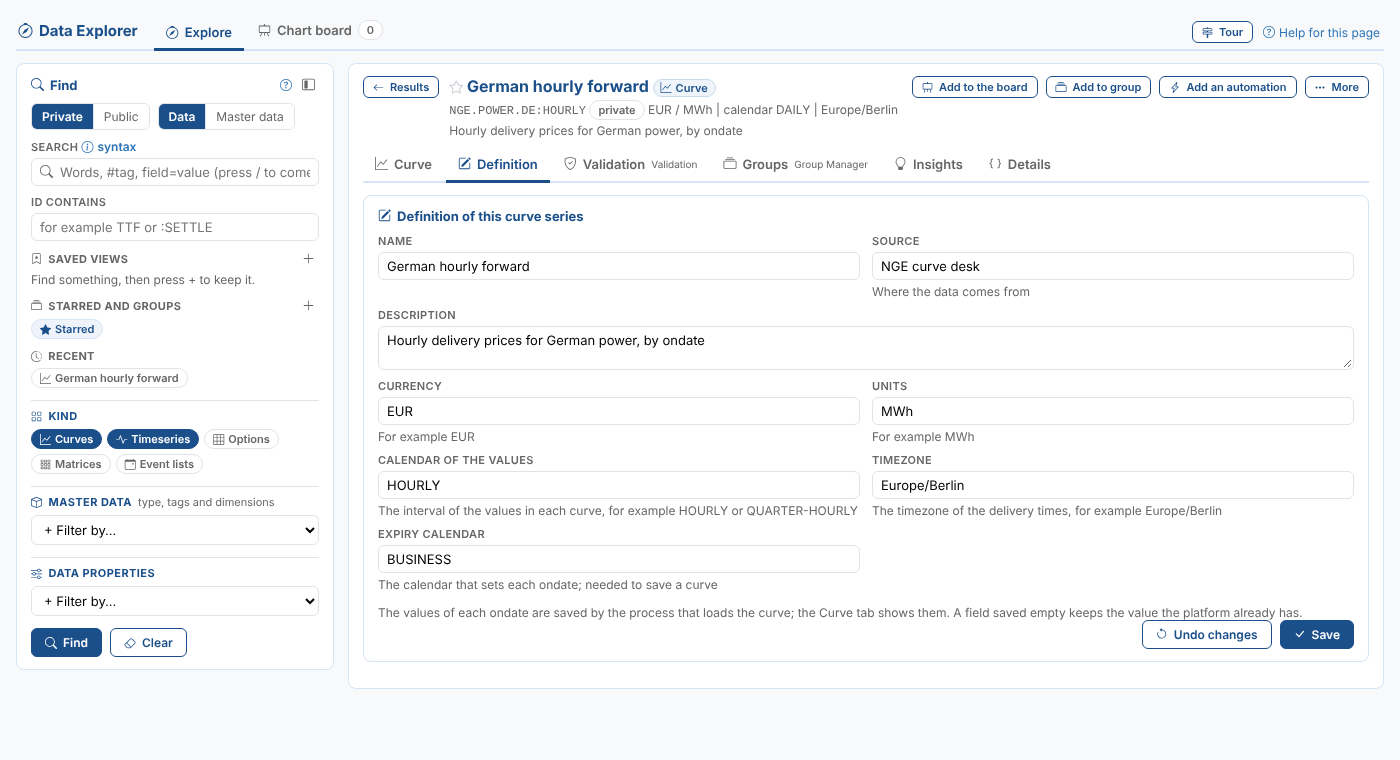
| Field | Curve series | Matrix |
|---|---|---|
| Name, Source, Description | Yes | Yes |
| Currency, Units, Timezone | Yes | Yes |
| Calendar of the values | The interval of the values in each curve, for example HOURLY | |
| Expiry calendar | The calendar that sets each ondate, needed to save a curve |
A field saved empty keeps the value the platform already has, so it cannot be removed here.
Event curves, timeseries and options
Their values are built from the events of an event list, so the definition says which events and how. The fields are grouped: Events (the event list and where it is, the event properties to read and a filter), then Curve, Timeseries or Options, and for event options Positions (an optional event list of the options held, so that only those are returned).
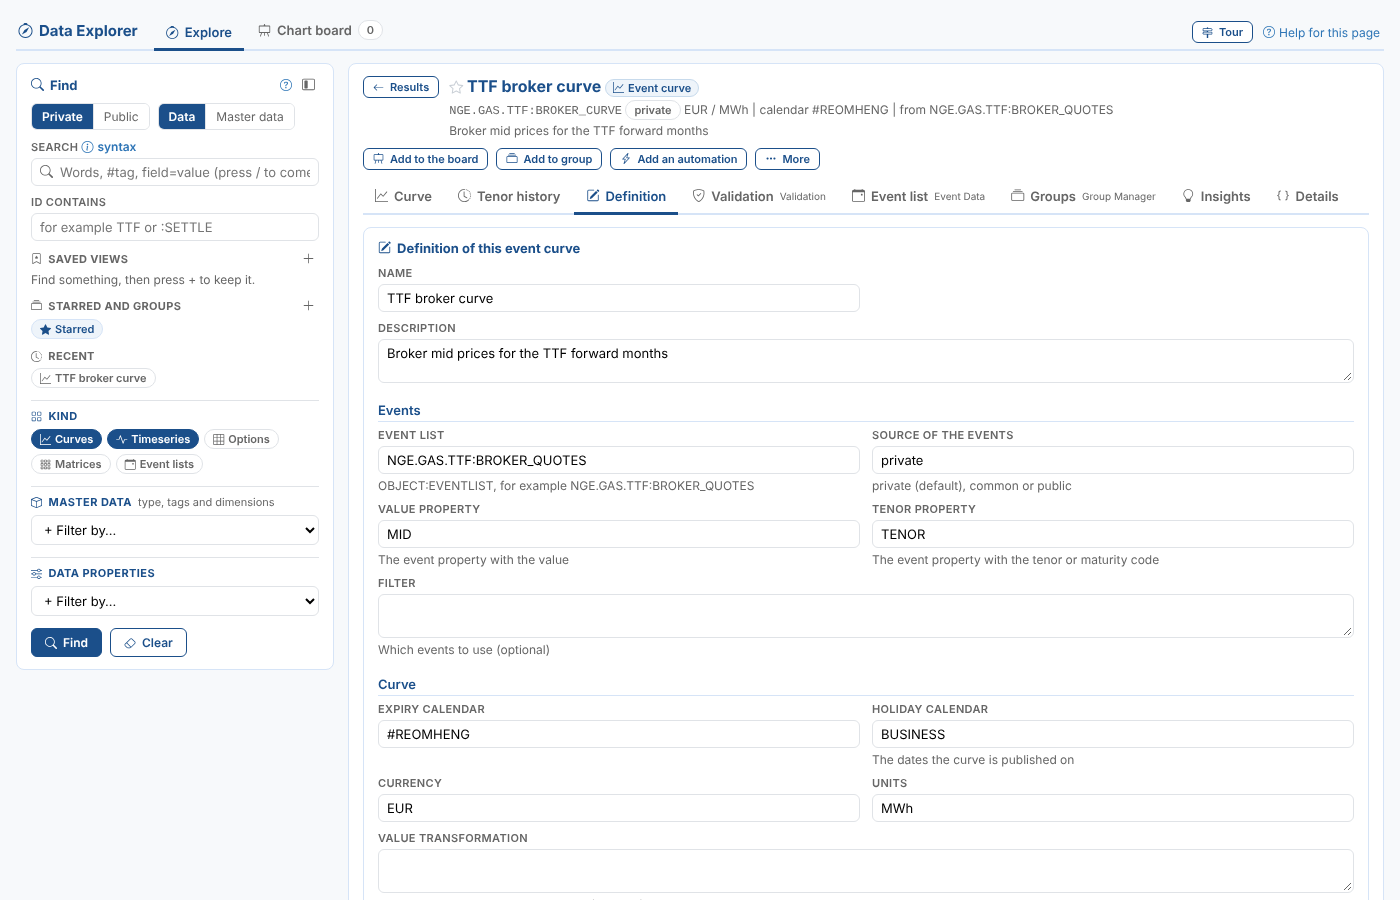
| Field | Event curve | Event timeseries | Event options |
|---|---|---|---|
| Event list, Source of the events, Filter | Yes | Yes | Yes (the filter as JSON) |
| Event properties | Value property, Tenor property | Value property, Date field (start if empty) | Tenor, Strike, Call or put property, Call value, Put value, Main value property, Columns (separated by commas) |
| Calendars | Expiry calendar, Holiday calendar | Calendar | Expiry calendar, Holiday calendar |
| Other | Currency, Units, Value transformation, Include | Timezone, Currency, Units | Timezone, Currency, Units, and the Positions fields |
An event curve or event options saved with a field empty loses it, so its default applies (shown under each field). An event timeseries keeps the value it had, as curve series and matrices do. A filter stored as JSON must be saved as valid JSON. The Event list tab of the Event Data extension opens the event list itself.
Which tab changes what:
| Kind of data | Where to change it |
|---|---|
| Stored curve, timeseries | Edit (Data Management): the definition and the values |
| Smart curve, smart timeseries | Smart Data |
| Event curve, event timeseries, event options | Definition; the events in Event list (Event Data) |
| Event list | Events (Event Data) |
| Metric timeseries | Metric |
| Composed curve, composed timeseries | Composer |
| Curve series, matrix | Definition |
Insights
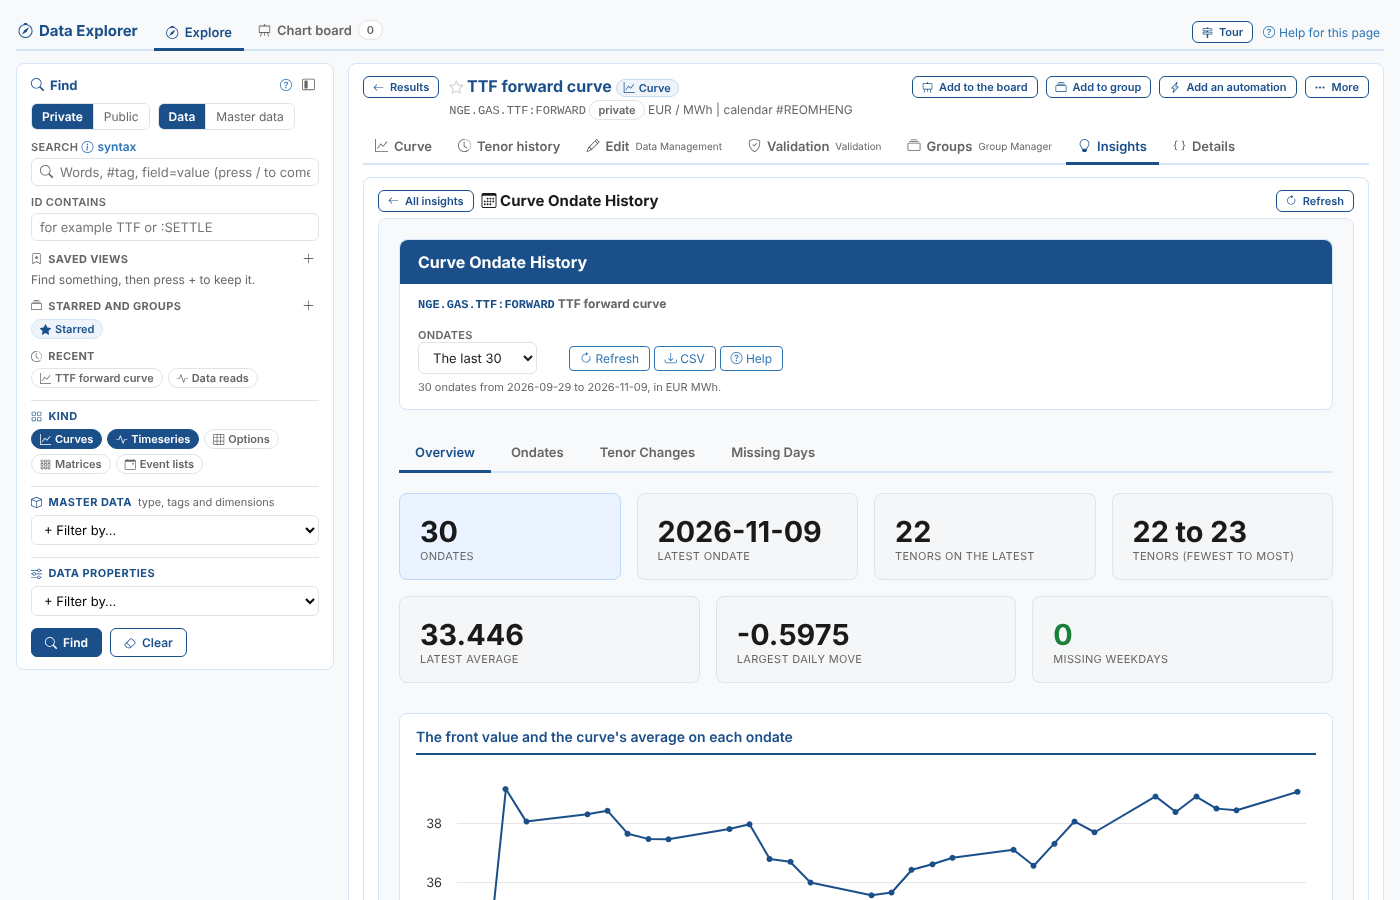
Insights lists the platform's insight reports for the item, as cards: the reports for its kind of data first, then the reports for any item. Select a card to run the report here, with the item filled in; All insights goes back to the cards and Refresh runs the report again. The report stays open while you look at the item's other tabs.
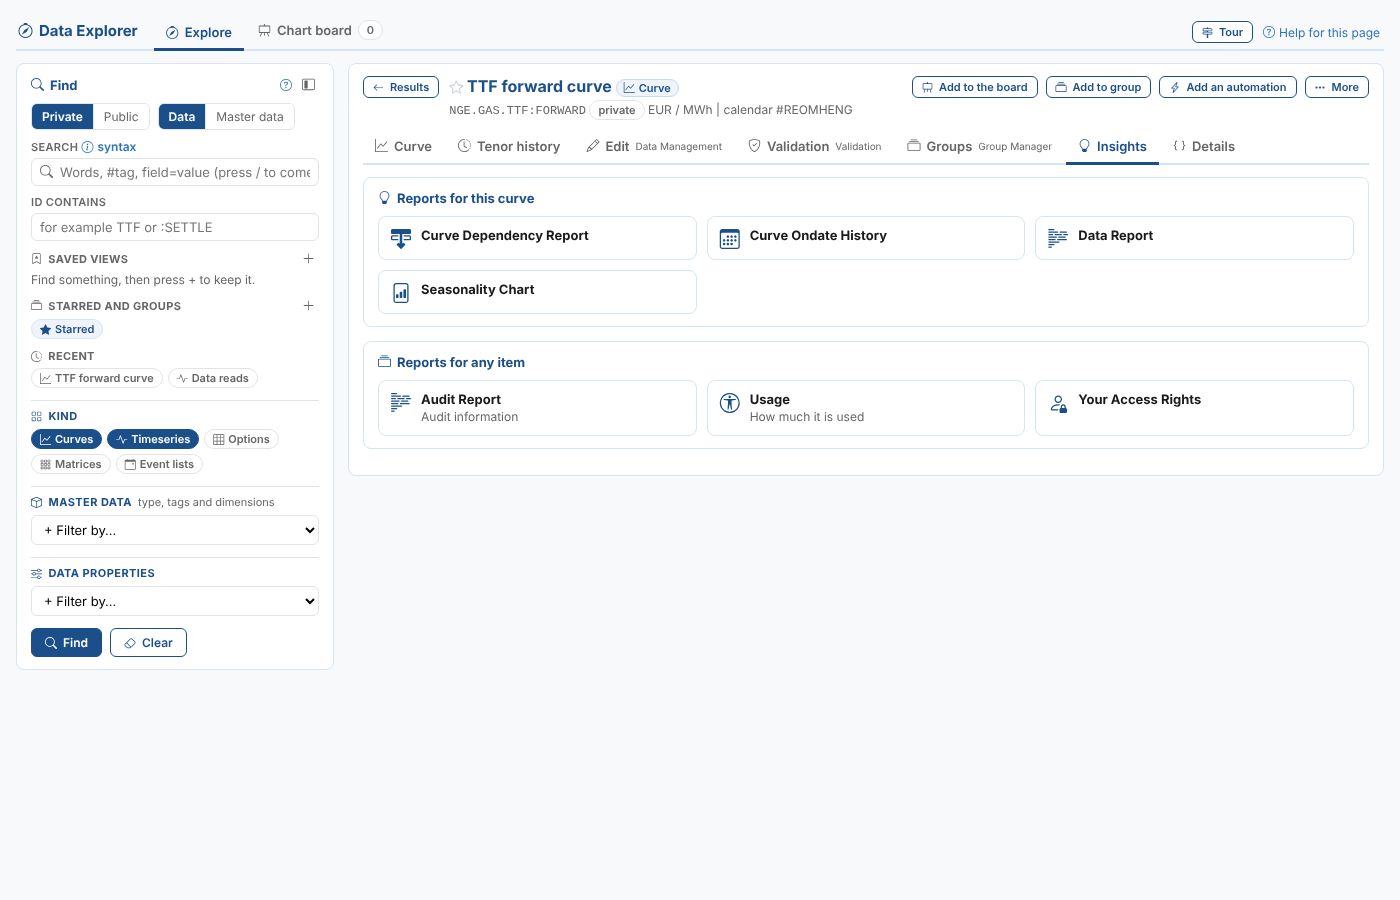
| Reports | For |
|---|---|
| Audit Report, Usage, Your Access Rights, Relationships, Tracer, Automations, Automation Logs | Any data item: who changed it and when, how much it is used, your rights on it, what it is linked to, and its automations |
| Data Report | Any data item |
| Curve Ondate History | Curves (including curve series): each ondate's tenors, front value and average, the tenors that came and went, and missing weekdays |
| Curve Dependency Report | Curves and smart timeseries: what it is built from |
| Seasonality Chart | Timeseries and curves with tenors (not metric or composed timeseries, nor curve series) |
| Timeseries Profile | Timeseries: the spread of the values, averages by month, the largest moves and the gaps |
| Event Analysis | Event lists |
The reports are those of the portal's data screens (the Item Insights and Data Insights categories), so the reports your team adds there show here too.
Details
Details lists the item's properties and shows it as it is stored, as JSON, with Copy.