Event curves
An event curve turns each day's events into a forward curve: for every tenor in the day's events, the value of the latest event for that tenor becomes the contract's price. Nothing is stored but the definition; the platform builds the curve when it is read, so it always reflects the events.
Northgate's brokers send two end of day quotes for every German power contract. Priya wants a curve of the latest mid for each contract, NGE.POWER.DE:BROKER_CURVE, to compare with the exchange settlement.
Creating an event curve
Open the list NGE.POWER.DE:BROKER_QUOTES and select the Event curves tab. It lists the event curves already built from this list. Select New.
| Field | Example | Notes |
|---|---|---|
| Keep it on the master data record | NGE.POWER.DE | A private record. For a private list it is the list's own record; for a common or public list, select Choose... to pick one. |
| Name (key on the record) | BROKER_CURVE | Letters, digits, _, . or -. The curve's id is the record and the name: NGE.POWER.DE:BROKER_CURVE. |
| Display name and Description | German power broker curve | Shown in lists and on the portal. |
| Value field | mid | The number field that becomes each contract's price. |
| Tenor field | absolute | The field holding each event's contract: an absolute code such as 2026M12, or a relative one such as M01. |
| Expiry calendar | #REOMHENG | The expiry calendar of the product, which places each tenor on its delivery period. Required. |
| Holiday calendar | Optional: the days the curve is published on. | |
| Value transformation | value / 100 | Optional: an ODSL expression applied to each value, where value is the event's value. |
| Timezone | UTC | The timezone of the curve's ondates: which events count as one day's. |
| Currency and Units | EUR, MWh | |
| Only events where | {"broker": "BRK1"} | Optional: a JSON filter on the events, for example to build a curve from one broker's quotes. |
The ODSL card below the form shows the same definition written in ODSL, to copy into a script.
Previewing from the events
Select Preview from the events before saving to see what the curve would look like. Choose an Ondate from the days that have events (with the number of events for each). The preview reads that day's events, keeps the latest event for each tenor, applies the filter and simple value transformations, and shows the curve as a chart and a table.
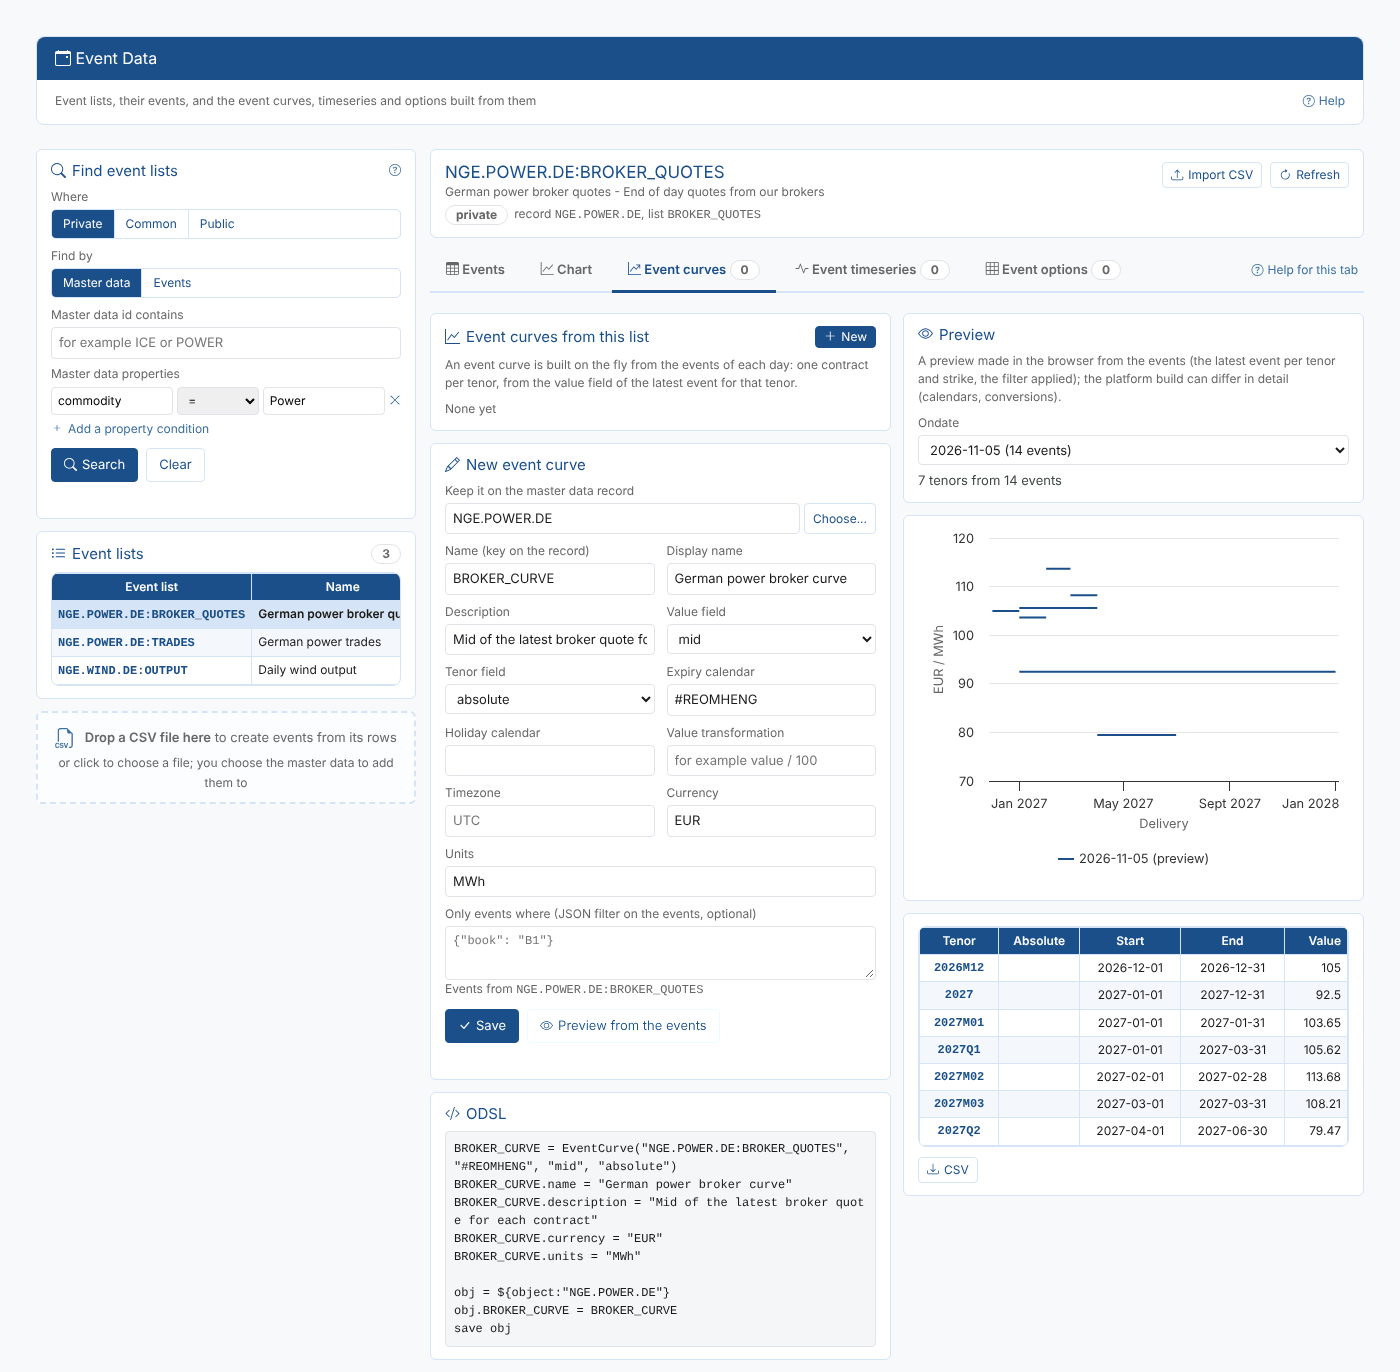
The chart draws each contract as a flat line over its delivery period, so a quarter or a year sits behind the months it covers.
The preview is worked out in the browser. The platform's build can differ in detail: it applies the expiry and holiday calendars and conversions, which the preview does not. Save the curve to see the platform's build.
Saving and viewing the built curve
Select Save. The curve is stored as a property of the record, and the view changes to Built curve: the curve as the platform builds it.
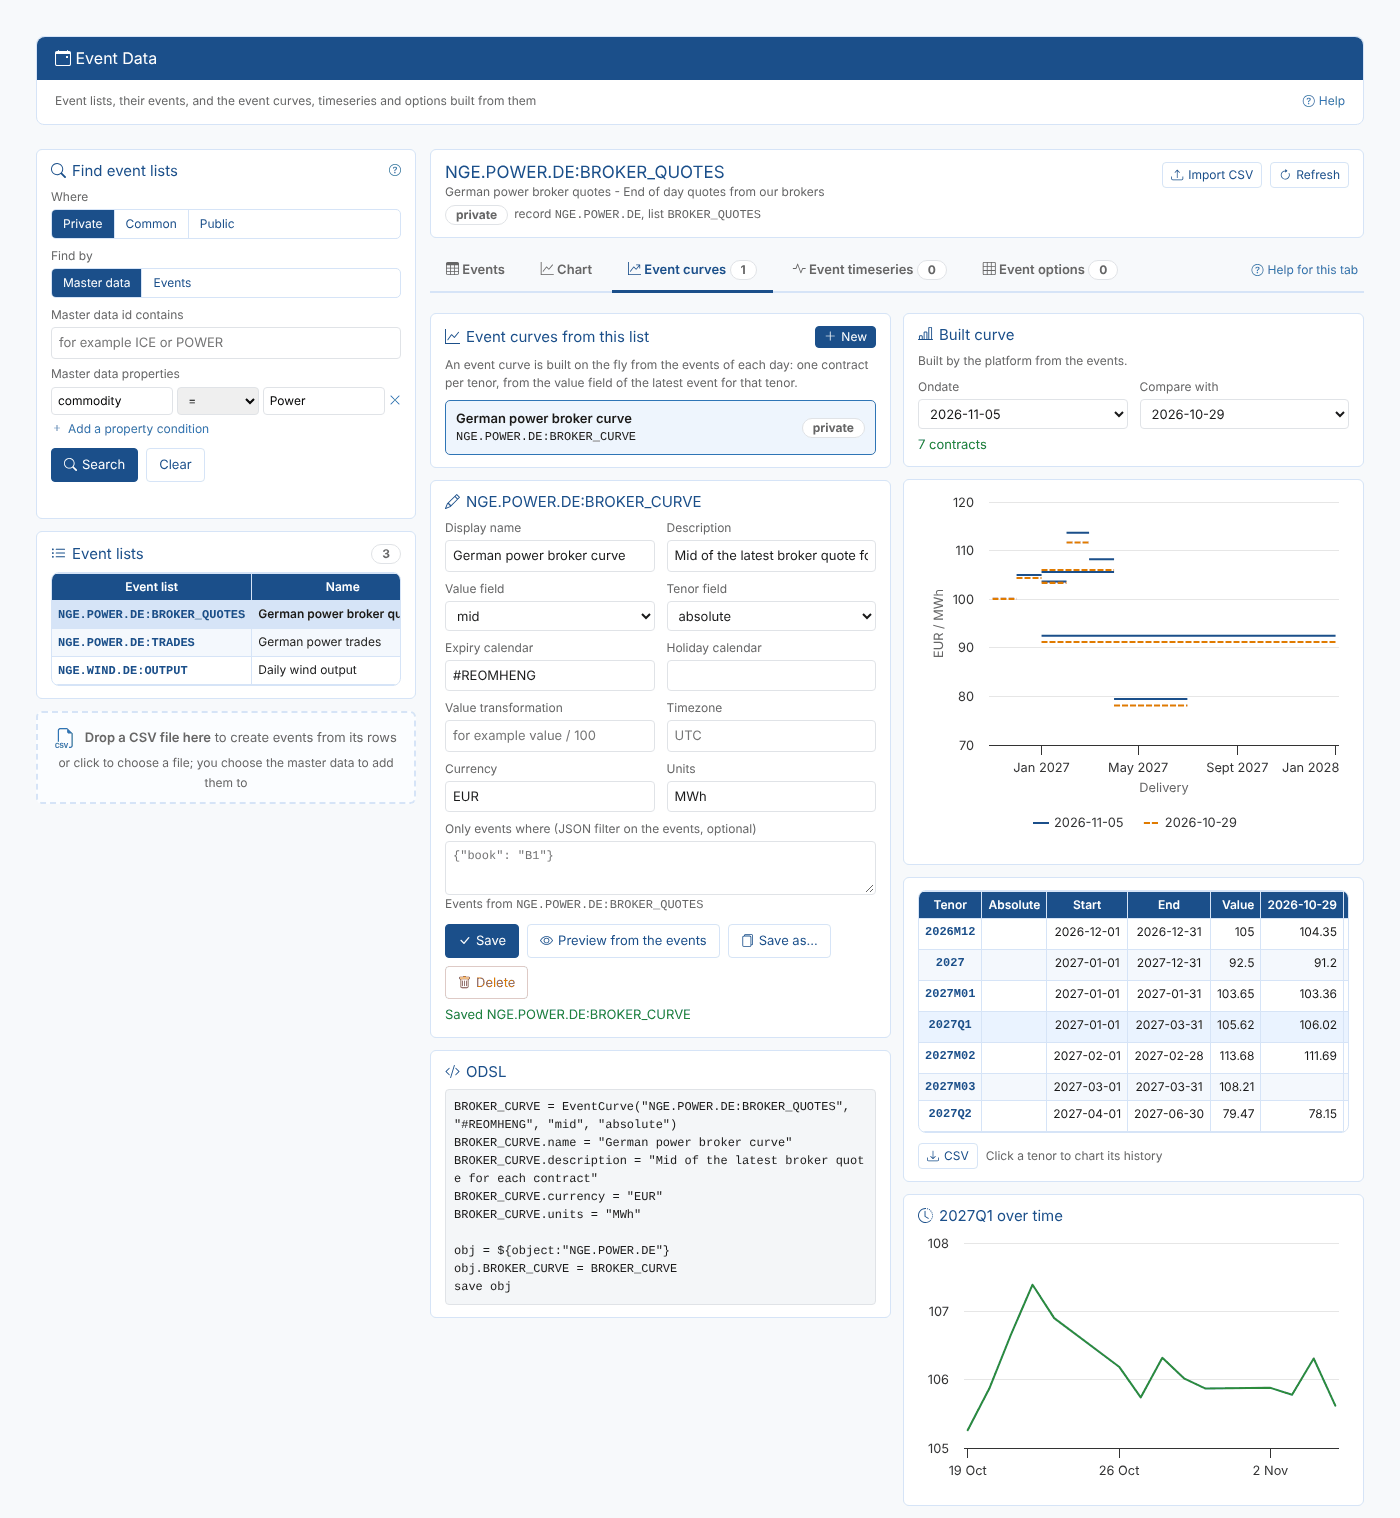
| Control | What it does |
|---|---|
| Ondate | The ondates the curve can be built for, newest first. |
| Compare with | Another ondate: drawn as a dashed line, with its values and the change in the table. |
| The table | Each contract's tenor, absolute code, delivery start and end and value. CSV downloads it. |
| Click a tenor | Charts that contract's value over the last 250 ondates, below the table. |
To change a saved curve, edit the form and select Save again. Save as... saves a copy under another record or name. Delete removes the curve, every version of it and its property on the record; the events are not changed.
Smart curves, reports and automations that read an event curve stop working when it is deleted. Check what uses it first.
Event curves in public data are shown read only; Save a copy... saves your own private copy.