Viewing and charting events
The Events and Chart tabs of an open list show what is in it. Above the tabs, the list's header shows its id, its name and description, where its events are (private, common or public), its event type and timezone when they are not the default, and the record and list name it is kept as. Refresh reads the list again; Import CSV adds events from a file (see Importing events from a CSV file).
The Events tab
The events are shown newest first, 50 to a page. The cards at the top show which events are on the page, the latest event time and how many fields the events have, next to First, Prev and Next.
| Column | What it shows |
|---|---|
| Event time | When the event happened, in the timezone of the event when it has one. |
| Event id | The event's id in its list. An event saved with the same id replaces it. Hover over it for the event's details. |
| Start and End | The period the event is about, such as the delivery period of a quote. Only shown when they differ from the event time. |
| The fields | Every field of the events, numbers aligned to the right. |
| _dsid and Event type | The dataset id and the event type, when the events have them. |
Event details
Hover over an event id (or tab to it) to see how the event was saved. Here Priya checks a quote she corrected on the morning after it was loaded.
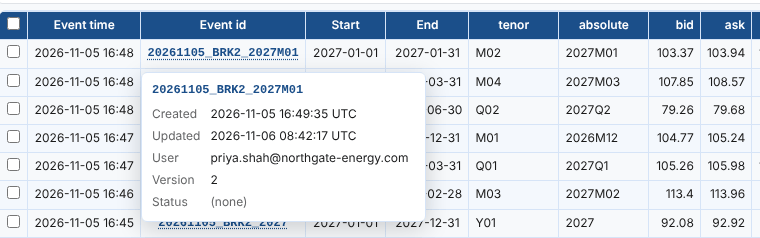
| Detail | What it shows |
|---|---|
| Created | When the event was first saved, in UTC. |
| Updated | When it was last saved, in UTC. |
| User | Who saved it last: a person, or the application that loaded it. |
| Version | How many times it has been saved: 1 for an event never changed, 2 after one correction. |
| Status | Any status information saved with the event, one item a line, or (none). |
Filtering events
| Control | What it does |
|---|---|
| Event time from and to | Only events with an event time in these days (whole days, UTC). |
| Order | Newest first or Oldest first. |
| Rows a page | 25, 50, 100 or 250. |
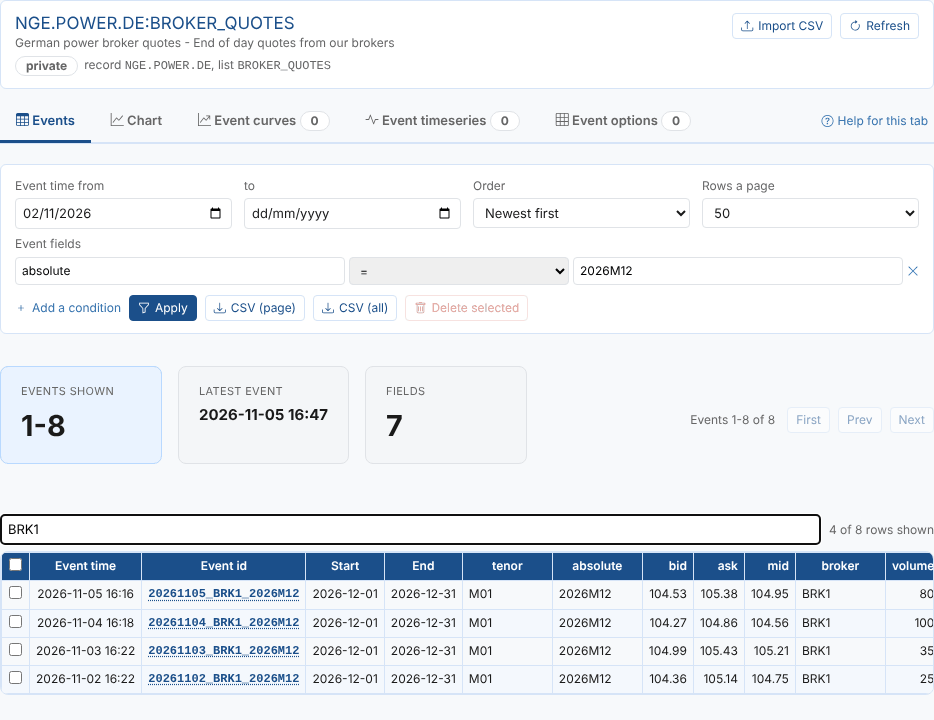
| Event fields | Conditions on the fields, with the operators described in Finding event lists. The field name box suggests the fields of the list. |
| Apply | Reads the events again with the filters. |
| Filter the rows below | Hides rows on the current page that do not contain every word typed, any case. It does not read anything again. |
Priya checks the December contract since 2 November: she adds the condition absolute = 2026M12, sets Event time from to 2 November, selects Apply, then types BRK1 in the row filter to see one broker's quotes.
Exporting events
| Button | What it exports |
|---|---|
| CSV (page) | The events on this page. |
| CSV (all) | Every event that matches the filters, up to 100,000. |
The file has the columns event, eventid, eventtime, eventstart, eventend, timezone and eventtype, then every field. Dates are written as the platform gives them, in UTC.
Deleting events
When you are allowed to delete a list's events, the Events tab has a tick box at the start of each row and a Delete selected button. The platform decides: Event Data asks it what you may do with the list's events when the list opens, and shows neither when you may not delete them. Common events can normally only be read.
| Control | What it does |
|---|---|
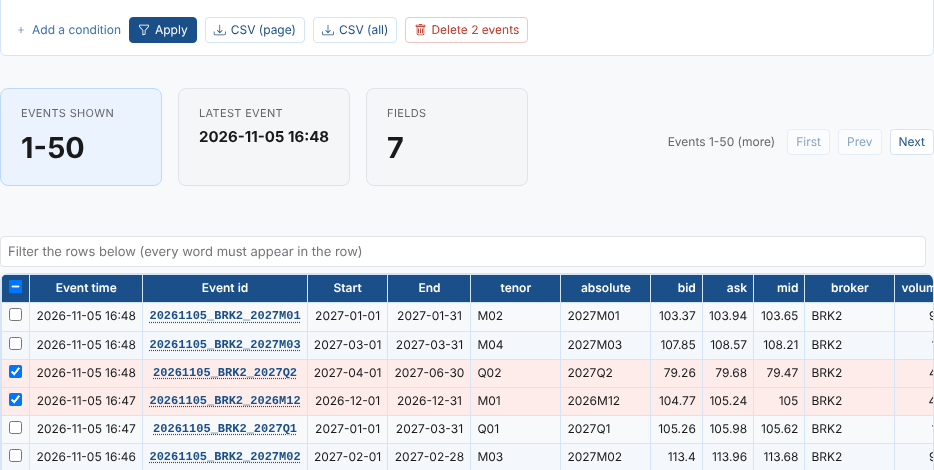
| The tick box on a row | Picks that event. Picked rows are shaded. |
| The tick box in the header | Picks every row shown, or none. With the row filter on, only the rows it shows. |
| Delete N events | Asks first, listing the events, then deletes each one with every earlier version of it. |
Priya picks two broker quotes that were sent by mistake.
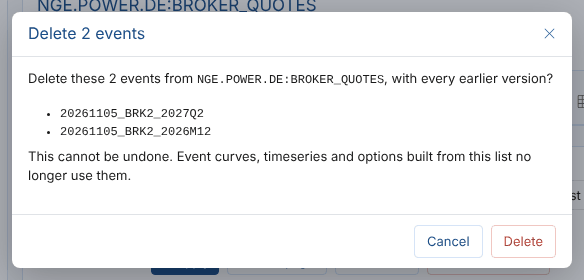
The events are deleted a few at a time, with a progress bar and a Stop button. The platform checks your delete rights on each event, so an event you may not delete is left and reported with the platform's reason, while the others are deleted. The page is then read again.
A delete cannot be undone. Event curves, event timeseries and event options built from the list leave out the deleted events from then on; a build stored earlier keeps them until it is built again.
The picked events are forgotten when you change page or apply filters: delete one page at a time.
Charting events
The Chart tab draws one number field of the events over time.
| Control | What it does |
|---|---|
| Value | The number field to chart. |
| Along | The time to plot it at: the event time, start or end, or any date field of the events. |
| A line for each | A text field: one line for each of its values (up to 30), or one line for everything. |
| Style | Line, points, columns or steps. |
| Event time from and to | The days to chart. When empty, the dates on the Events tab are used. |
| At most | How many events to read: the latest 1,000, 5,000 or 20,000. |
The conditions on the Events tab apply to the chart too. Priya charts mid with a line for each absolute contract, to see how each contract's quotes moved over the last three weeks.
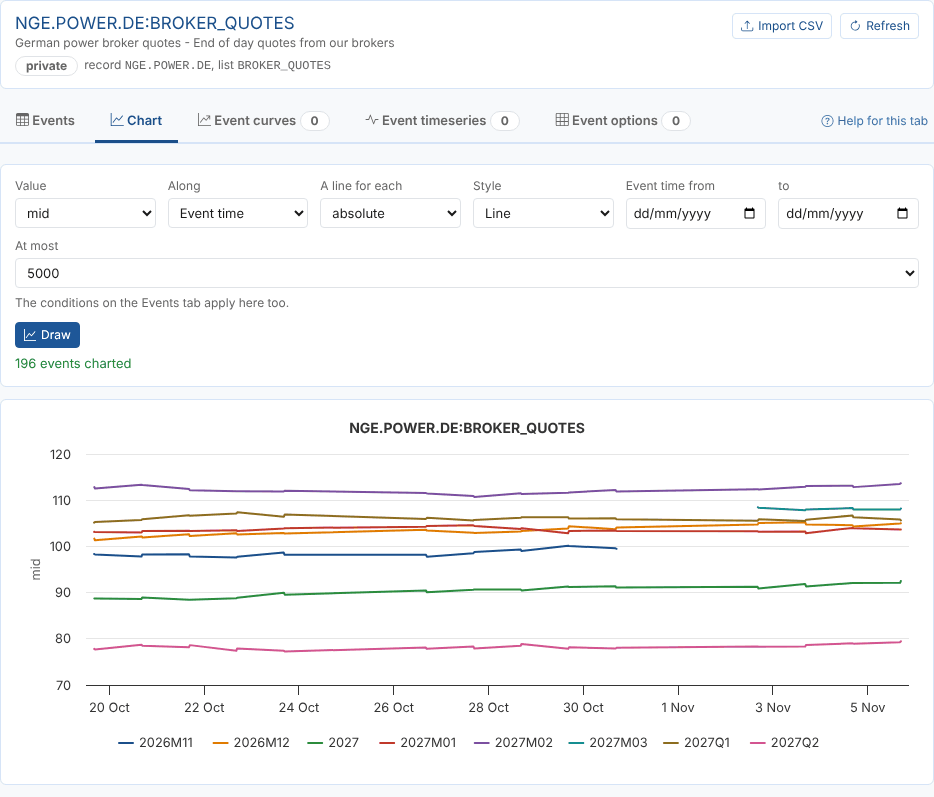
Drag across the chart to zoom into a few days.