Execution Dashboard
The execution dashboard is used to monitor process executions in real-time. You can also drill-down into specific executions to check the correct flow and understand why and where they failed.
Layout
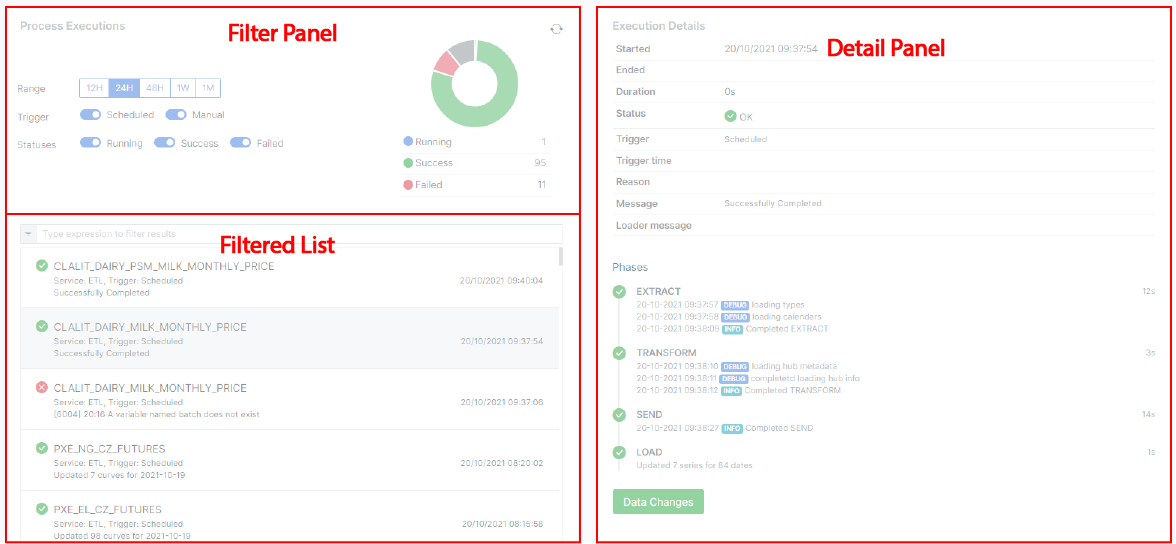
The execution dashboard screen contains 3 distinct sections:
- Filter panel - used for filtering the process executions
- Filtered list - the process executions which match the filter
- Detail panel - details of the currently selected process execution
Filter panel
The filter panel allows you to filter the process executions to the range and type of execution you want to focus on.
You can filter on the following:
- Time range - you can select all executions within the last:
- 12 hours
- 24 hours
- 48 hours
- Week
- Month
- How the process was triggered
- Scheduled
- Manual
- Event
- The status of the execution
- Running
- Success
- Failed
The summary chart shows all the executions for the currently selected range only
Filtered list
The filtered list shows the process executions which match the currently selected filters.
Each item in the list contains the following information:
- The status of the execution represented by an icon
- The name of the process
- The service name of the process
- How the process was triggered
- The timestamp of when the process execution started
- The loader message of the process if it exists, otherwise the status message
An example item from the list

Actions
Click on process execution item
When you click on an item in the list, the details of that process execution are shown in the detail panel.
Hover over process execution item, click on run button
Displays a process configuration dialog where you can amend the process configuration (if needed) and run the process.
Amending the configuration on this screen is only for that one manual run and not saved
Hover over process execution item, click on copy button
Copies the process execution id into the clipboard
Detail panel
The detail panel shows the full details of the currently selected process execution.
The detail panel is broken into 3 sections:
- Process execution details
- Phases
- Process details
Process execution details
This section displays information about the process execution itself - the table below explains each item of information:
| Name | Description |
|---|---|
| Started | The timestamp of when the process execution actually started |
| Ended | The timestamp of when the process execution completed |
| Duration | The amount of time, in seconds, that the execution ran for |
| Status | The status of the process execution, if the process is complete, this is the final status |
| Trigger | How the process was triggered |
| Trigger time | If the process is scheduled, this is the timestamp of when it was scheduled to run |
| Reason | The reason why this process was executed |
| Message | The status message of this execution |
| Loader message | If this is an ETL process, this is details about what was loaded |
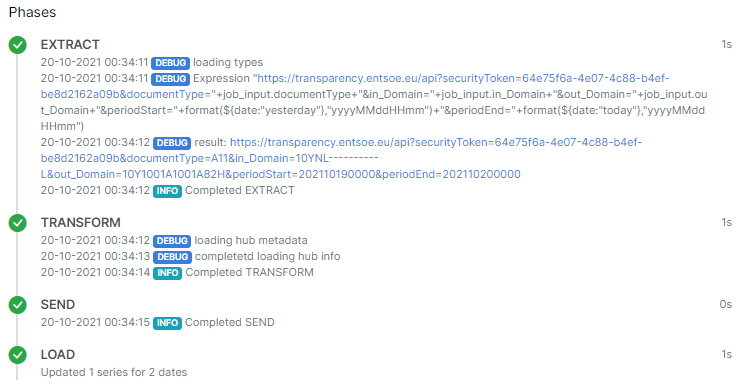
Phases
This section breaks the process down into individual phases as determined by the workflow that has been run.
Each phase shows:
- The phase status
- Phase name
- Logging information
- Duration of the phase
An example phases section
Underneath the phases section is a button for you to show details about the TimeSeries and Curves that were updated during the process execution.
Process details
This section shows information about the process:
| Name | Description |
|---|---|
| Name | The name of the process |
| Description | A description of the process |
| Service | The service category of the process, e.g. ETL |
| Status | The status of the process, either enabled or disabled |
| Calendar | The calendar associated with the process, if any |
| Cron | The cron trigger expression used to schedule the process |
| Next run | The timestamp of when the next time this process will be run |
| Workflow | The name of the workflow that this process runs |