Process Dashboard
The process dashboard is similar to the execution dashboard, but is focussed on the processes rather than the process executions. It gives you vital summary information about the executions of a specific process.
Layout
The process dashboard screen contains 3 sections
- Process list - the list of all your processes
- Configuration panel - configuration details for the currently selected process
- Executions panel - interactive panel showing details about all the executions of the currently selected process
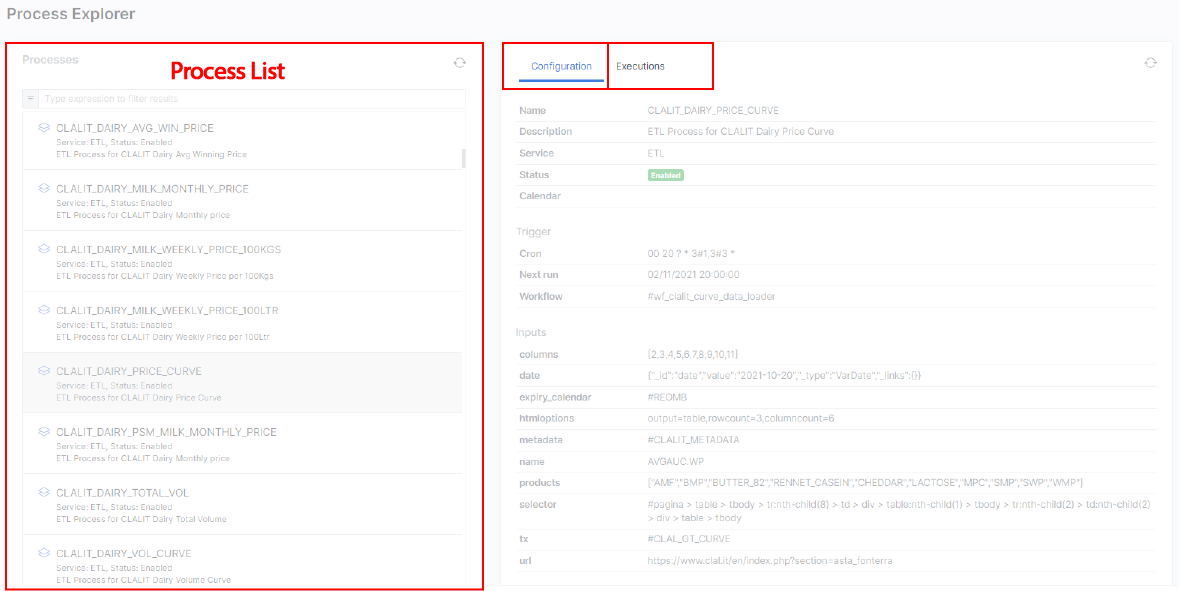
Process List
The process list section is a list of all your processes. You can use the search box to search for a specific process.
Actions
Click on process
Clicking on a process shows details about that process in the configuration panel and executions that have happened in the executions panel
Hover over a process, click on run button
Displays a process configuration dialog where you can amend the process configuration (if needed) and run the process.
Amending the configuration on this screen is only for that one manual run and not saved
Hover over a process, click on copy button
Copies the process name into the clipboard
Configuration Panel
This section shows information about the process:
| Name | Description |
|---|---|
| Name | The name of the process |
| Description | A description of the process |
| Service | The service category of the process, e.g. ETL |
| Status | The status of the process, either enabled or disabled |
| Calendar | The calendar associated with the process, if any |
| Cron | The cron trigger expression used to schedule the process |
| Next run | The timestamp of when the next time this process will be run |
| Workflow | The name of the workflow that this process runs |
| Inputs | The inputs section shows all the variables that will be passed into the process |
Executions Panel
The executions panel shows information about the historic executions of the currently selected process.
Execution summary
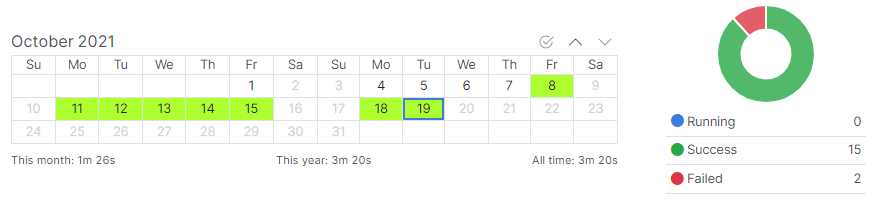
The execution summary section shows a summarised view with the following information:
- A calendar month showing the days that the process ran and the status of the last run of that day
- The total amount of processing time for this process for
- The current month
- The current year
- All time
- A chart showing the count of the number of runs broken down by status
Execution details
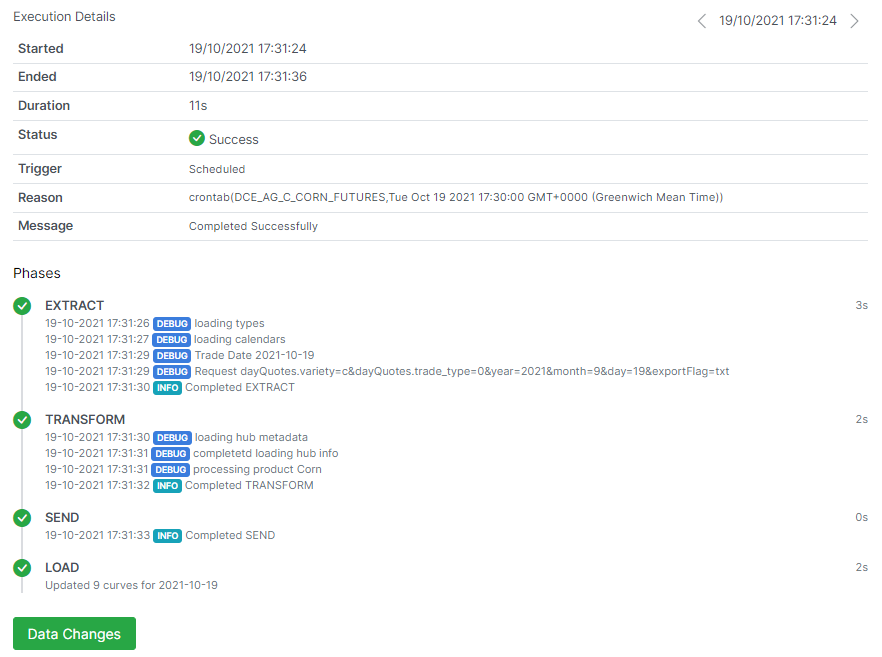
The execution details contain information about a specific process execution
| Name | Description |
|---|---|
| Started | The timestamp of when the process execution actually started |
| Ended | The timestamp of when the process execution completed |
| Duration | The amount of time, in seconds, that the execution ran for |
| Status | The status of the process execution, if the process is complete, this is the final status |
| Trigger | How the process was triggered |
| Trigger time | If the process is scheduled, this is the timestamp of when it was scheduled to run |
| Reason | The reason why this process was executed |
| Message | The status message of this execution |
| Loader message | If this is an ETL process, this is details about what was loaded |
Phases
This section breaks the process down into individual phases as determined by the workflow that has been run.
Each phase shows:
- The phase status
- Phase name
- Logging information
- Duration of the phase
Underneath the phases section is a button for you to show details about the TimeSeries and Curves that were updated during the process execution.
Actions
Click on a date in the calendar
Displays the last process execution of the selected date
Click on the up or down arrow above the calendar
Clicking up moves the calendar to the previous month.
Clicking down moves the calendar to the next month
Click the current selection button above the calendar
Moves the calendar to the date of the currently selected process execution
Click on the left or right arrow above the execution details
Clicking left shows the previous process execution for the selected date
Clicking left shows the next process execution for the selected date