The daily report
Every system has a daily report: one stored report per date sent, named INTEGRATION_<KEY>, where the key is the groups' Report key (MOLECULE for Northgate). Each group's run is merged into it, so the report for 3 November shows the morning curves and the capture prices together, whichever group sent them.
Reading the report
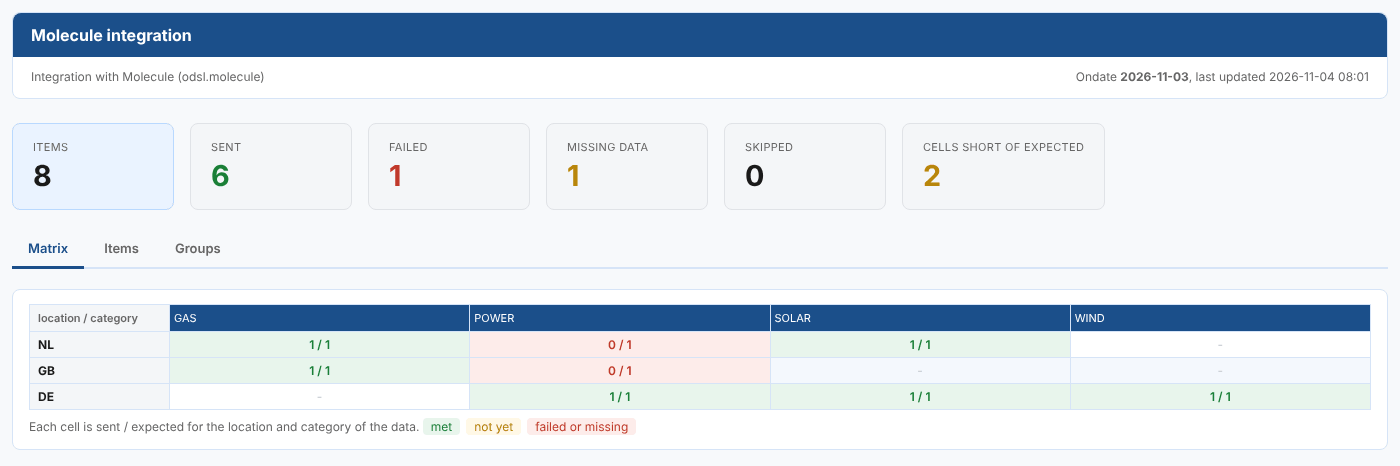
The cards at the top count the items: Items, Sent, Failed, Missing data, Skipped, and Cells short of expected when the report has a matrix. Held back by validation shows when the validation gate kept items back.
The Matrix tab counts the items by two data properties of your choice, here location down the side and category across. Each cell shows what was sent against what you expect, and its colour says whether that is enough:
| Cell | What it means |
|---|---|
1 / 1, green | At least the expected number of items were sent. |
0 / 1, amber | Fewer than expected were sent, and none of the others failed: something has not been sent yet. |
0 / 1, red | Fewer than expected were sent, and at least one item in the cell failed or had no data. |
- | Nothing expected and nothing sent. |
| A number with no expected count | Items were sent for a pair you have set no expectation for. Red when one of them failed. |
Hover over a cell to see the number sent, expected and failed or missing.
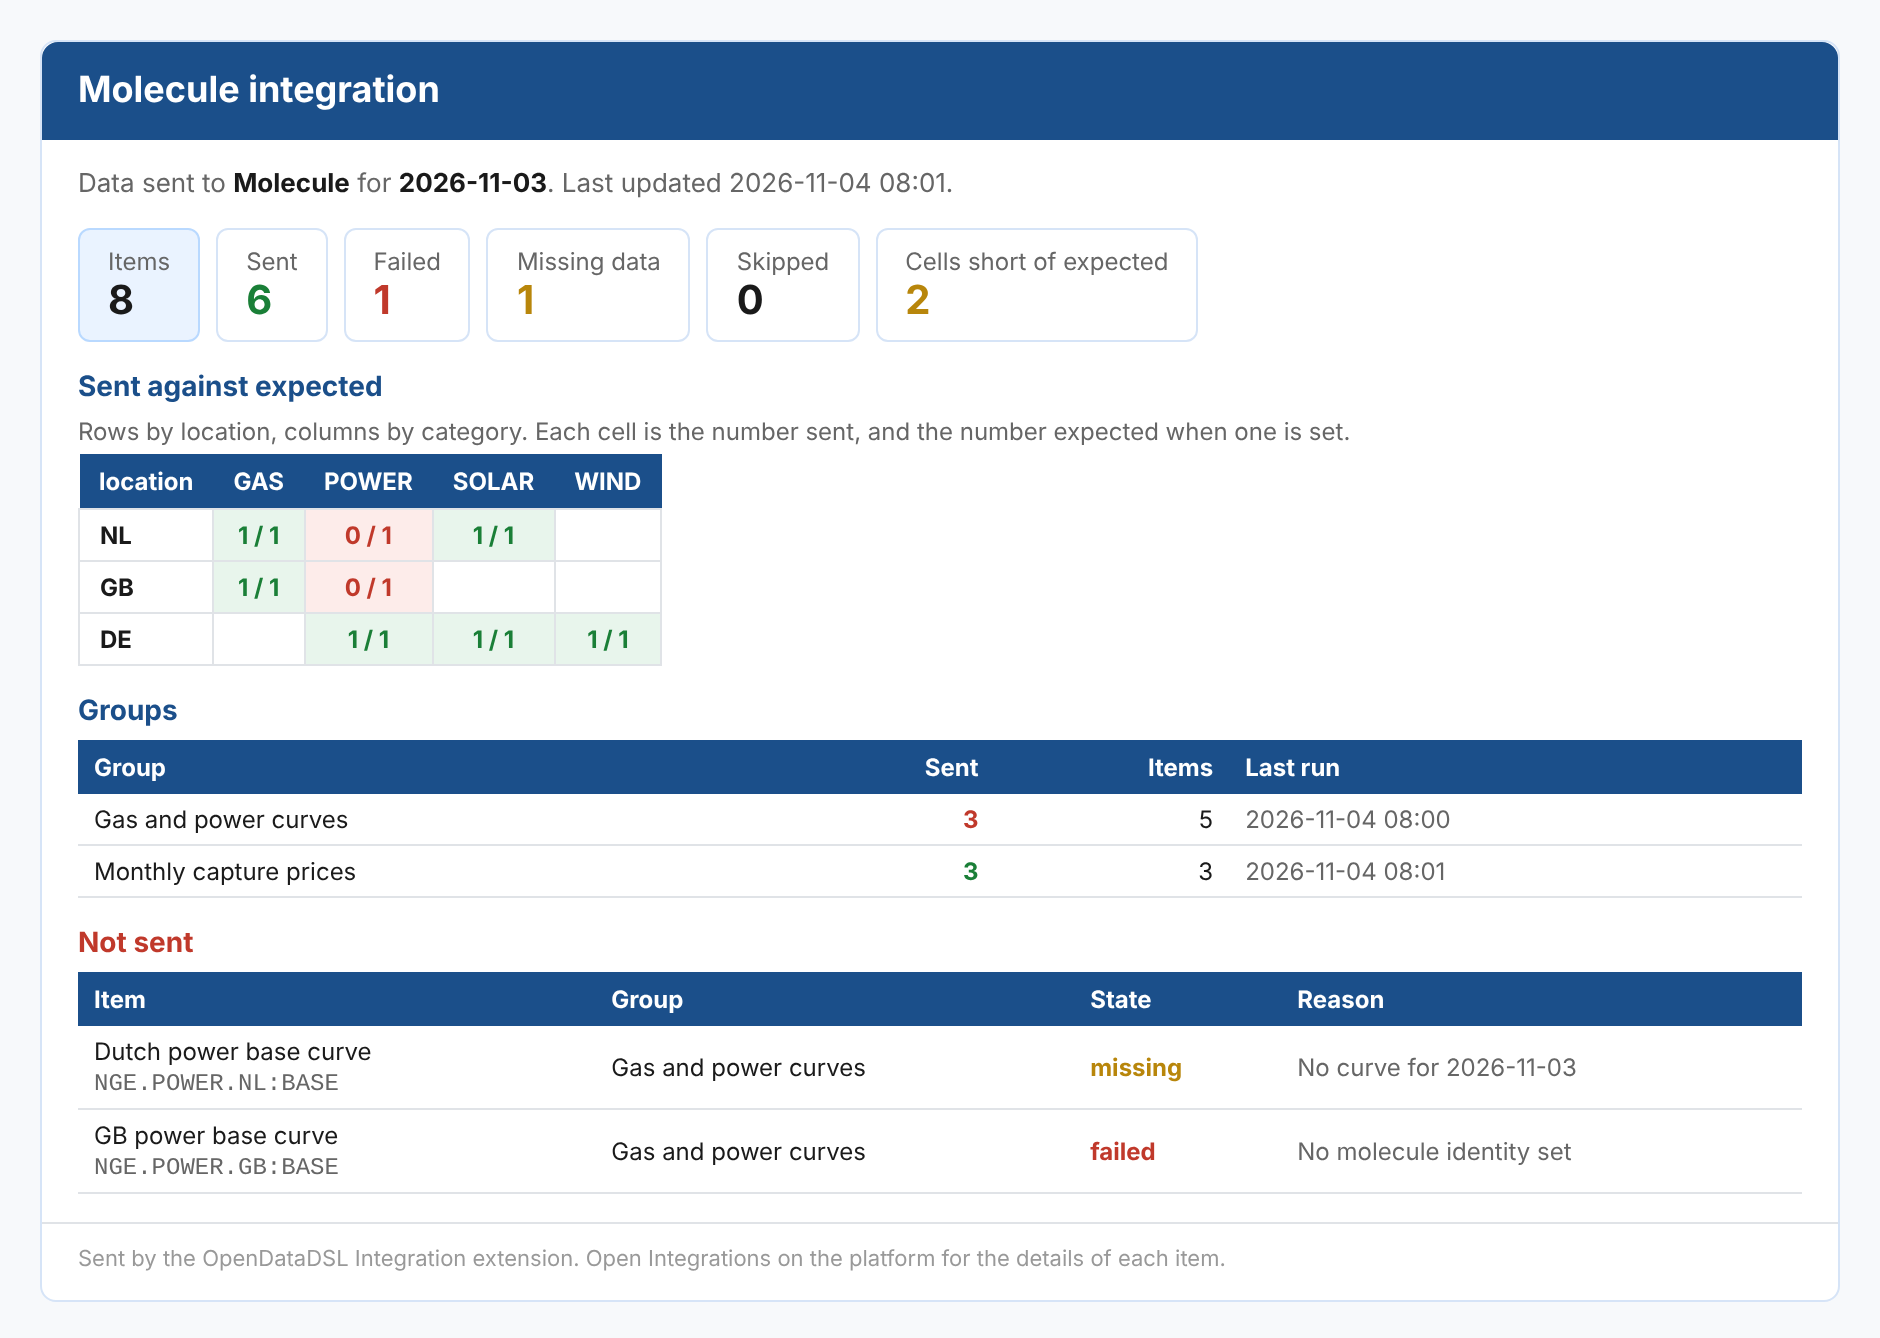
For Northgate on 3 November, NL POWER is red because the Dutch power curve had no curve for the date, and GB POWER is red because the GB power curve had no Molecule product.
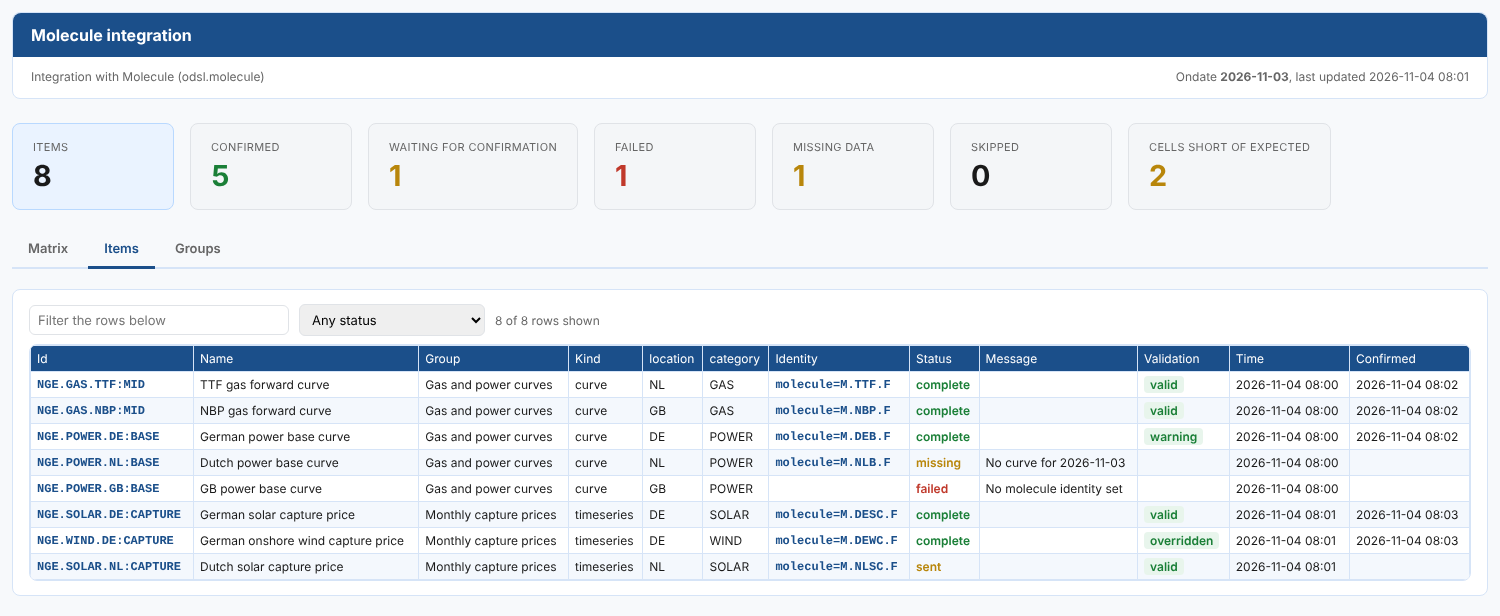
The Items tab lists every item with its group, kind, the two matrix properties, its identities, state, message, validation status (when the validation gate applies to it), when it was sent and, for a system that confirms what it loads, when it was confirmed. Type in Filter the rows below or choose a status to find items quickly.
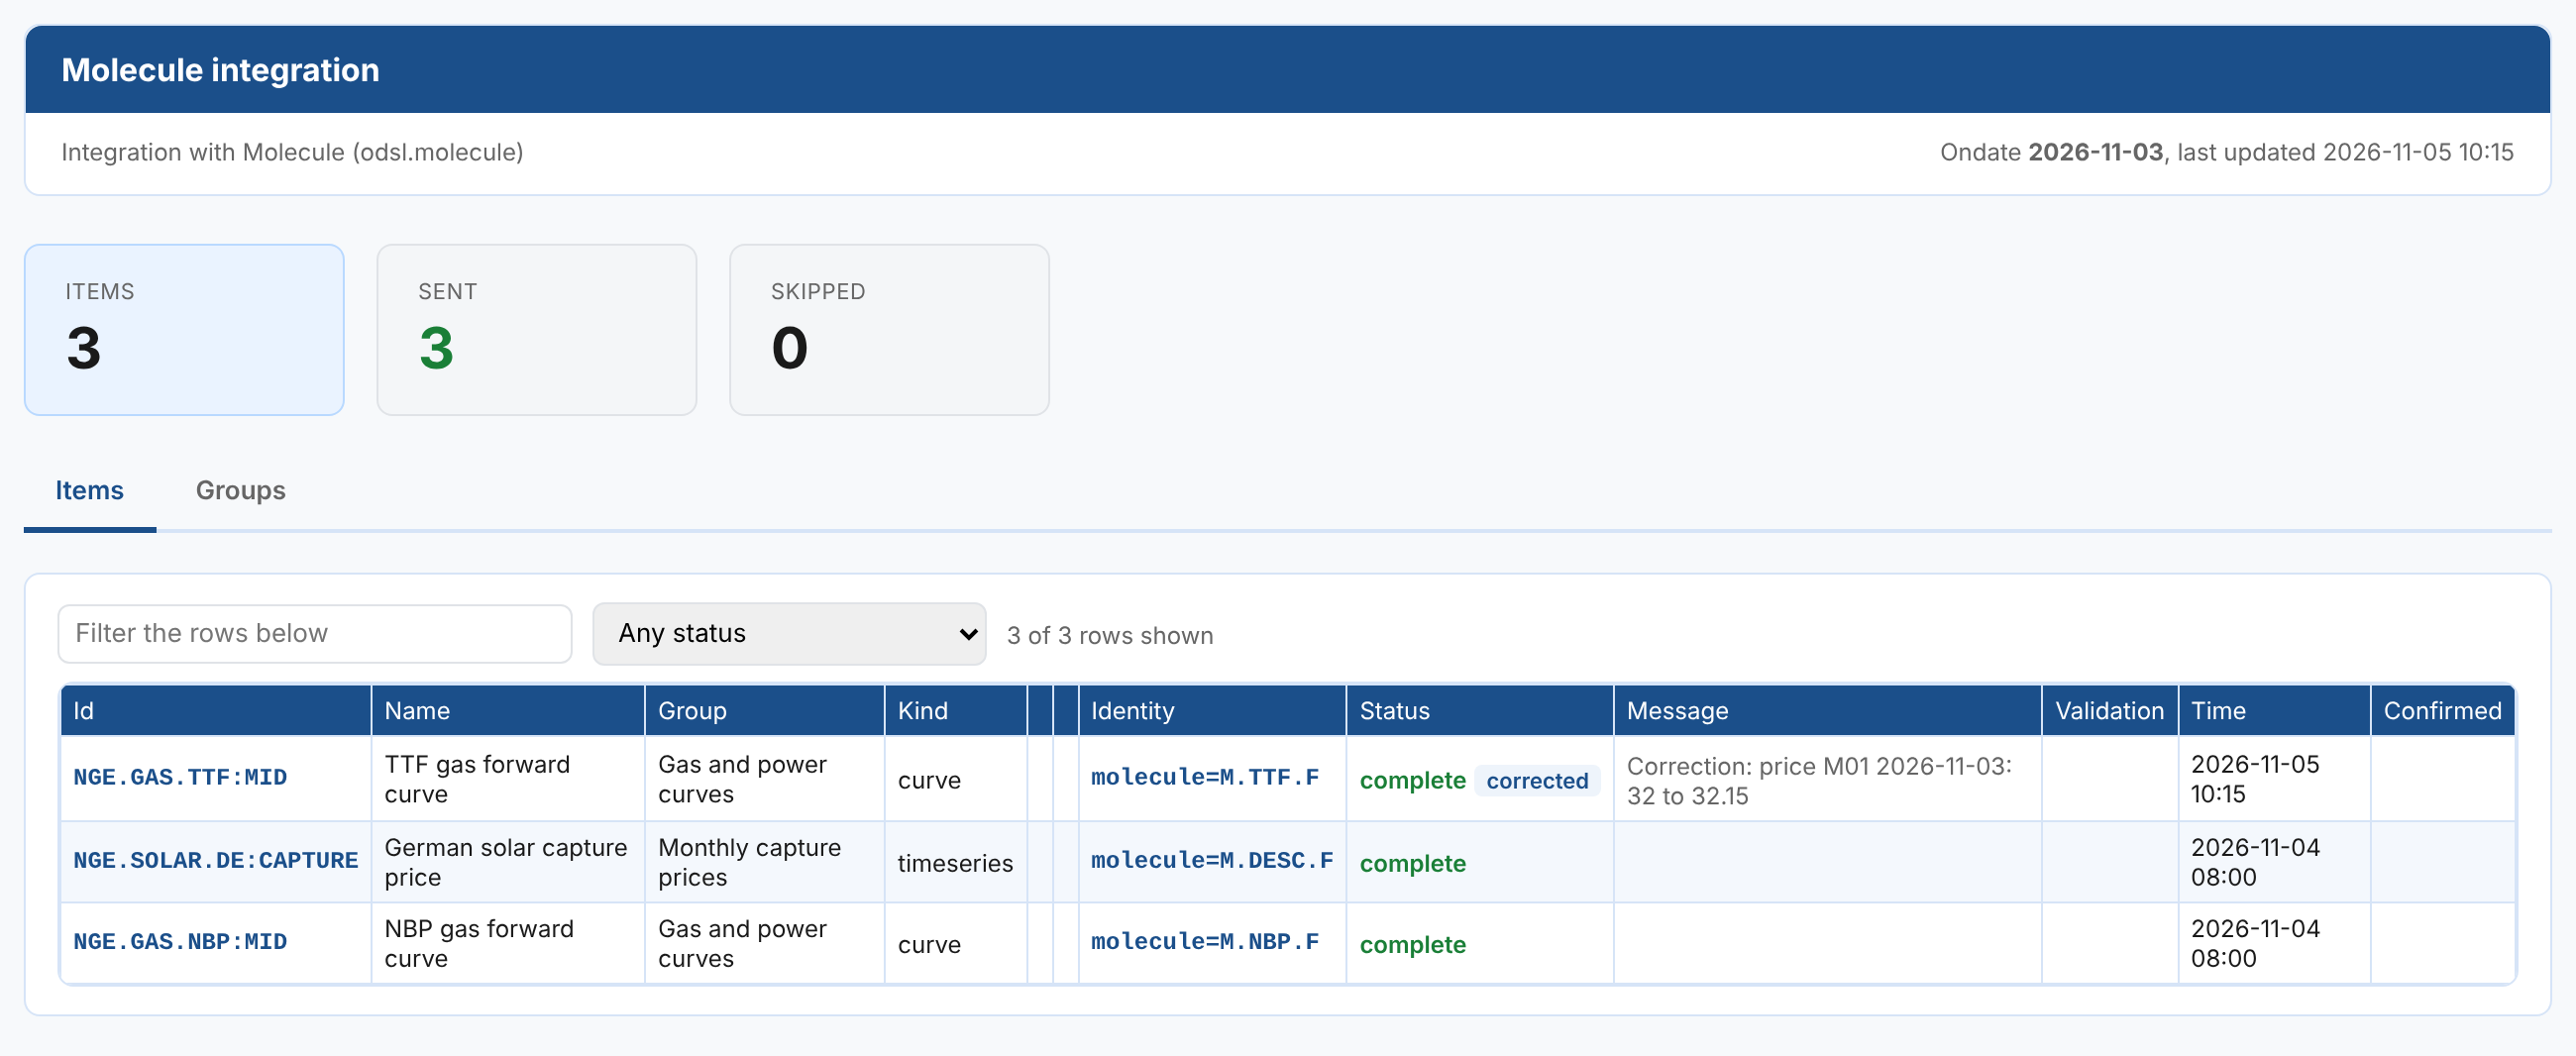
An item sent again as a correction shows corrected next to its state, with what changed under its message; the status Sent again as a correction lists them.
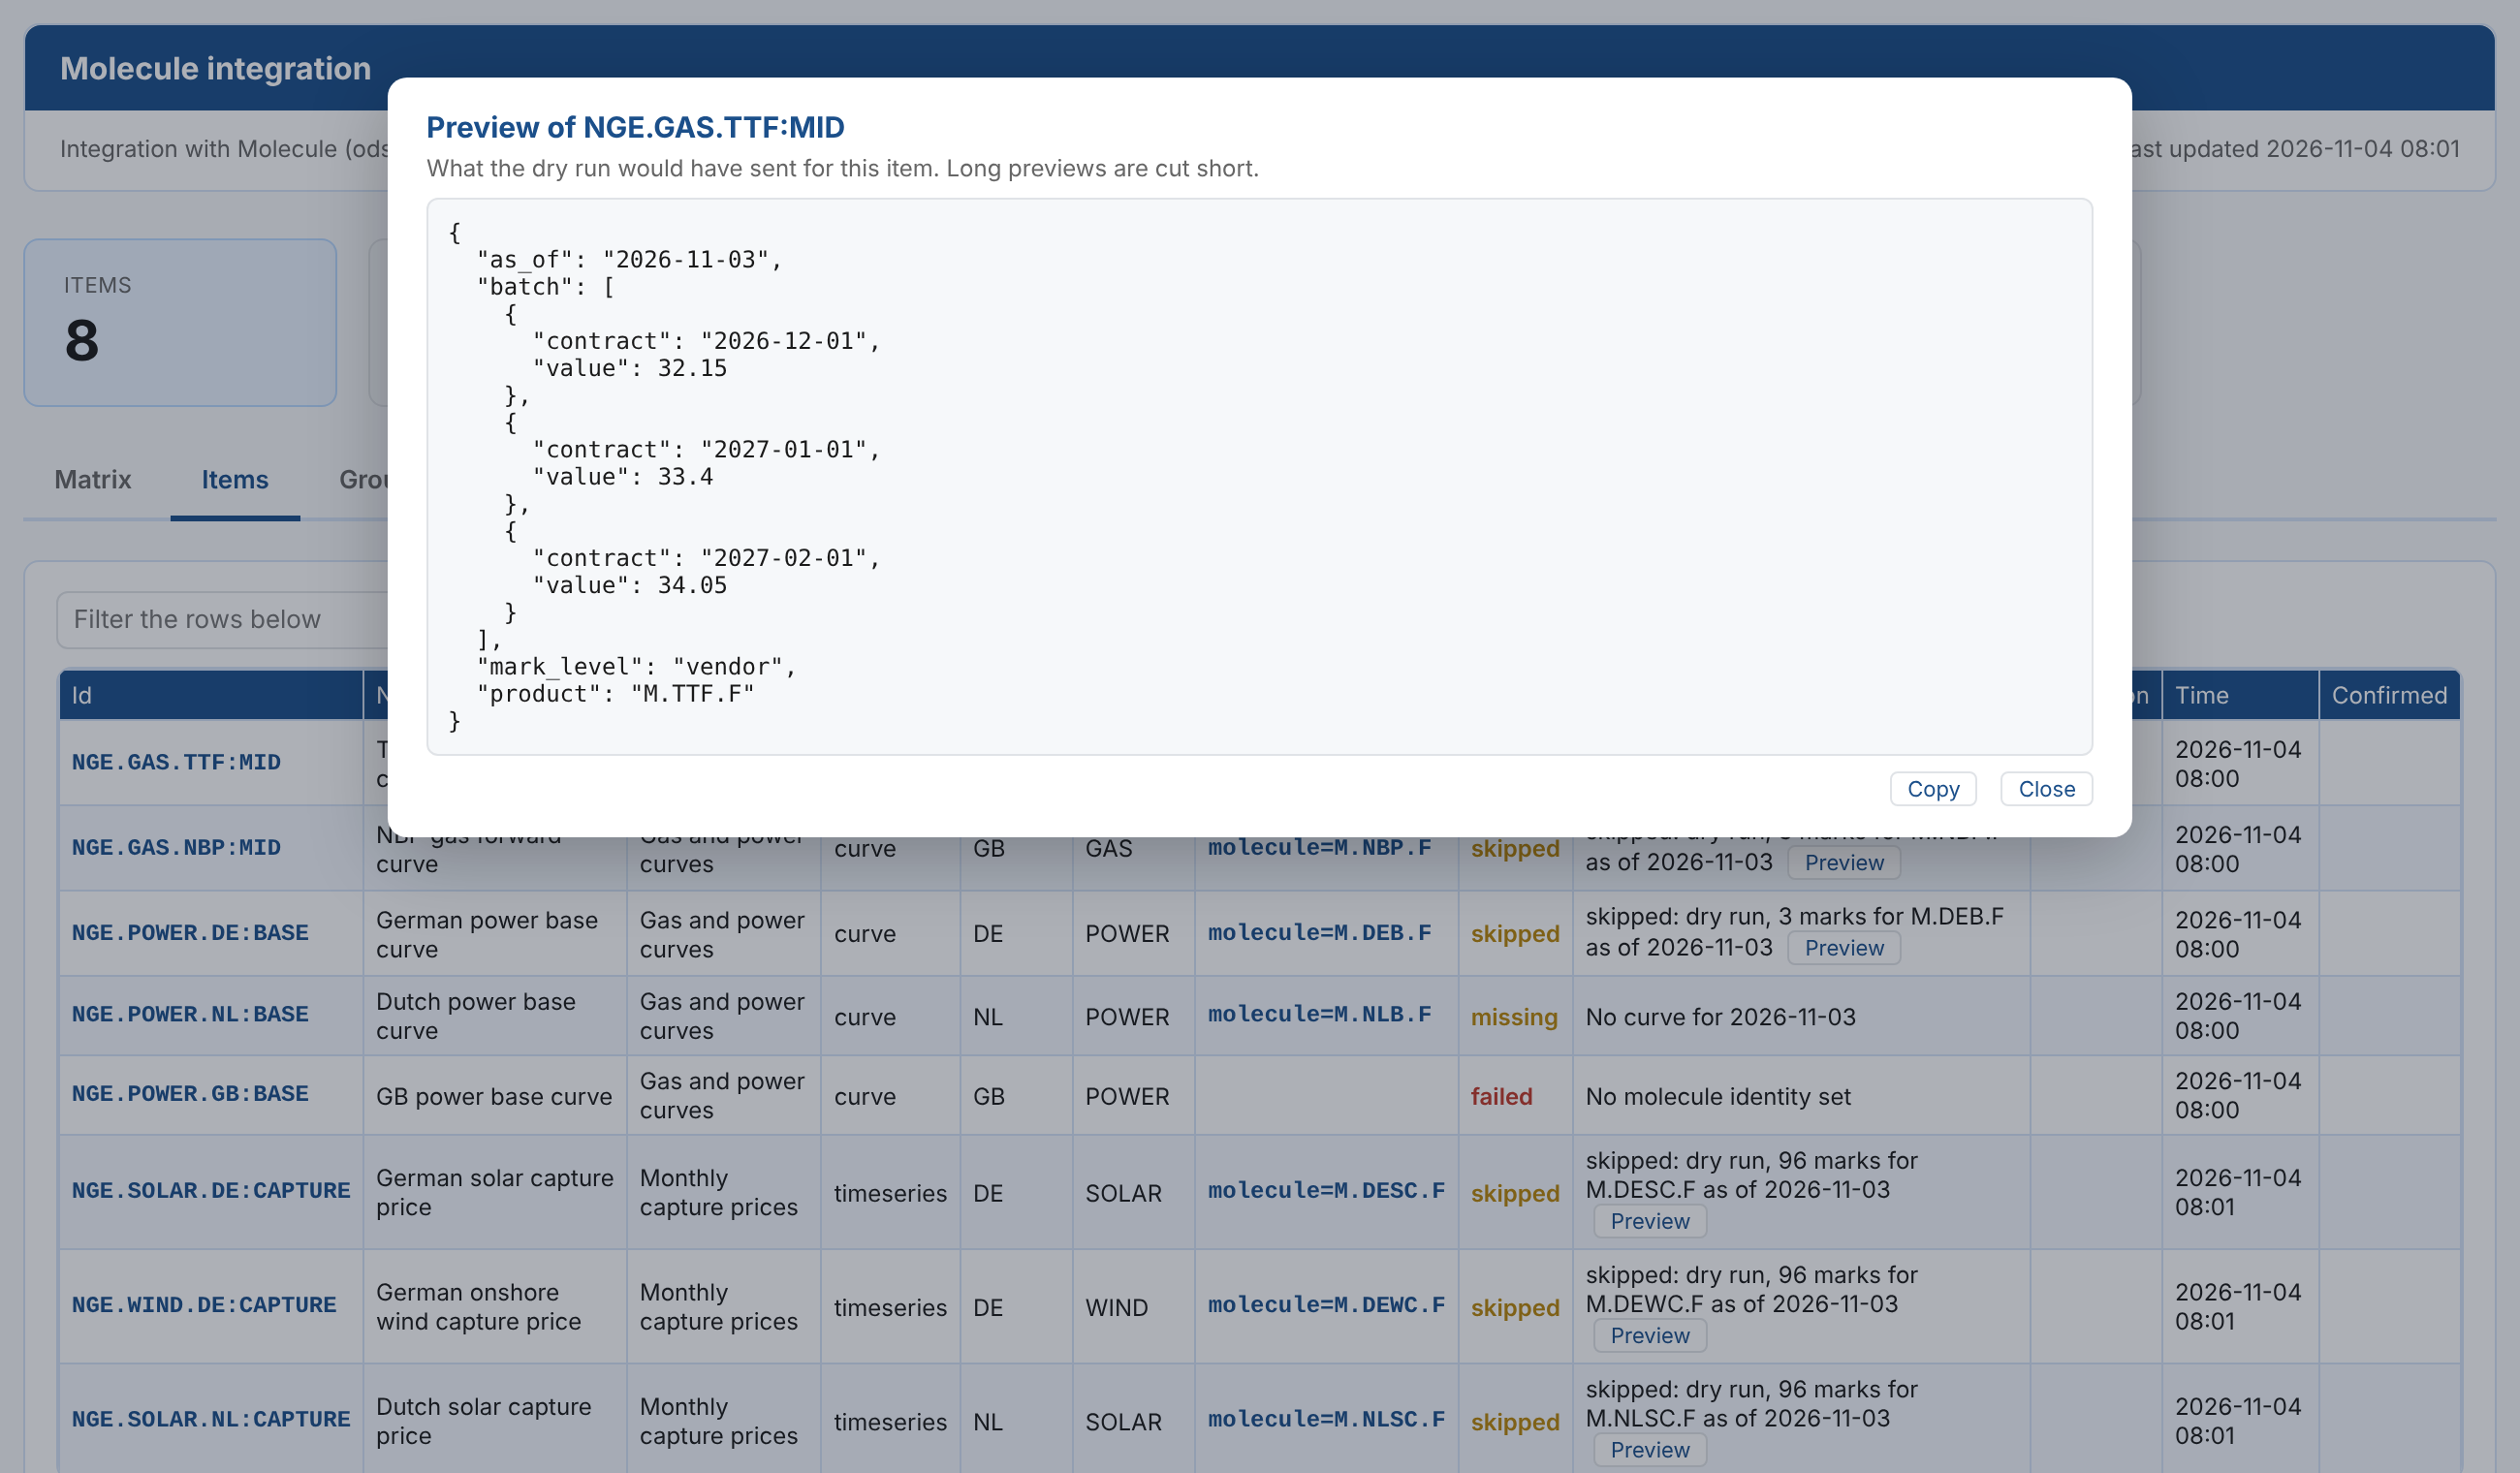
After a dry run (with the system's send setting unticked), each item has Preview next to its message: it opens what would have been sent for the item, such as the Molecule payload or the message, CSV rows or template text of a generic plug-in, with Copy to take it elsewhere. A run that sends replaces the preview.
The Groups tab lists each group in the report with the number of items, the number sent and the time of its last run.
Setting what you expect
Open the Report tab of the Integrations screen.
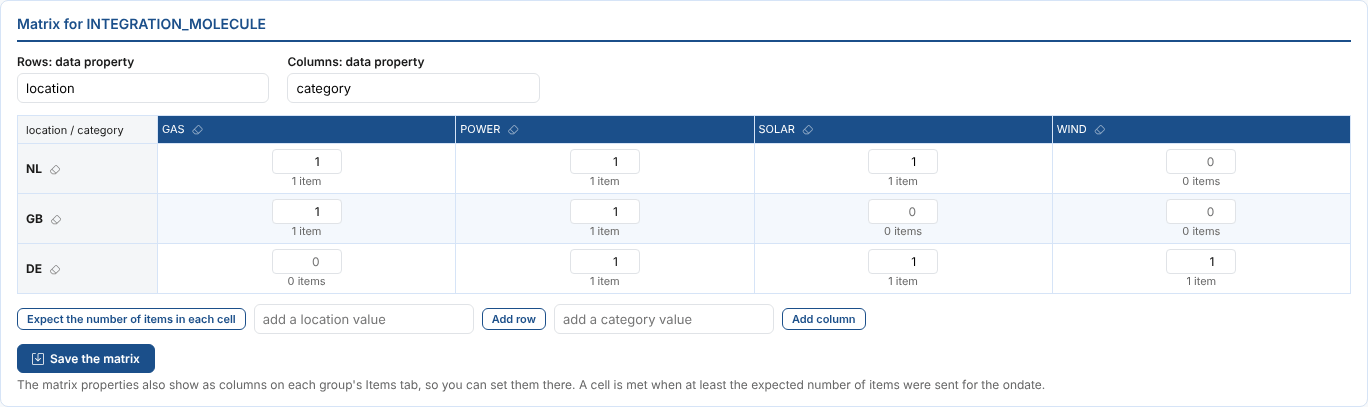
- Under Rows: data property and Columns: data property, type the two properties to count by. The boxes suggest the properties the items already have.
- Type the number of items you expect in each cell. Under each cell is the number of items the groups have for it now.
- Expect the number of items in each cell fills every cell with that number, a good start.
- Add row and Add column add a value that no item has yet, for a curve you are still setting up. It stays in the grid when you save, even before you expect anything in it.
- Select Save the matrix. It is used from the next run.
To take a row or column out, select the cross next to its heading, then save. A value that items still have cannot be taken out, because the report always counts what the items have: its button is an eraser instead, which clears the row's or column's expected counts. To remove such a value, change the property on the items on a group's Items tab.
Items that have no value for a matrix property are counted under (not set). The two matrix properties also show as columns on each group's Items tab, so you can set them there.
Expect every item you send. Then a cell turns amber or red as soon as one curve does not arrive, even when the run as a whole looks almost complete.
Stored reports
The Stored reports part of the Report tab shows the report for any date it was stored, chosen under Ondate. Open the report on the Overview tab opens the latest one there. The reports are also on the platform's Reports screen, category Integration, and you can add automations to them like any other report, for example to email the report when a run has failed (see Automations).
When several groups share a report key, the screen shows a Report box to choose between the system's reports.
The cutoff
The Cutoff part of the Report tab sets the time by which everything in the report should be sent, and raises an alert when it is not. See Alerts and the cutoff.
Emailing the report on a schedule
The Scheduled emails part of the Report tab emails the report to a list of people at set times, for example to the trading desk every weekday morning once the groups have run. The email holds the summary counts, the matrix of sent against expected, each group's count, and the items that were not sent with the reason.

- Select Add a scheduled email.
- Under To, enter the email addresses, separated by commas.
- Change the Subject if you want.
${date:dd MMM yyyy}in it becomes the date of the report, such as03 Nov 2026. - Choose when it is sent under Sends, or choose Custom cron and enter a cron, such as
30 9 * * MON-FRI * EU1for weekdays at 09:30 UK time. - Select Schedule the email.
Each email sends the latest report stored, so schedule it after the runs of the groups that share the report. An email sent before today's runs shows the latest day stored. The email shows the date it is for.
| Action | What it does |
|---|---|
| Edit | Changes the recipients, subject or schedule, or switches the email off with Enabled. |
| Send now | Sends the email now with the latest report, to check it. |
| Remove | Stops the email. Select it twice. |
| Preview the email | Shows the email for the latest stored date as it is sent. |
The platform only sends emails to addresses in your company's own domain, unless your company has asked for that limit to be lifted. An email to another domain fails with email recipients are restricted to the domain.
Each scheduled email is a scheduled automation on the report, so it is also listed in Automations, where you can see when it was sent and whether it failed.
Next
Custom systems: send data to a system that has no plug-in.