Extensions
An extension adds screens to the portal for one job: exploring data, building compositions, loading and exporting data, checking quality, managing scripts, working with Fusion AI and more. Almost every item in the menu is an extension.
Extensions work with your own access rights: an extension can only show and change the data you are allowed to see and change.
Where extensions appear
An extension can add any of these:
| What | Where you see it | Example |
|---|---|---|
| Menu items | In a menu group, with an icon and a short description | Data > Data Explorer |
| Tabs on other screens | Extra tabs when you open an item in another screen | The Composer tab when you open a composed curve in Data Explorer |
| Insights | Reports on the Insights tab of a screen | Timeseries Profile on a timeseries in Data Explorer |
| Tasks | Tasks on your Home page | Load data from a file or API |
| Automations | Automations you can switch on for your data | Send an email when a curve is built |
So when an extension is installed, it may show up in more than one place. For example, Composer has its own menu item and also adds a tab to Data Explorer.
Which extensions you have
To see the extensions your organisation has, open your profile menu at the top right, select Account, then Organization > Extensions.
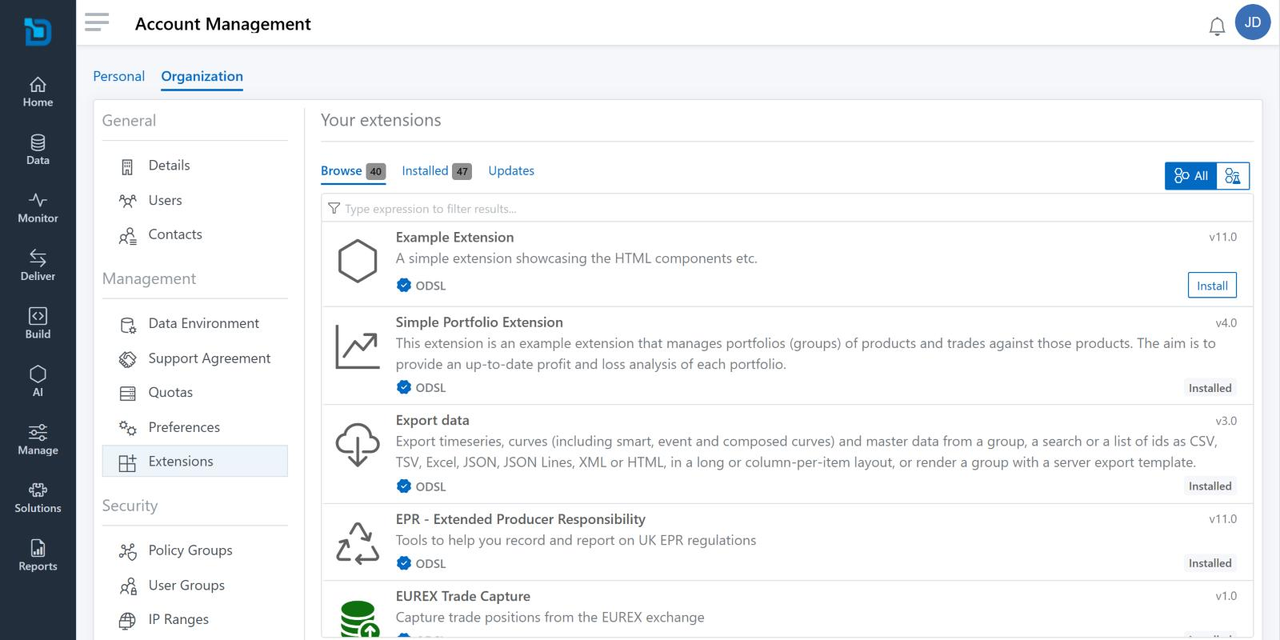
| Tab | What it lists |
|---|---|
| Browse | Every extension available to your organisation, with its version and publisher. Those already installed say Installed; the others have an Install button. |
| Installed | The extensions your organisation has installed, each with Uninstall |
| Updates | Installed extensions with a newer version waiting |
The buttons at the top right switch between All extensions and Preview extensions. A preview extension is marked Preview: it works, but it is new and may still change.
Installing or uninstalling an extension changes the portal for everyone in your organisation, so it is usually done by an administrator. If you need an extension your organisation does not have, ask your administrator.
Every extension
Each card below opens the extension's user guide. The same list is on the Extensions page.
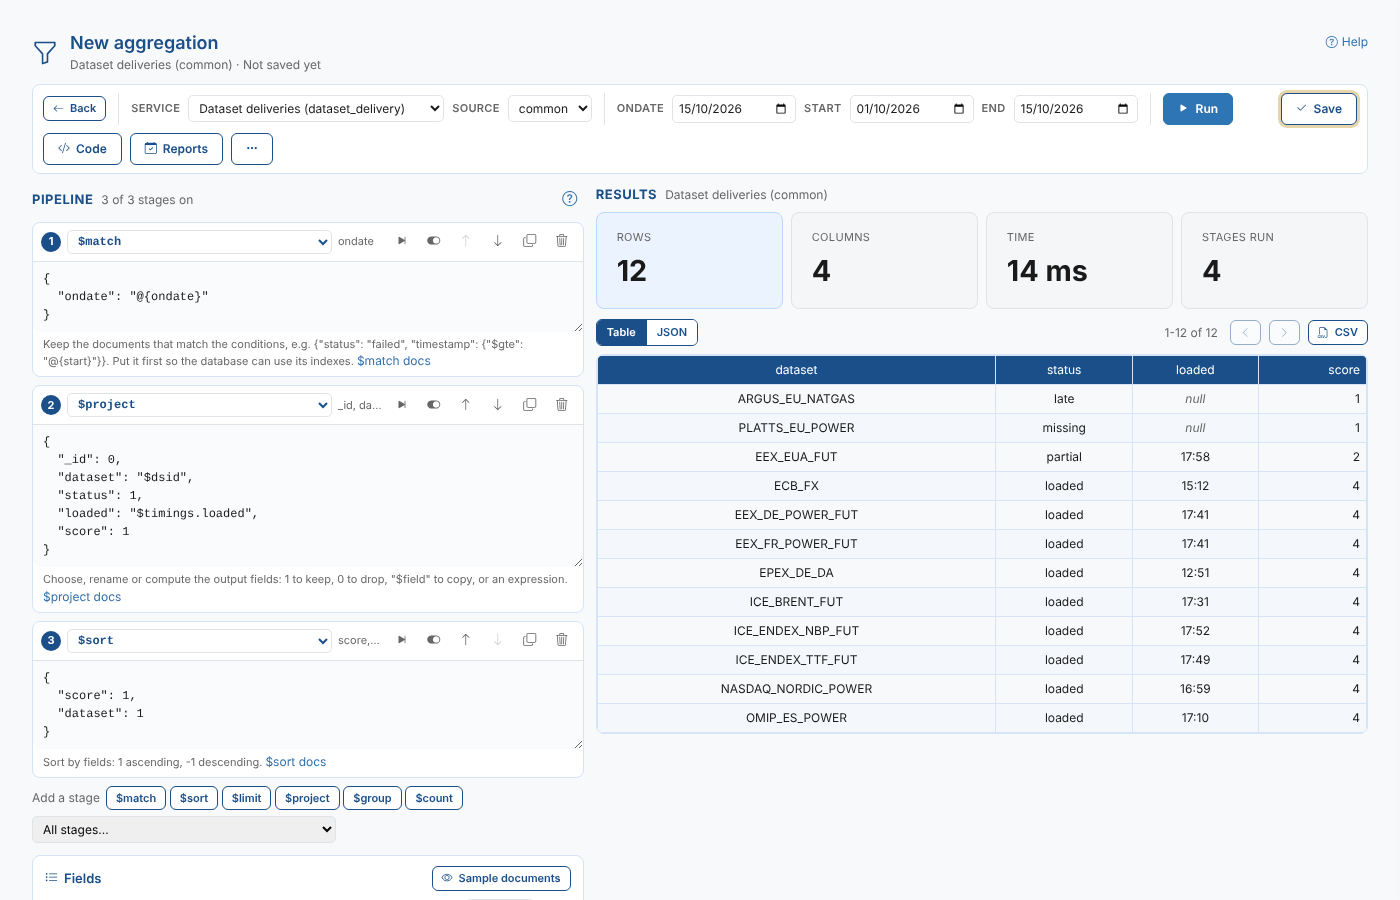
Aggregator
Summarise the data in any platform service with an aggregation pipeline, save it as an ODSL script, and run it as a scheduled, house-style report that is emailed each time it is stored.
Read the guide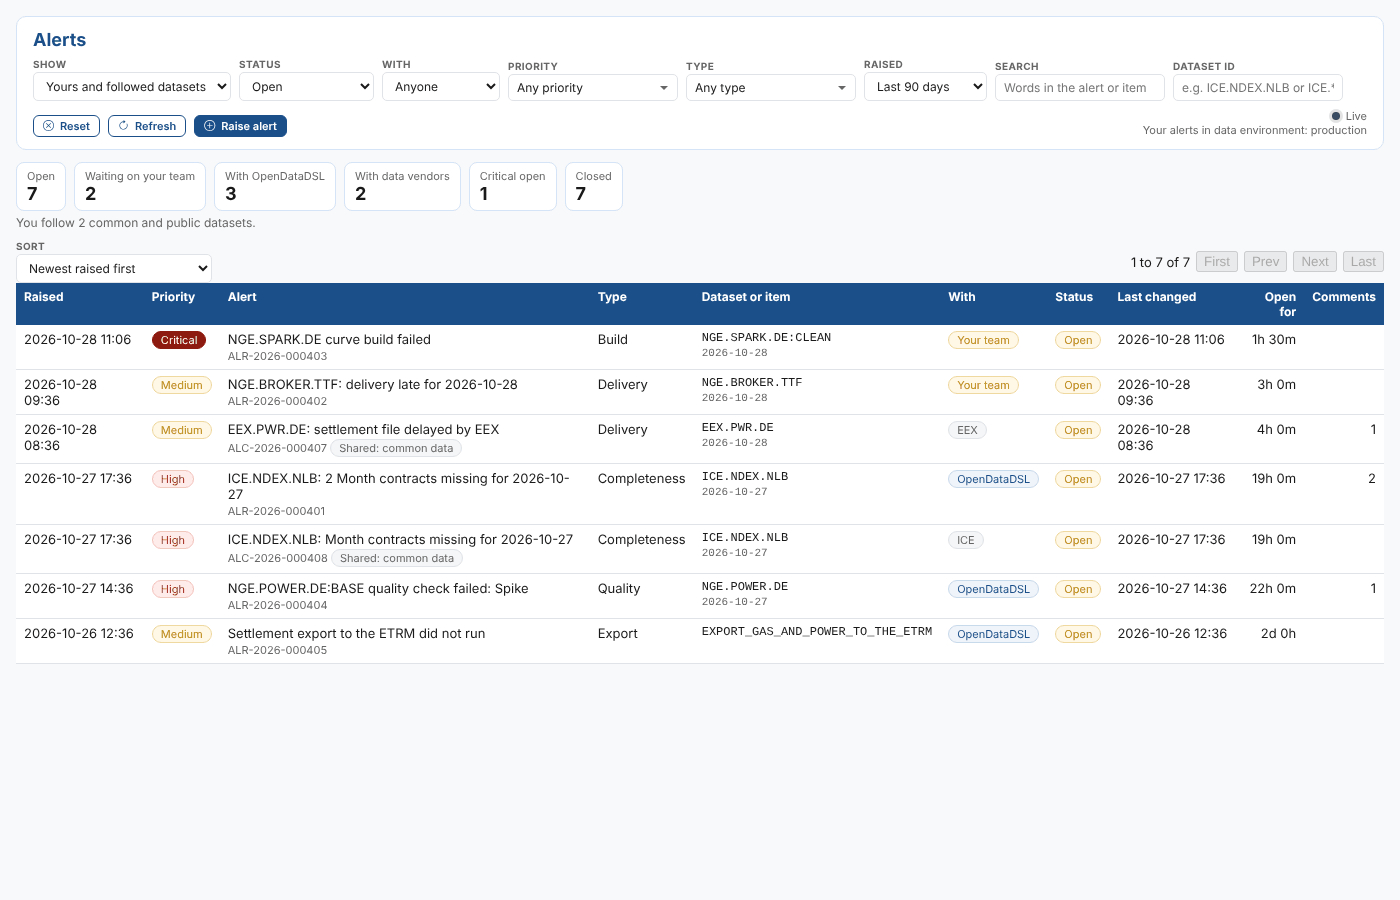
Alerts
See the alerts your team is concerned about, from your own data and the shared data you follow, and comment on, raise, hand over, close and reopen them in the portal, ODSL, Python or the REST API.
Read the guide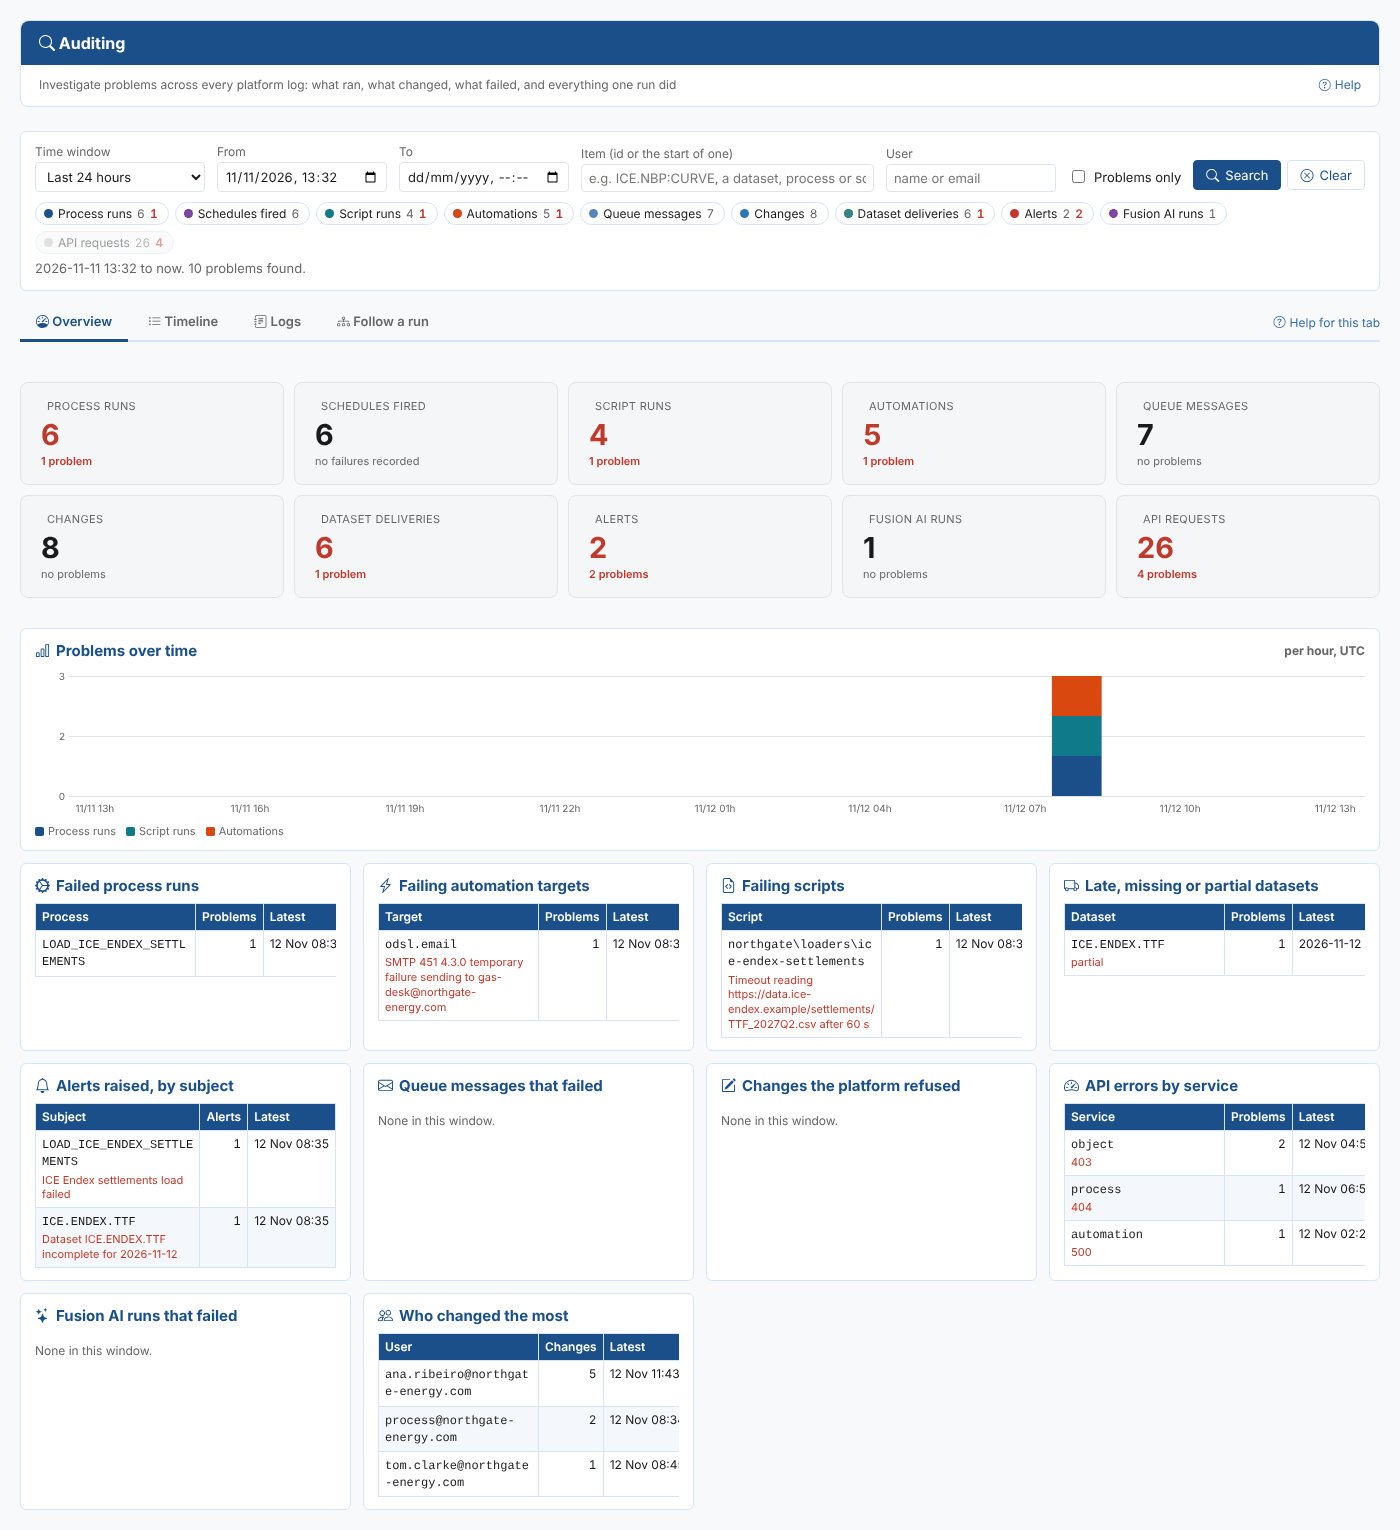
Auditing
Investigate problems using every platform log in one place: process runs, schedules, scripts, automations, queue messages, changes, dataset deliveries, alerts, Fusion AI runs and API requests, and follow one run through all of them.
Read the guide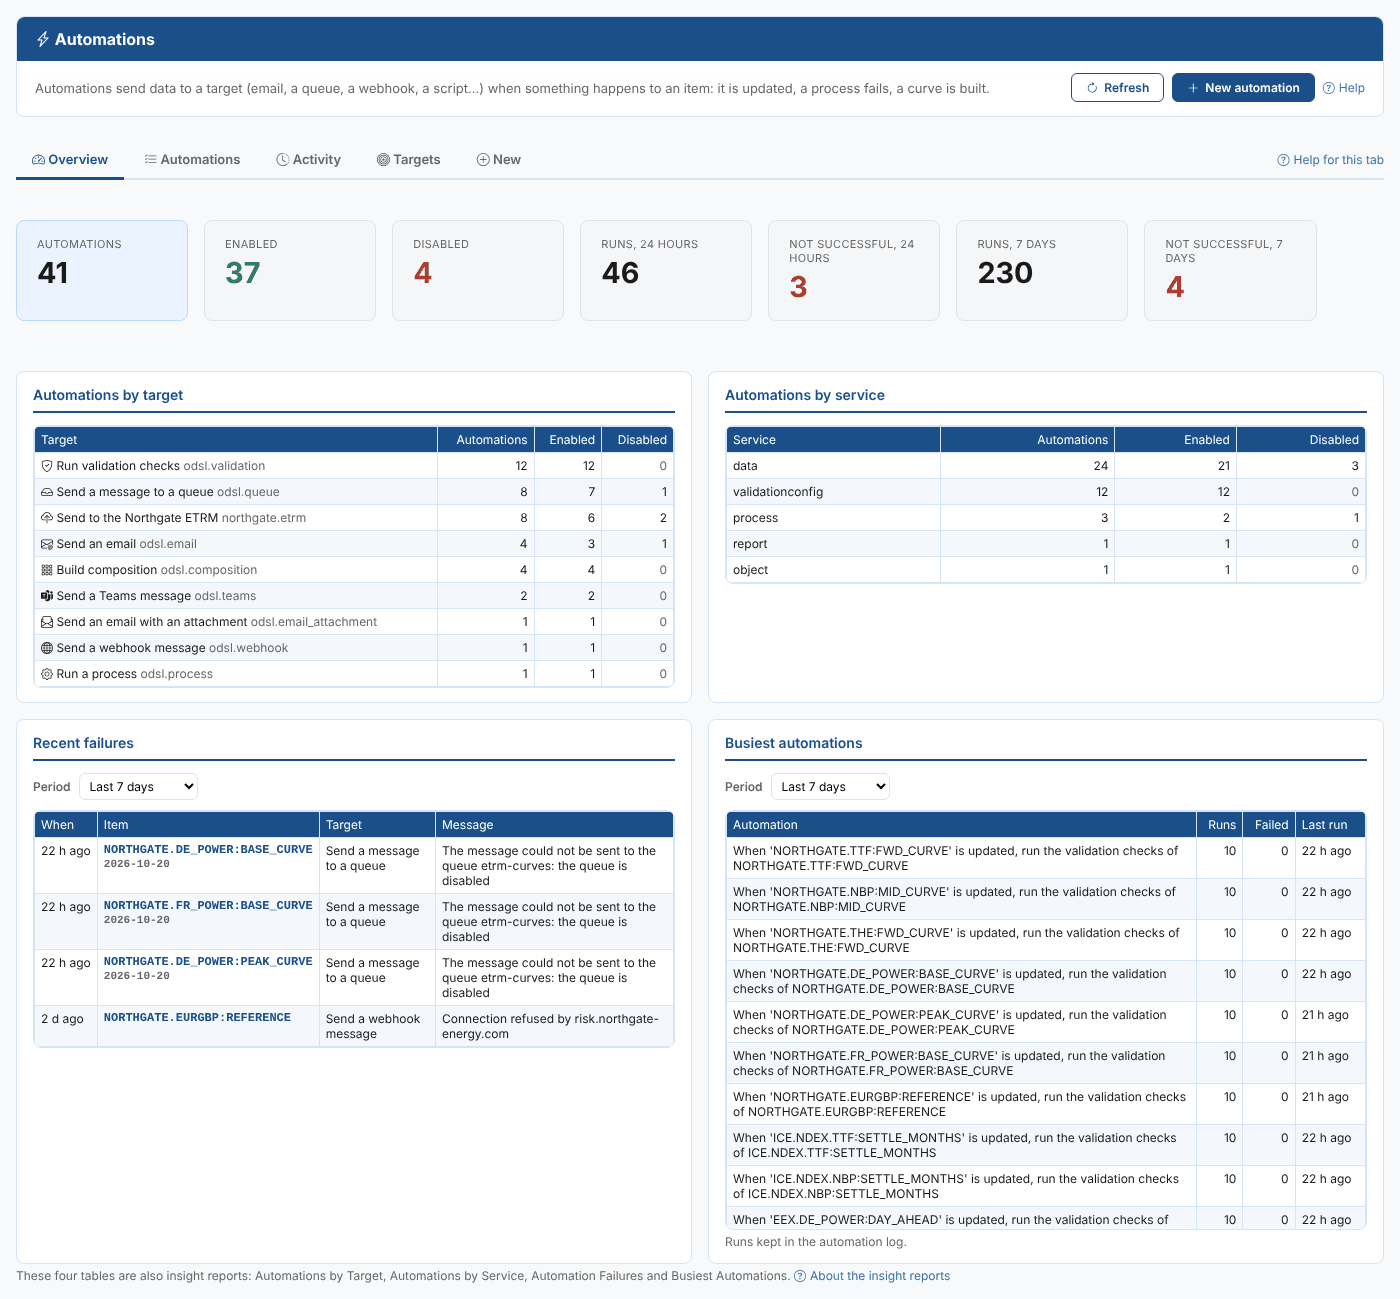
Automations
See every automation your company has in one place, find out which ones are failing, switch them on and off, change and test them, and create new ones for any item.
Read the guide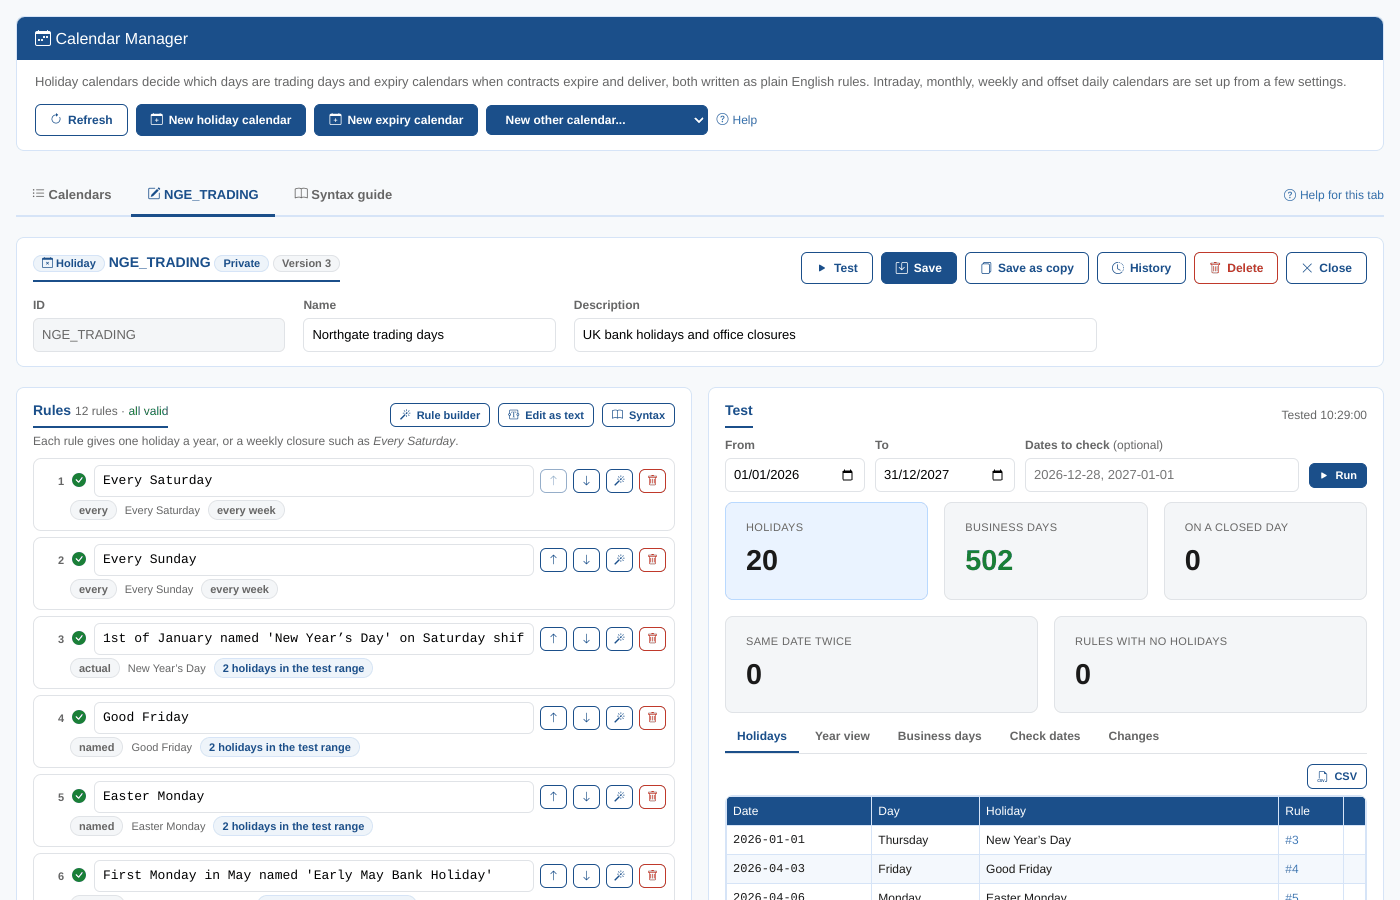
Calendar Manager
Create, edit and test holiday calendars and expiry calendars written as plain English rules, checked against the rule grammar as you type, with calendar insight reports.
Read the guide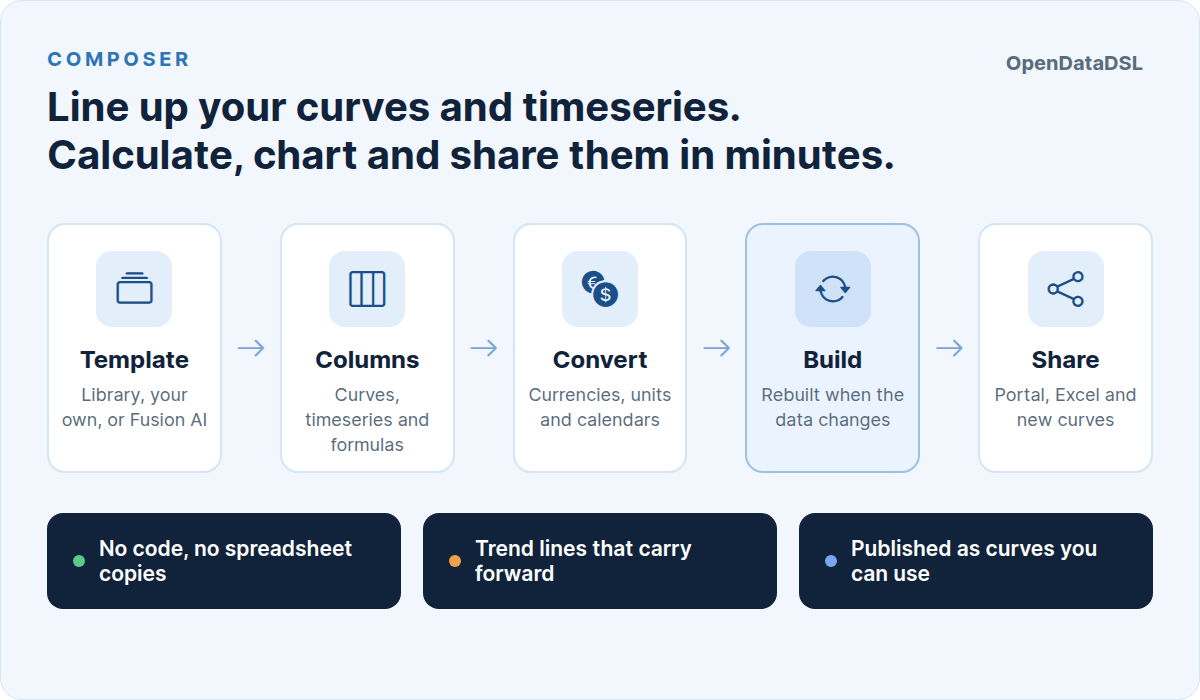
Composer
Build your own analytic worksheets of curves and timeseries, called compositions, from ready-made templates or from scratch, and use them in the portal, in Excel, as curves and in automations.
Read the guide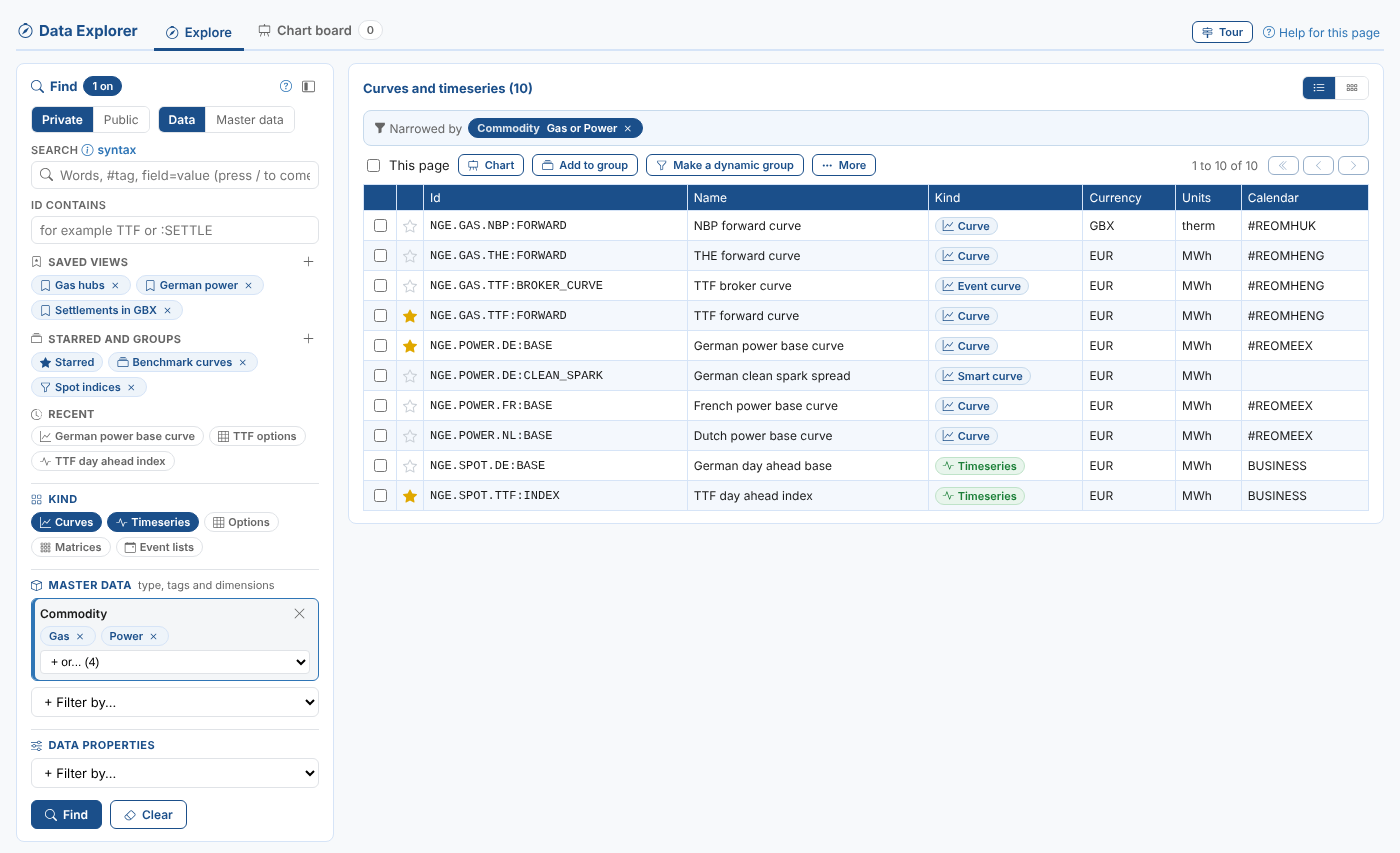
Data Explorer
Find, look at, chart and compare your master data, curves, timeseries and options in one screen, with the tabs and actions other extensions add.
Read the guide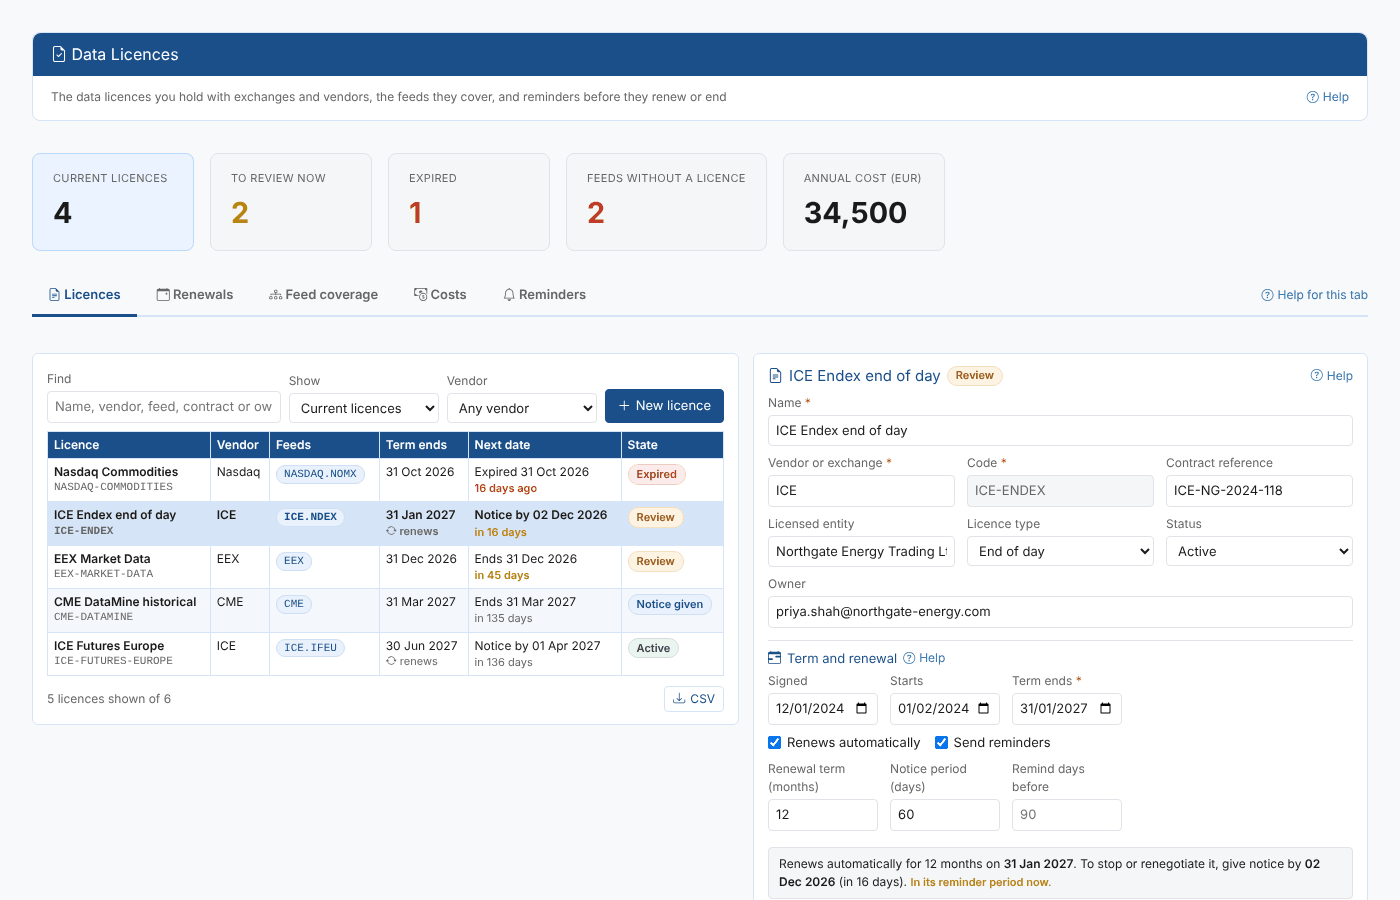
Data Licences
Keep the data licences you hold with exchanges and vendors in one place, see which of your datasets each one covers, and get reminders before a licence renews or ends.
Read the guide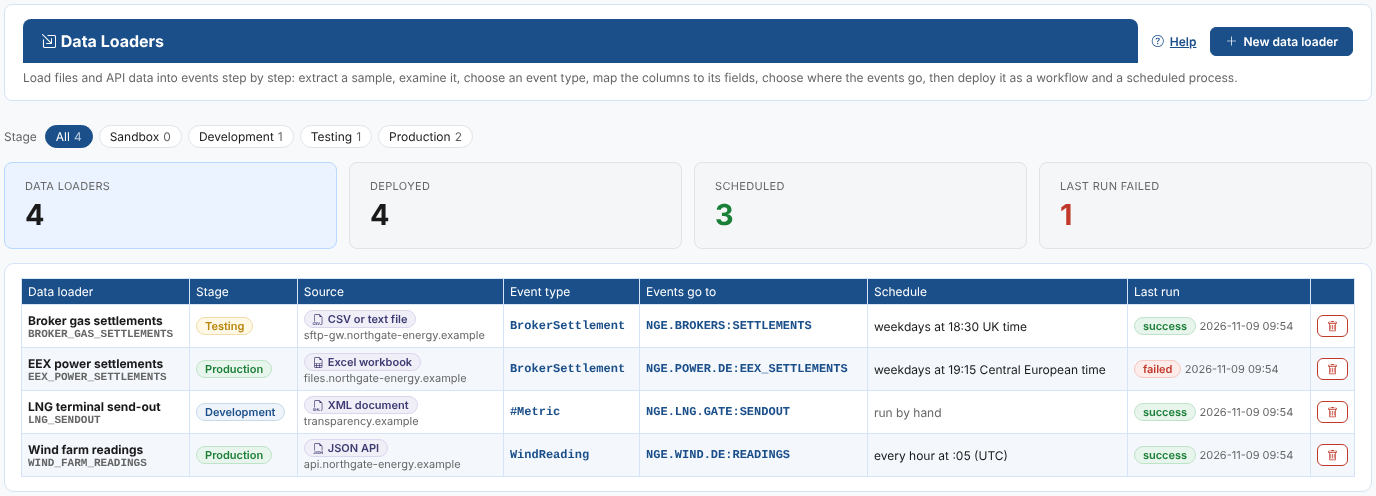
Data Loaders
Build data loaders step by step that extract CSV files, JSON APIs, XML documents and Excel workbooks, map their columns to the fields of an event type, and load them as events on a schedule.
Read the guide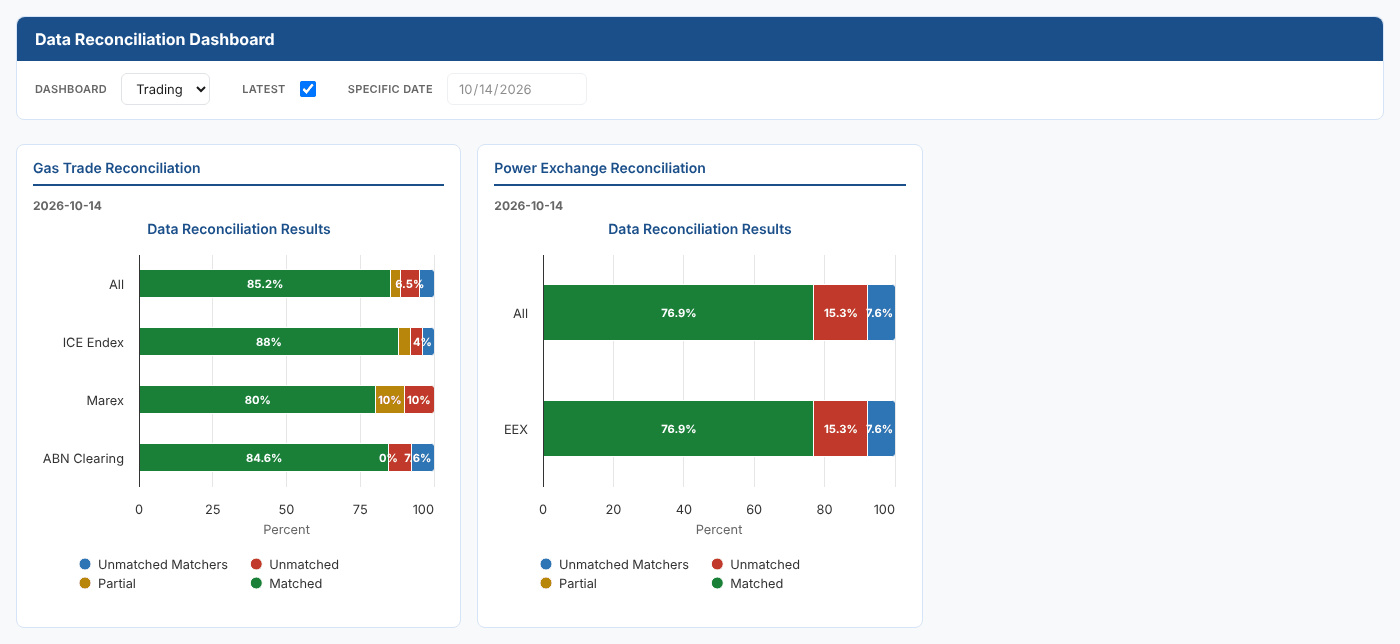
Data Reconciliation
Reconcile the trades in your ETRM system with the trade records of exchanges, brokers and clearing banks, see the breaks on a dashboard and resolve them.
Read the guide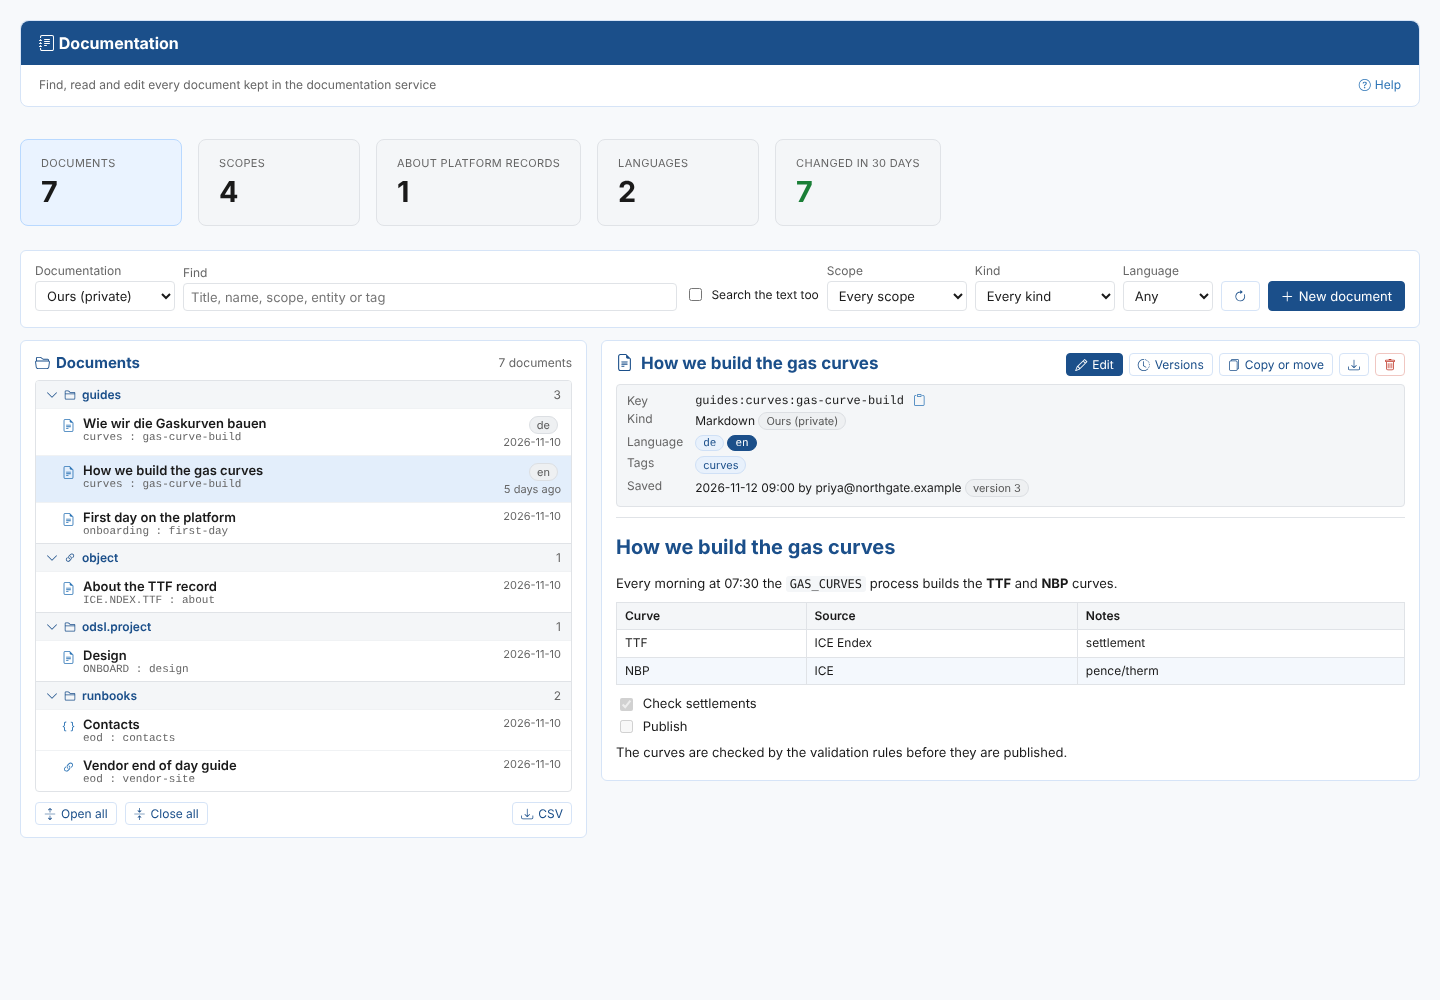
Documentation Manager
Find, read and edit all the documentation kept on the platform: the documents about your records, data, projects and integrations, and your own guides, notes and runbooks.
Read the guide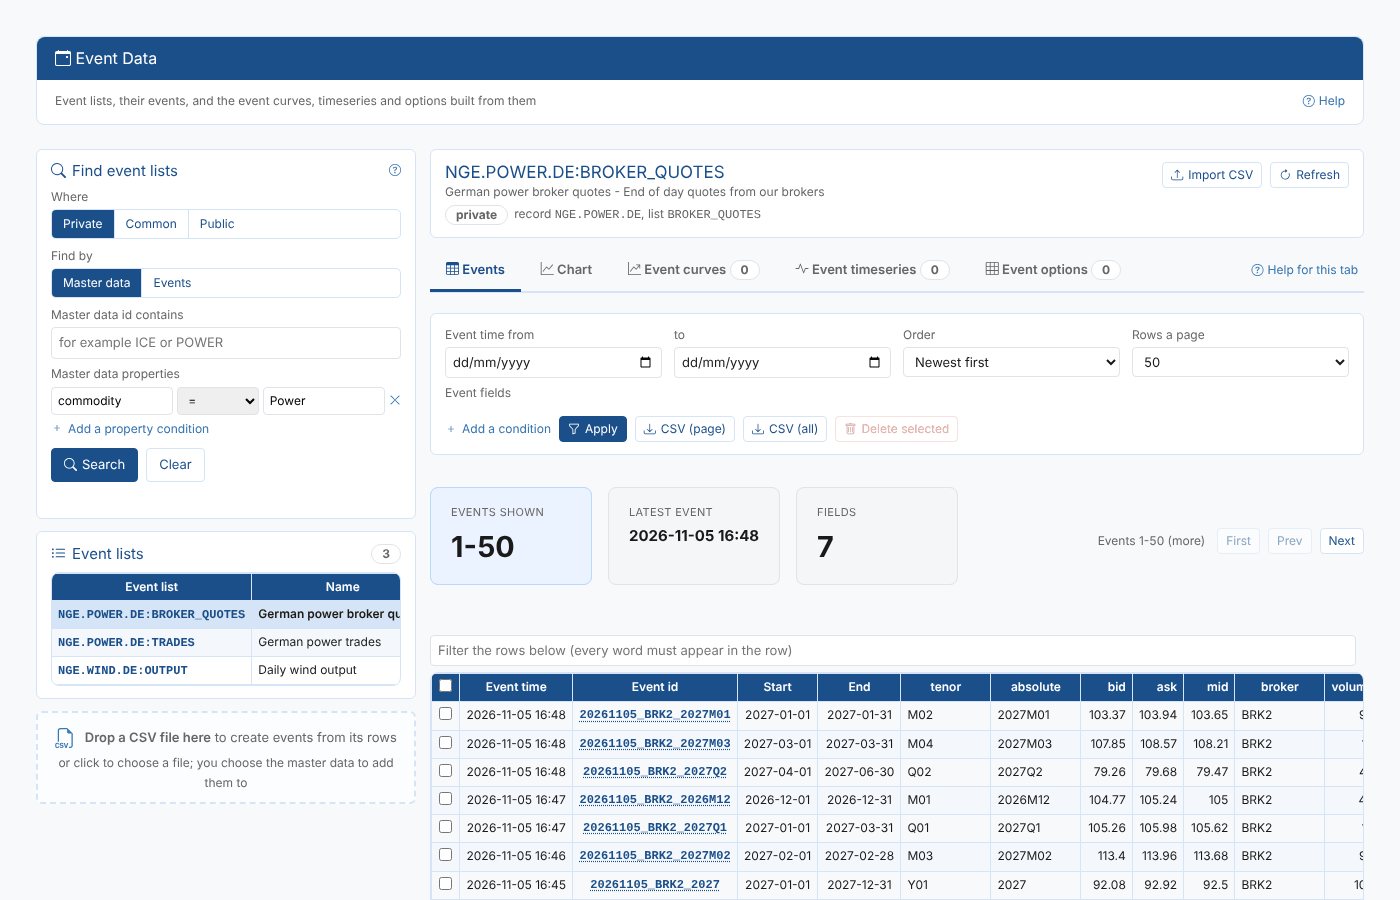
Event Data
Find event lists in private, common and public data, view, filter, export and chart their events, import events from CSV files, and build event curves, event timeseries and option chains from them.
Read the guide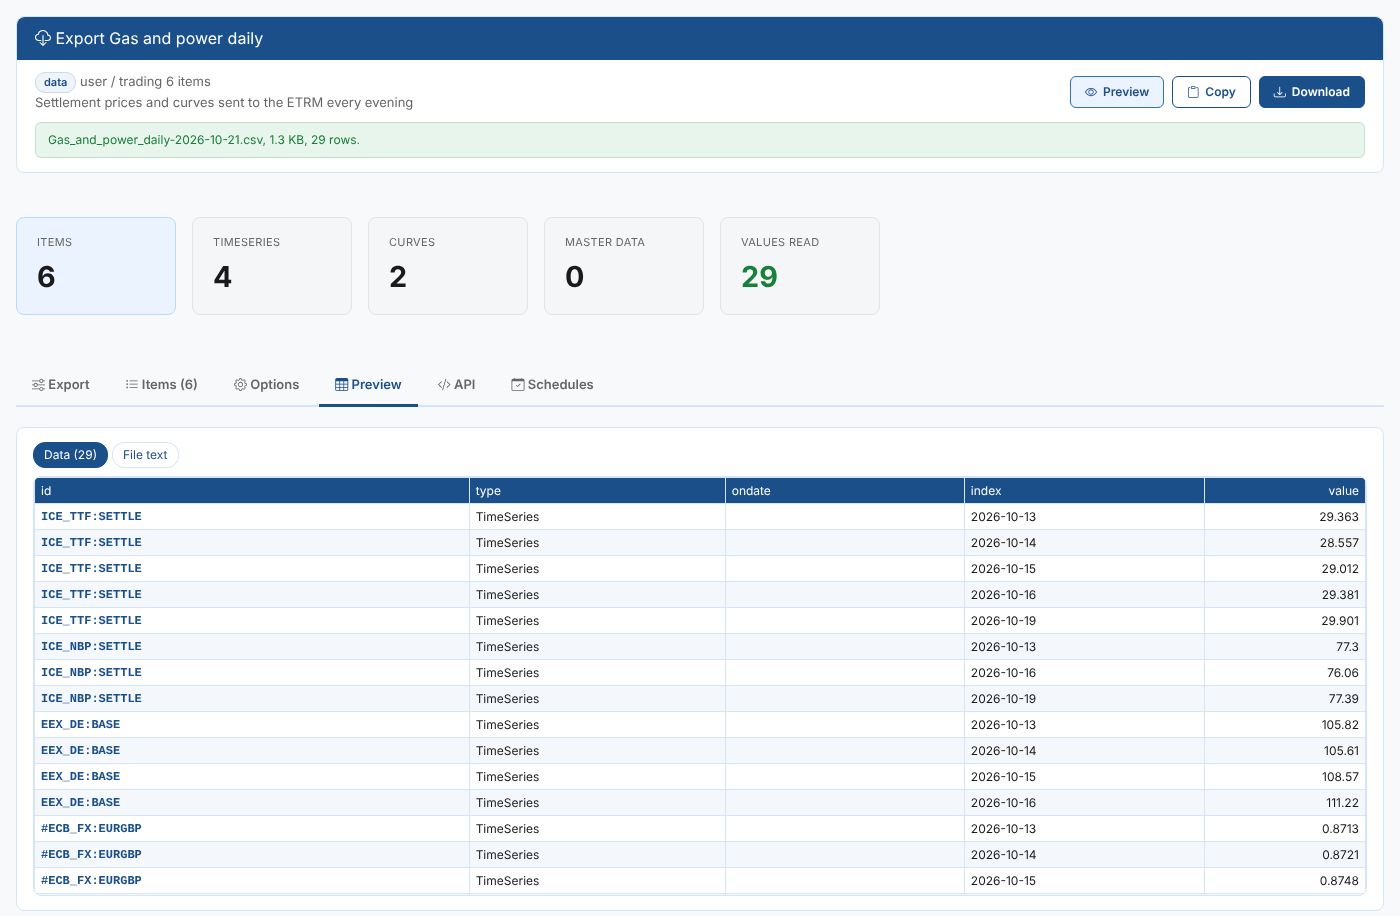
Export
Export timeseries, curves and master data in the format another system needs, straight away or on a schedule that handles missing data and delivers each export by email, queue, webhook or any other automation target.
Read the guide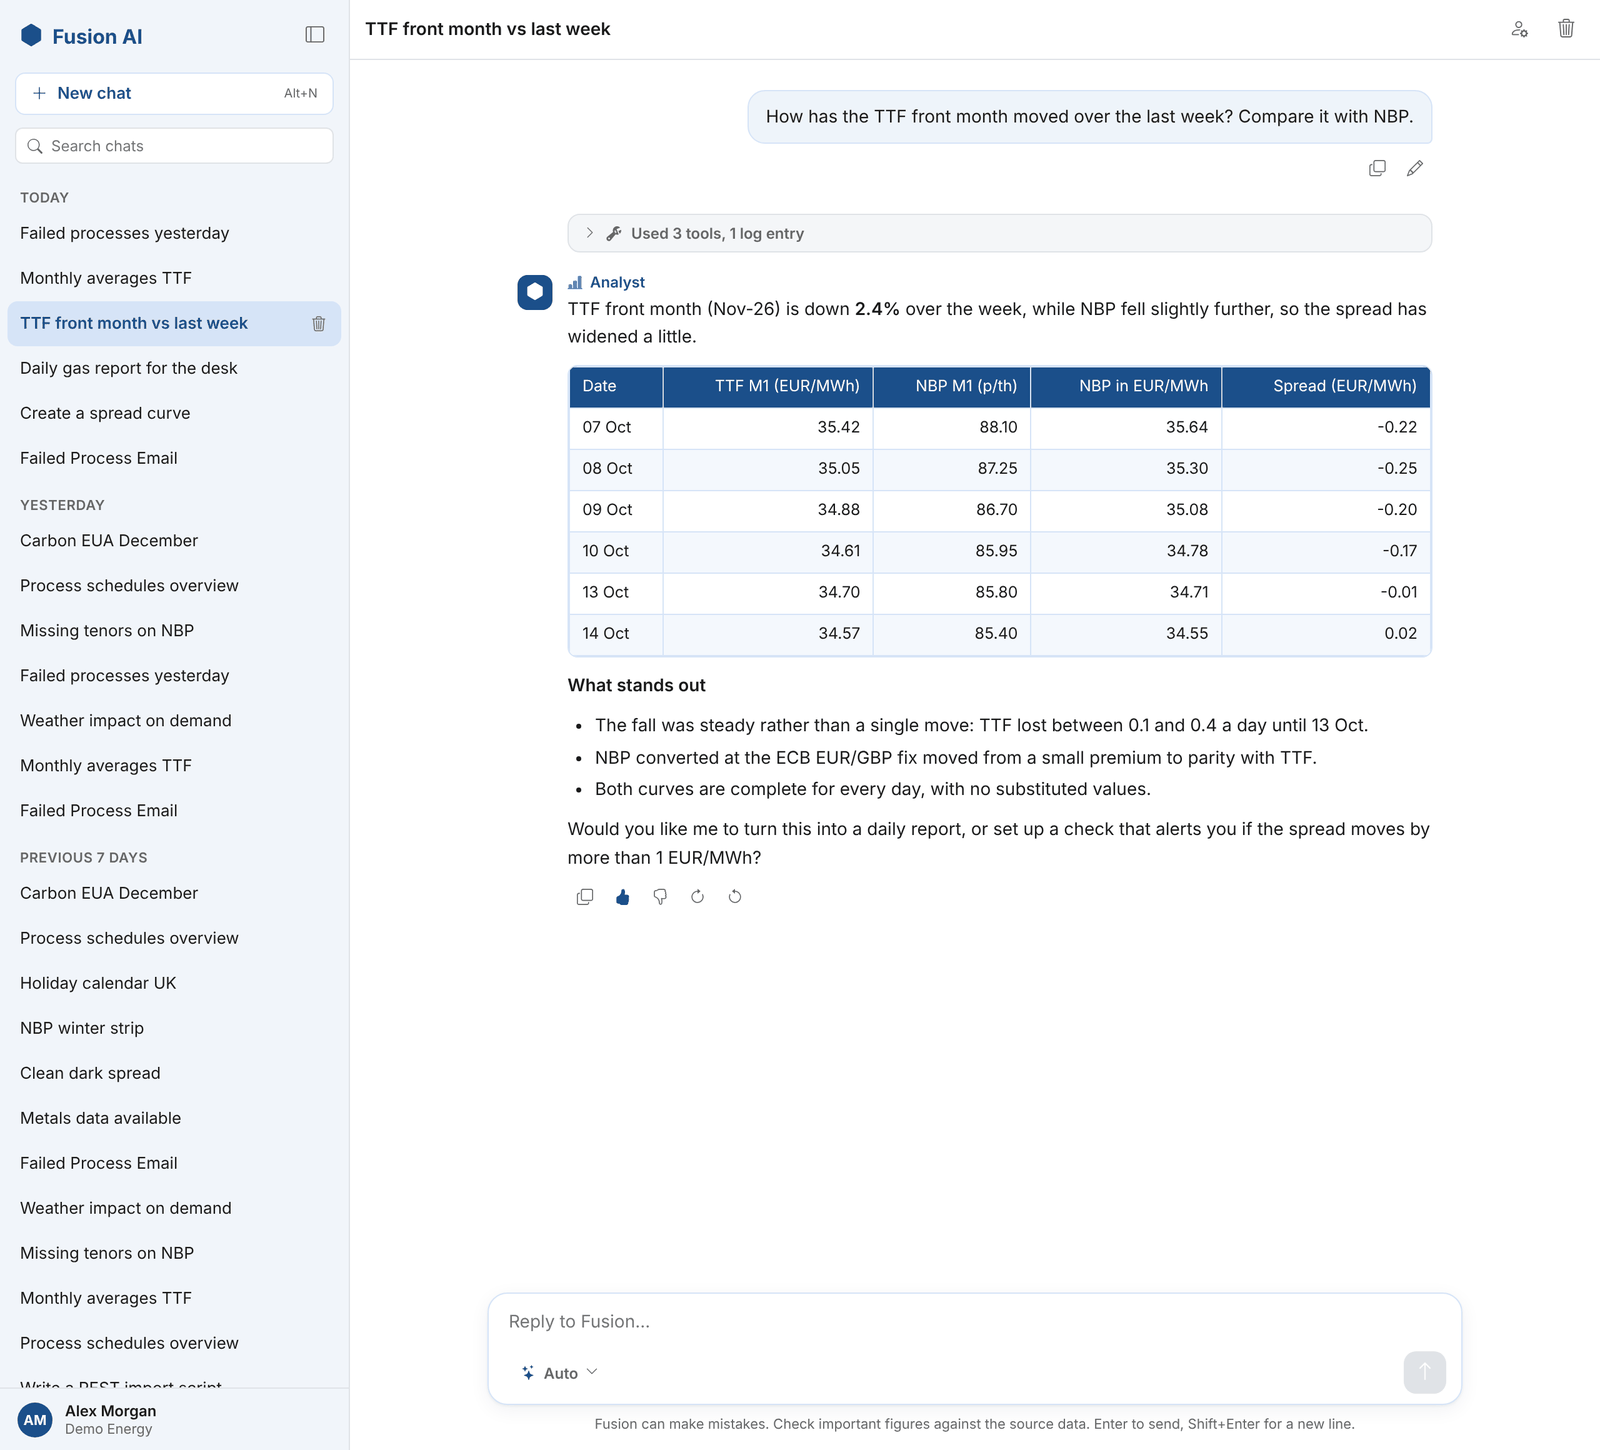
Fusion AI
Fusion AI, the OpenDataDSL AI assistant: chat with your platform data in Studio, configure assistants, agents and custom tools, run governed playbooks as tasks, and follow usage, feedback and billing in the insights.
Read the guide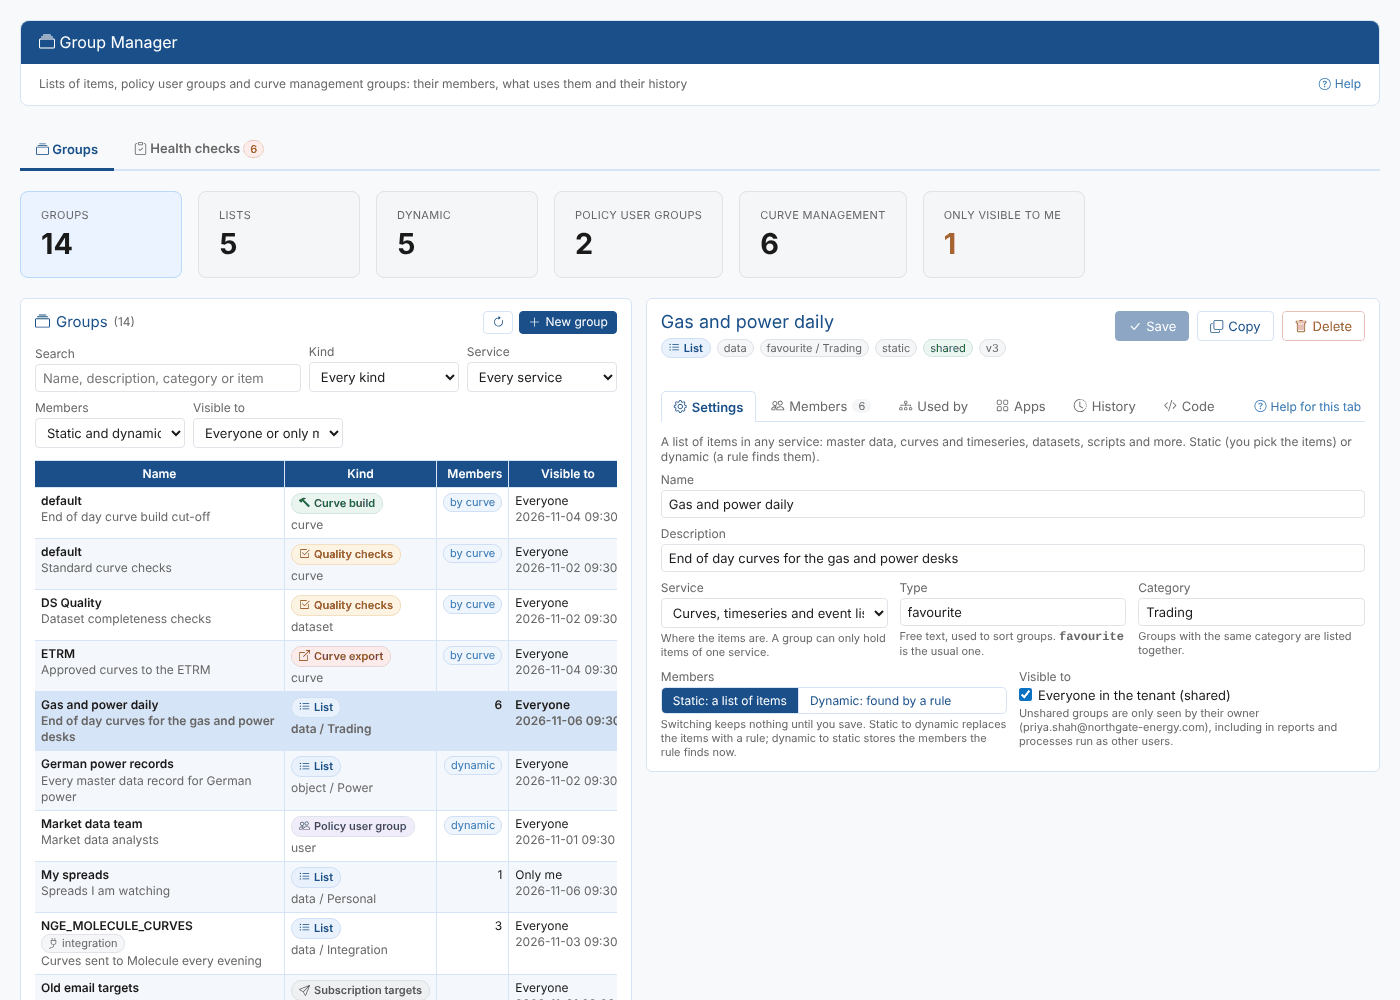
Group Manager
Manage every kind of group in one place: lists of data and master data, policy user groups and the curve build, quality, approval and export groups, with their members, what uses them, their history and health checks.
Read the guide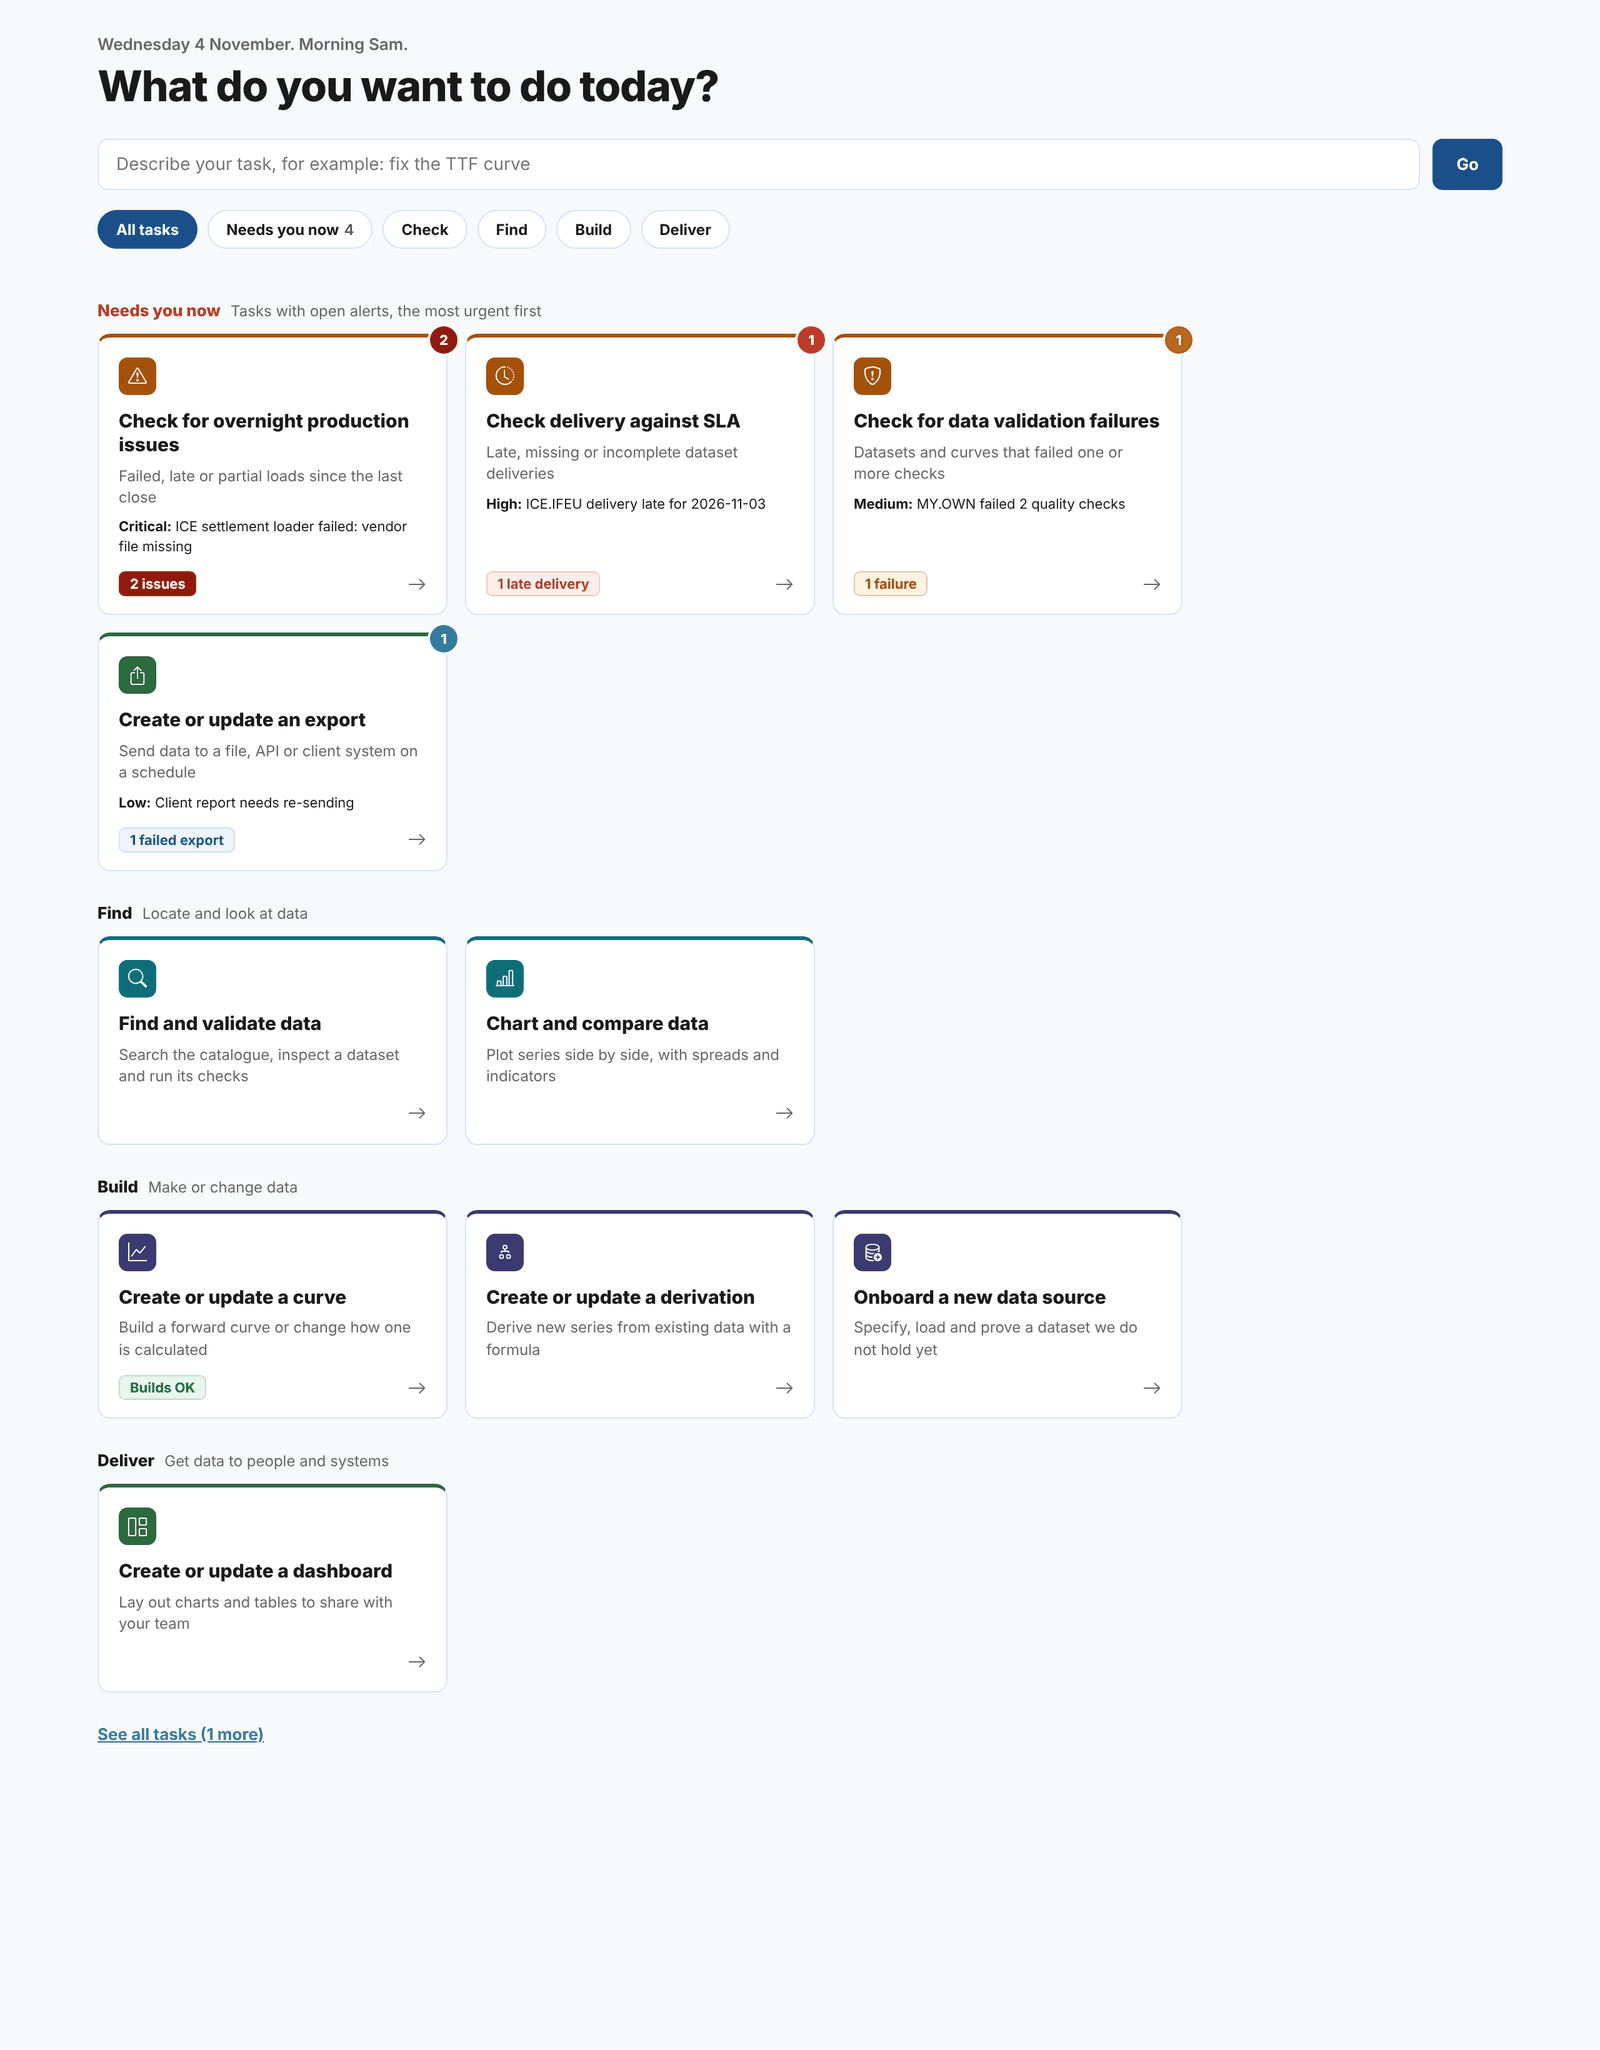
Home
The portal home page that starts from the work: what do you want to do today? Task tiles from your installed extensions, with the tasks that have open alerts first.
Read the guide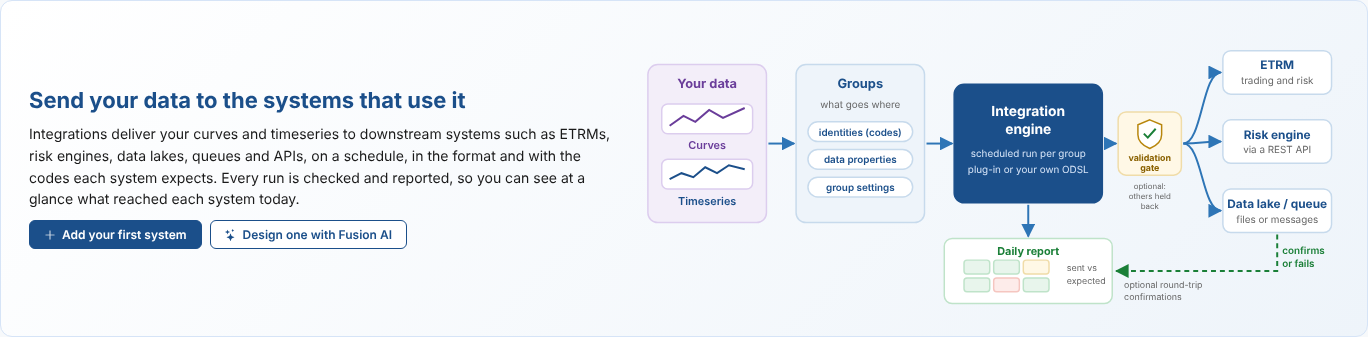
Integration
Send curves and timeseries to the systems downstream of the platform, such as an ETRM, a risk engine or a data lake, on a schedule, with each system's codes and settings, and a daily report of what was sent against what you expect.
Read the guide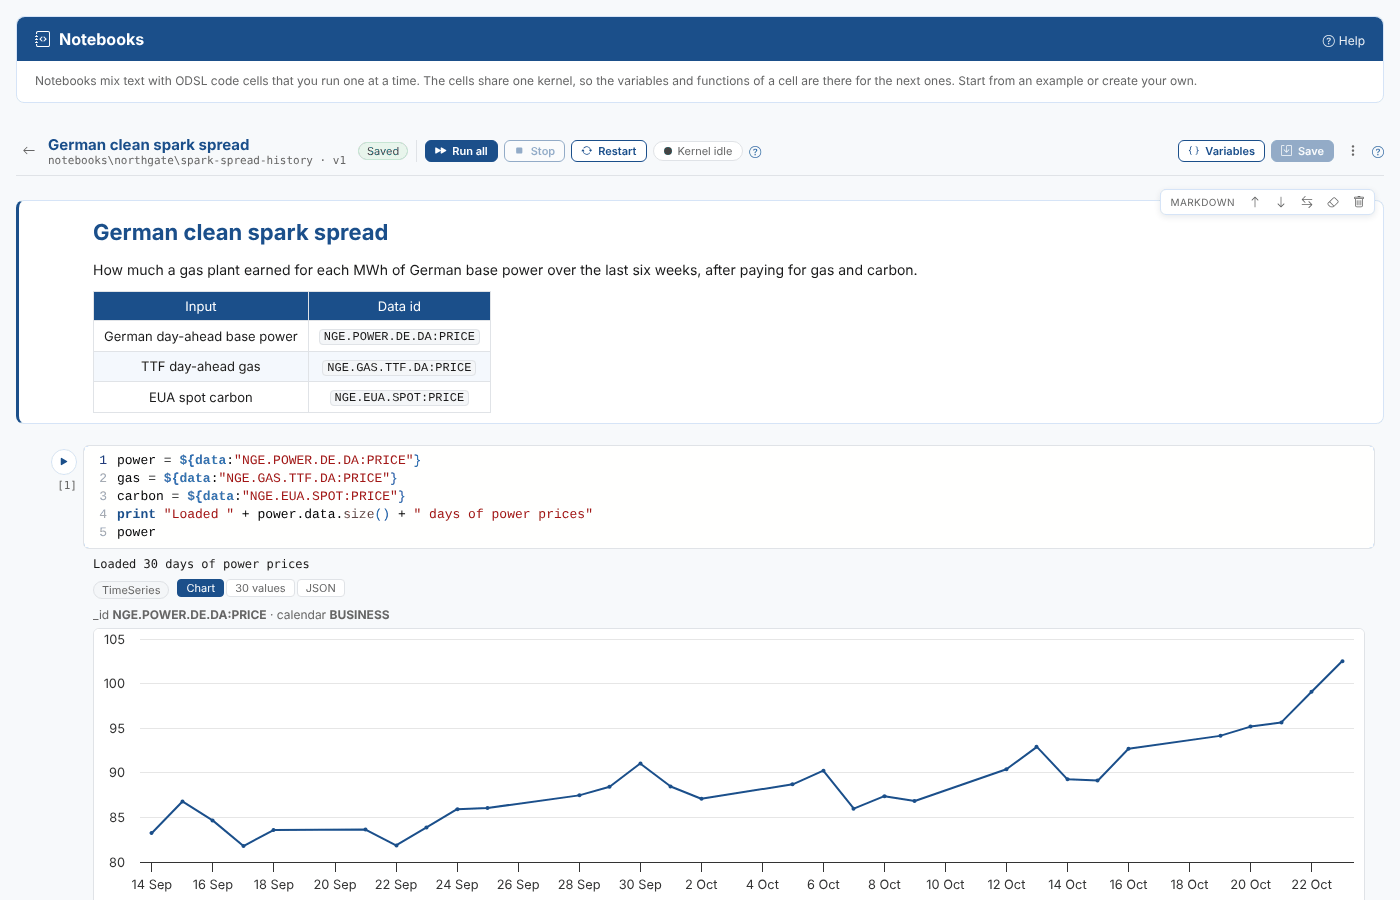
Notebooks
Work with ODSL the way you would in a Python notebook: text and code cells that you run one at a time, with the values shown as tables and charts, and example notebooks to start from.
Read the guide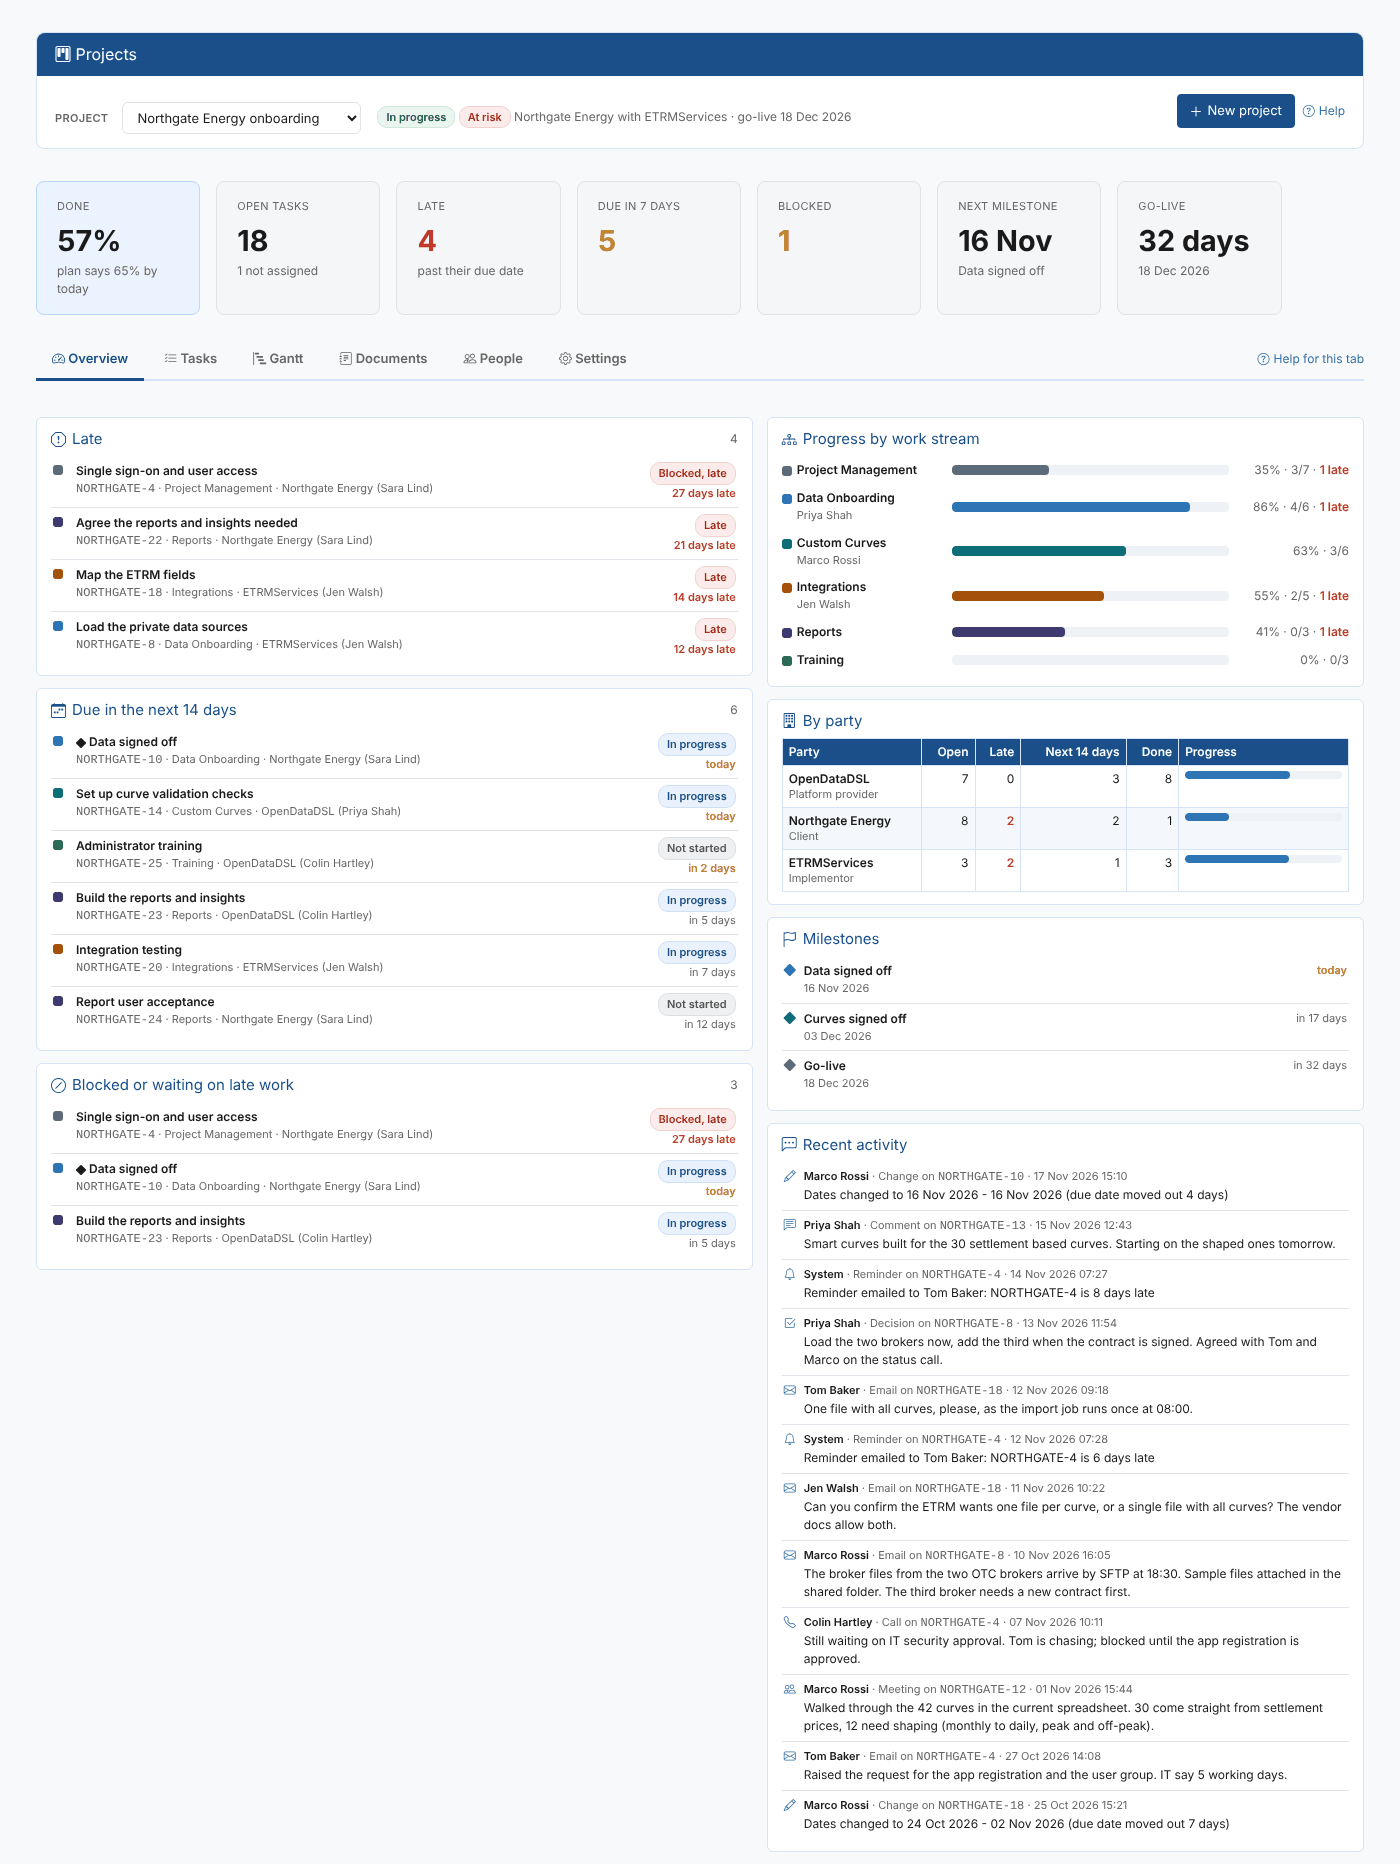
Projects
Plan and track client onboarding projects shared between OpenDataDSL, the client and the implementor: tasks by work stream, a Gantt chart, the communication on each task, reminders and project documents.
Read the guide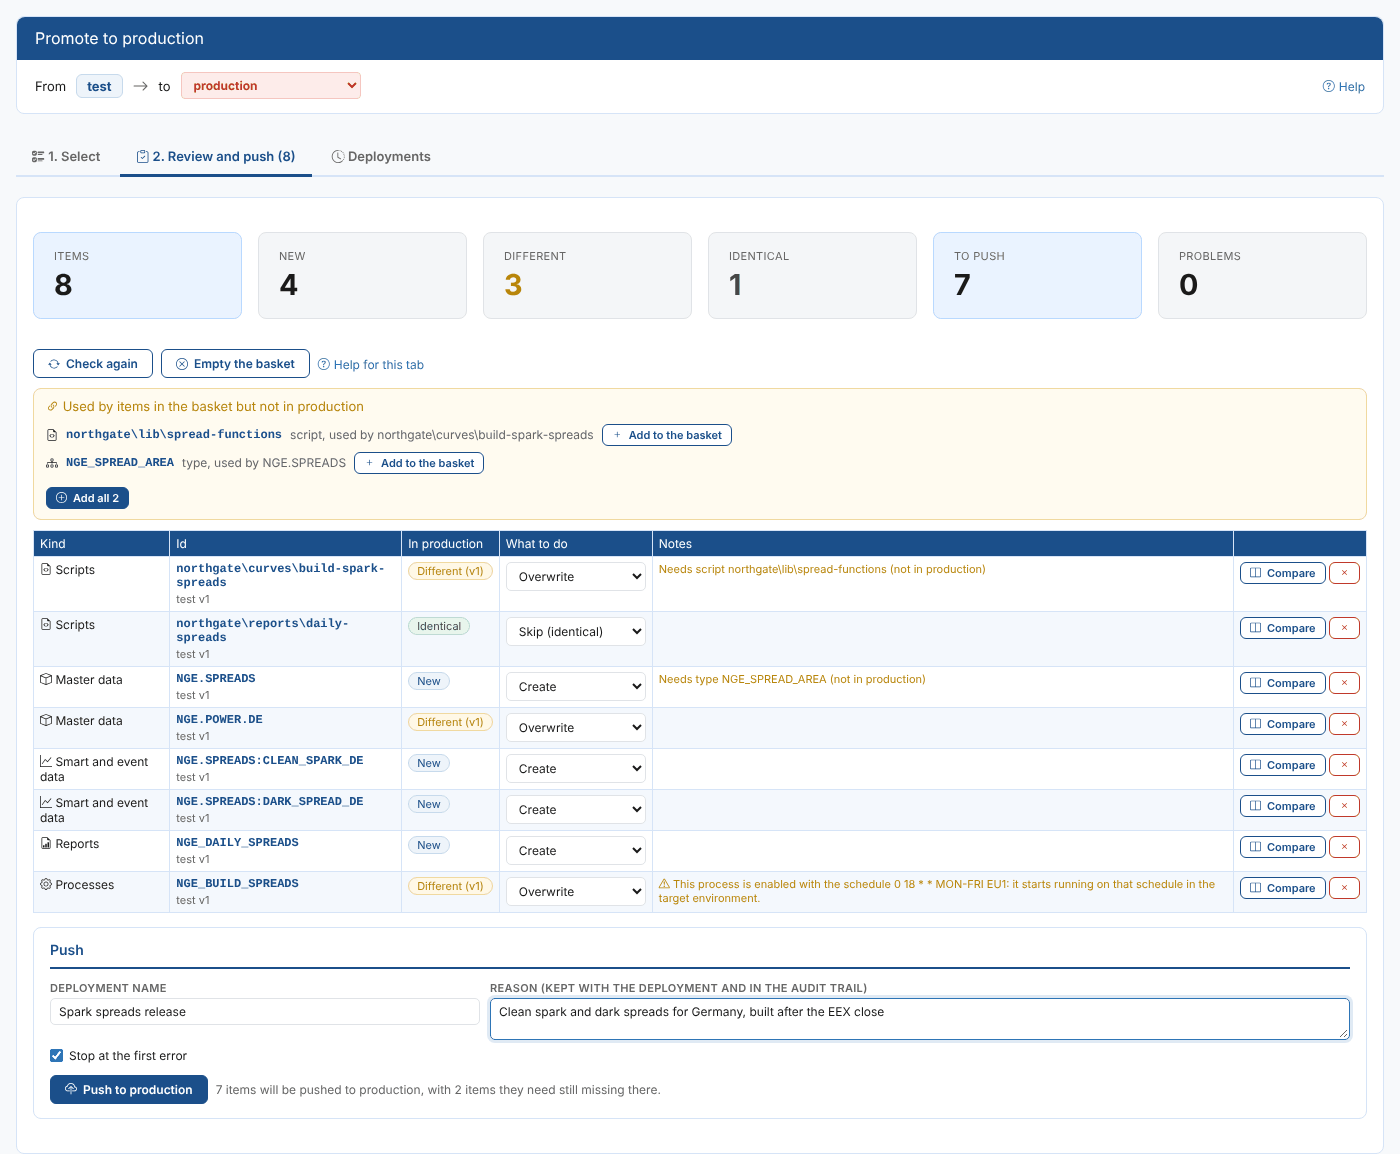
Promotion
Promote master data, smart data, types, calendars, scripts, reports, processes and other items from a test environment to production, see what changes before you push, and undo a deployment to put production back as it was.
Read the guide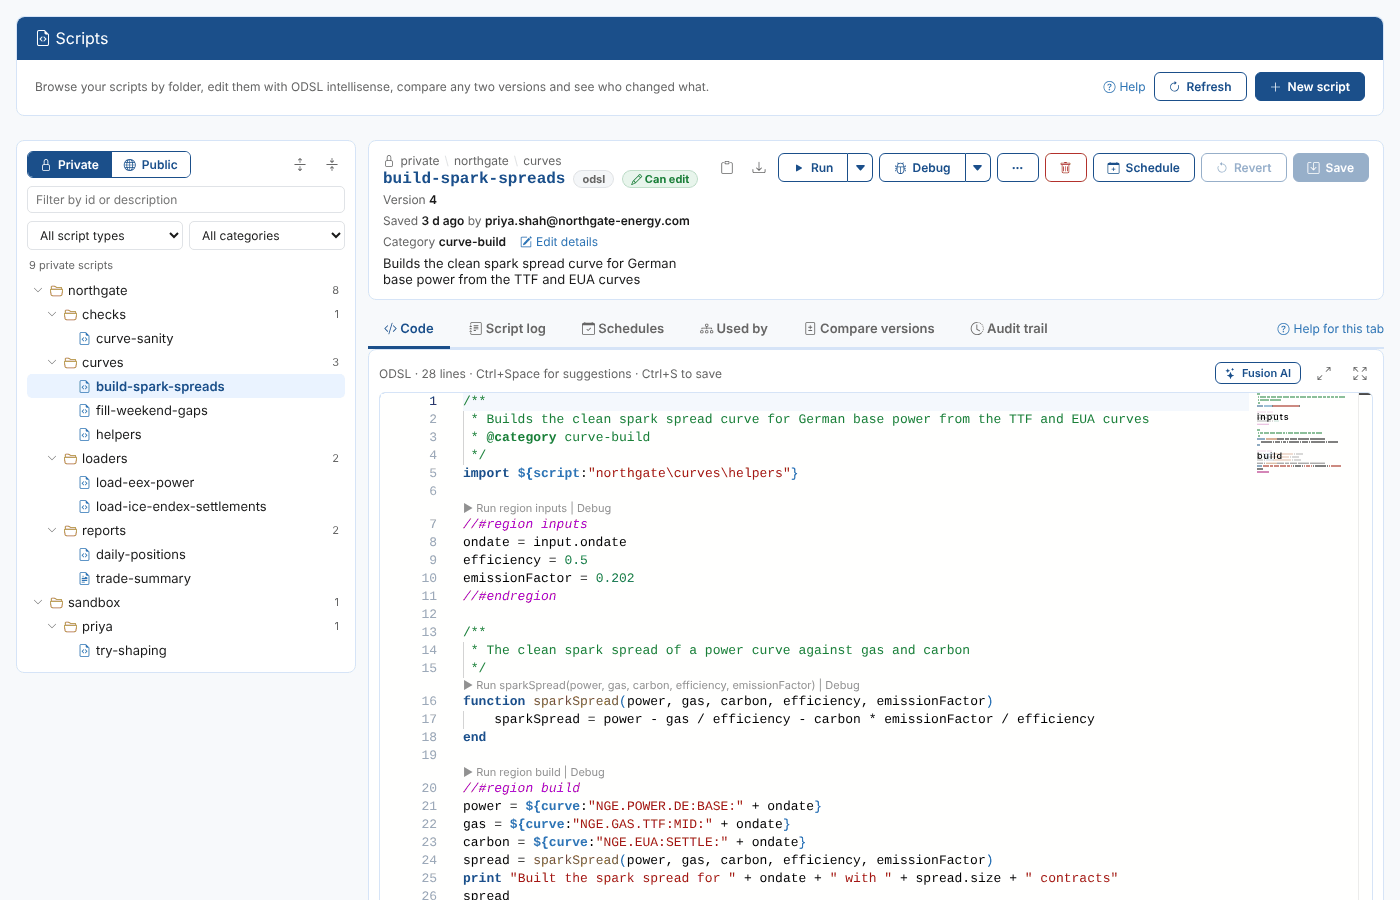
Script Manager
Browse your ODSL scripts and templates by folder, edit them with intellisense, run them, schedule them, write them with Fusion AI, compare versions and see who changed what and why.
Read the guide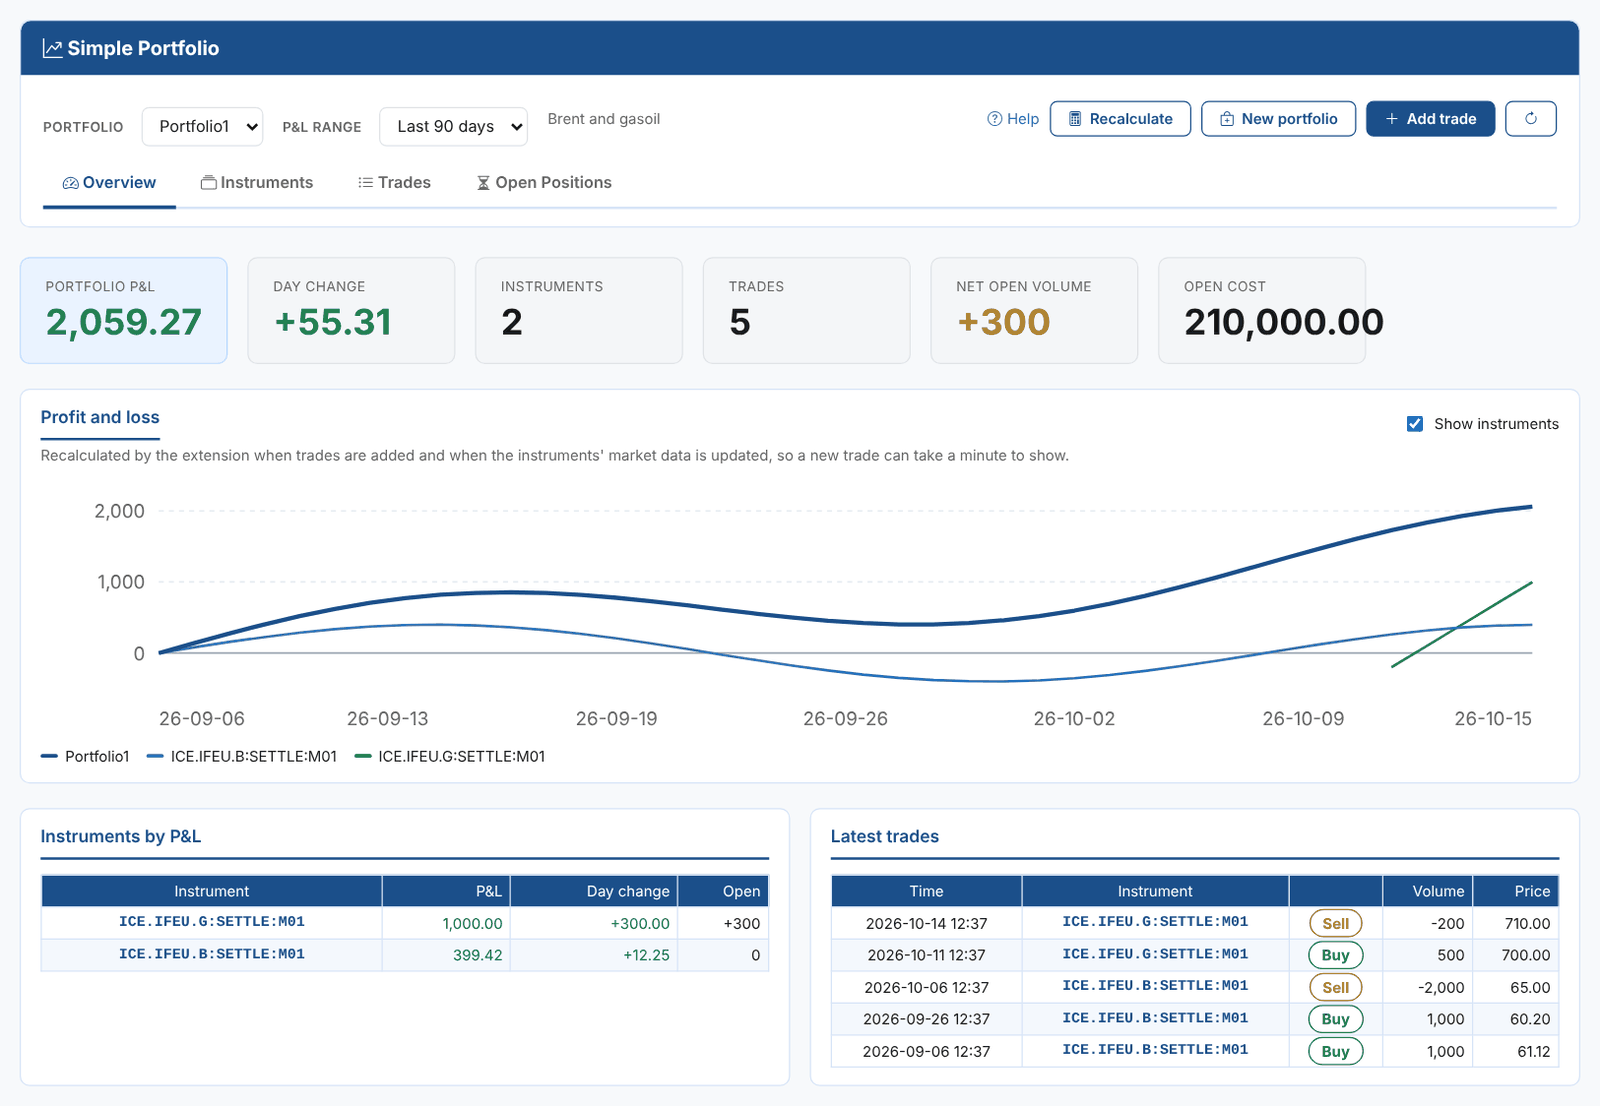
Simple Portfolio
Group the instruments you trade into portfolios, record trades against them and follow each portfolio's profit and loss and open positions, kept up to date by automations.
Read the guide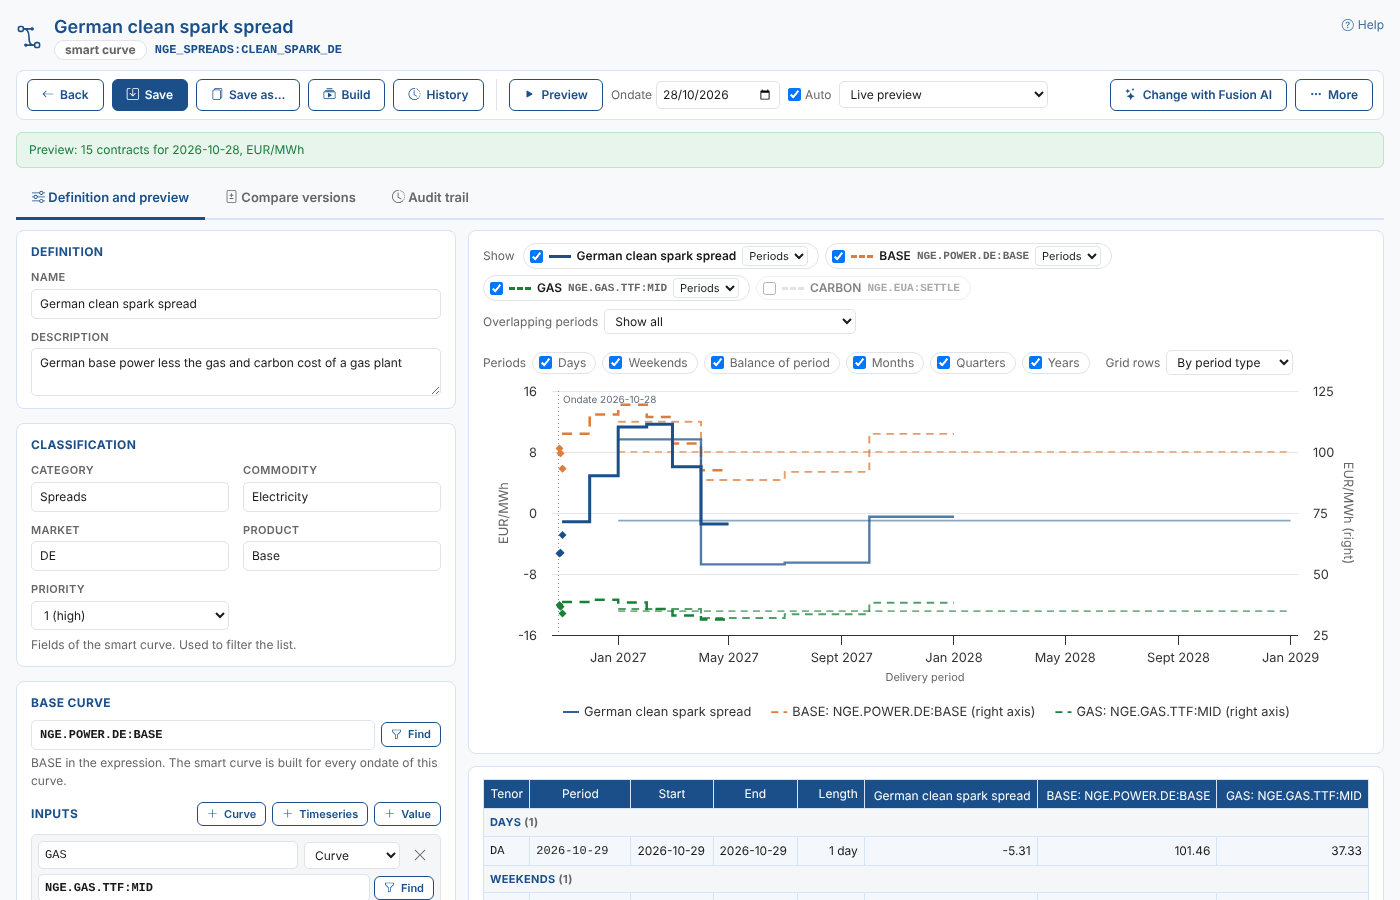
Smart Data
Create, preview, build and track smart curves and smart timeseries: data calculated from a base curve or timeseries and other inputs with an ODSL expression, from a library of examples or with Fusion AI.
Read the guide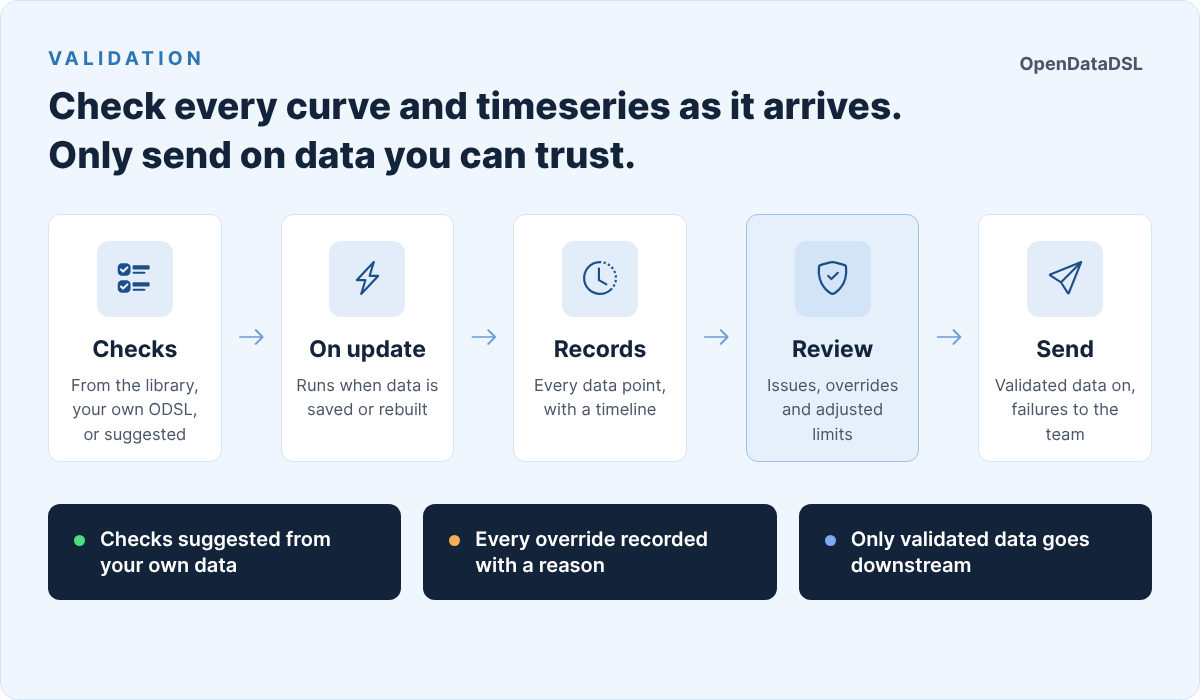
Validation
Check your curves and timeseries with validation checks written in ODSL, keep a record of every result, review and override failures, and follow data quality on a dashboard.
Read the guide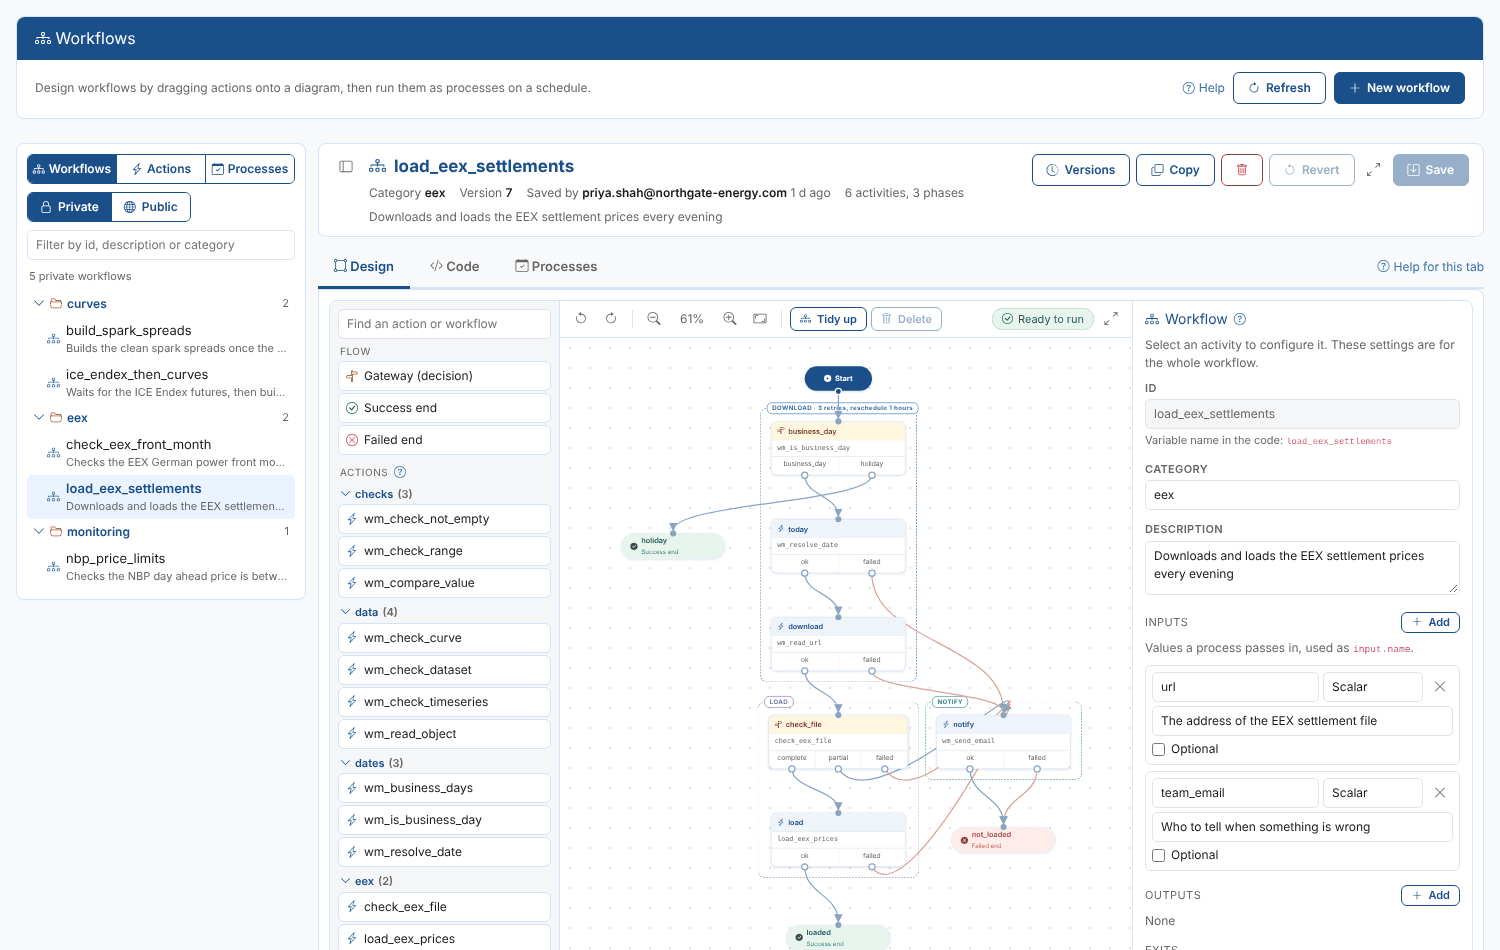
Workflow Manager
Design workflows by dragging actions onto a diagram and configuring them, with the ODSL code kept in step, then create, schedule and run the processes that run them.
Read the guideBuilding your own
The extensions above are built in exactly the same way as the ones you can build yourself, with a Fusion AI playbook or by hand. Your extension can have its own menu item in any group, add tabs to Data Explorer and add tasks to the Home page. See How extensions work to get started.