The menu
The portal menu has two parts: the rail, a dark strip down the left with a button for each menu group, and the panel beside it, which lists the items in the group you select.
The rail and the panel
Select a group on the rail to show its items in the panel. Each item has an icon, its name and a short description of what it is for. Select an item to open it.
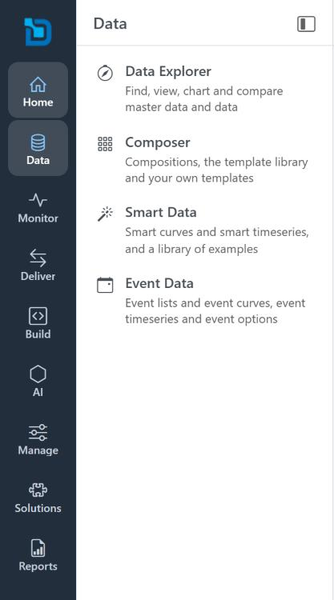
- Home at the top of the rail opens your Home page.
- The OpenDataDSL logo opens the OpenDataDSL website.
- When you open a screen, the rail and panel move to the group that screen belongs to, so you can always see where you are.
- A group lists only what you have: an item is missing if its extension is not installed for your organisation, or you do not have access to it.
Keeping the panel open, or the rail only
Select Panel at the bottom of the rail to switch between the two layouts. The portal remembers your choice.
| Layout | How it works |
|---|---|
| Panel open | The panel stays open beside the page. Select another group to change what it lists. Select the panel button at its top right to switch to the rail only. |
| Rail only | The page uses the full width. Select a group to open the panel over the page; it closes when you open an item, select the same group again, select outside it or press Escape. |
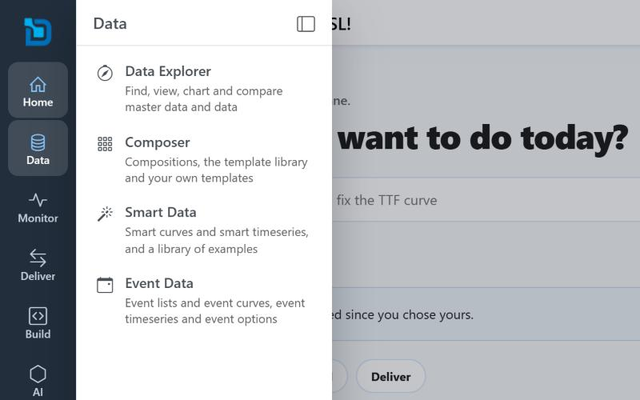
You can also choose the layout, and put the menu on the right instead of the left, in Settings.
Data
| Item | What it is for | Guide |
|---|---|---|
| Data Explorer | Find, view, chart and compare master data and data, and see where master data is on a map | Data Explorer |
| Composer | Build curves and timeseries from other data with compositions and templates | Composer |
| Smart Data | Smart curves and smart timeseries, calculated when you read them | Smart Data |
| Event Data | Event lists, and the event curves, timeseries and options made from them | Event Data |
Monitor
| Item | What it is for | Guide |
|---|---|---|
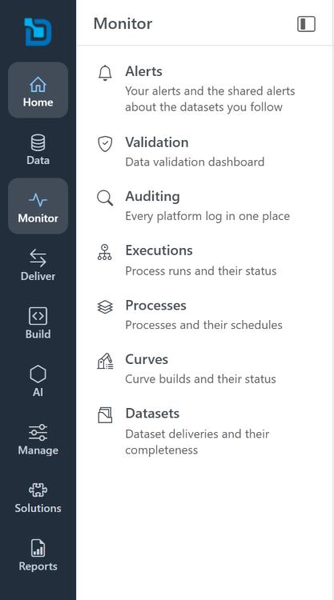
| Alerts | Your alerts and the shared alerts about the datasets you follow | Alerts |
| Validation | The data validation dashboard, its issues and the checks behind them | Validation |
| Auditing | Every platform log in one place | Auditing |
| Executions | Process runs and their status | Executions |
| Processes | Processes and their schedules | Processes |
| Curves | Curve builds and their status | Curve builds |
| Datasets | Dataset deliveries and their completeness | Dataset monitoring |
Deliver
| Item | What it is for | Guide |
|---|---|---|
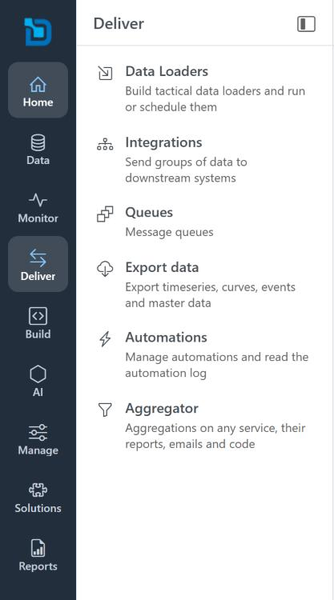
| Data Loaders | Build data loaders step by step, then run or schedule them | Data Loaders |
| Integrations | Send groups of data to downstream systems | Integrations |
| Queues | Your message queues | Queues |
| Export data | Export timeseries, curves, events and master data | Export data |
| Automations | Manage automations and read the automation log | Automations |
| Aggregator | Aggregations on any service, with their reports, emails and code | Aggregator |
Build
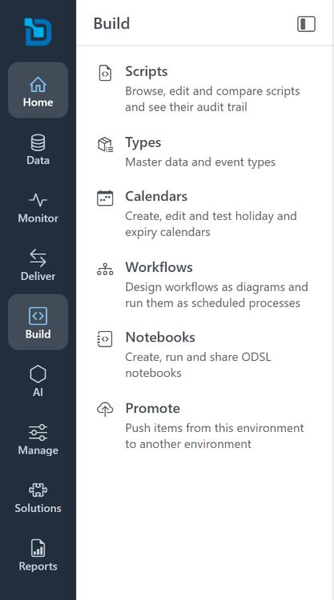
| Item | What it is for | Guide |
|---|---|---|
| Scripts | Browse, edit and compare scripts and see their audit trail | Script Manager |
| Types | Master data and event types | Modelling |
| Calendars | Create, edit and test holiday and expiry calendars | Calendar Manager |
| Workflows | Design workflows as diagrams and run them as scheduled processes | Workflow Manager |
| Notebooks | Create, run and share ODSL notebooks | Notebooks |
| Promote | Push items from this environment to another environment | Promotion |
AI
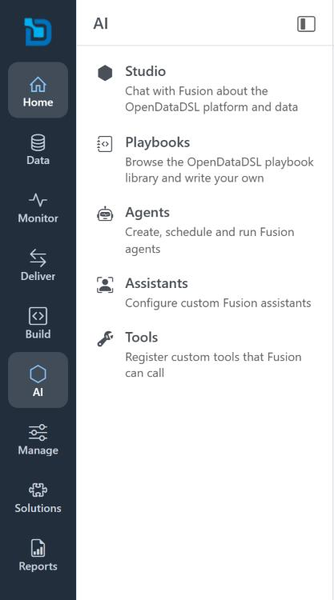
| Item | What it is for | Guide |
|---|---|---|
| Studio | Chat with Fusion about the platform and your data | Studio |
| Playbooks | Browse the playbook library and write your own | Fusion AI |
| Agents | Create, schedule and run Fusion agents | Agents |
| Assistants | Configure your own Fusion assistants | Assistants |
| Tools | Register your own tools for Fusion to call | Tools |
Manage
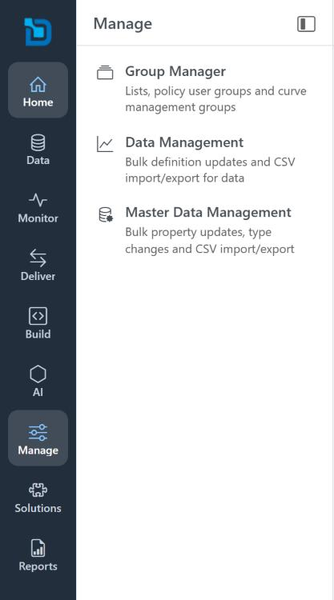
| Item | What it is for | Guide |
|---|---|---|
| Group Manager | Lists, policy user groups and curve management groups | Group Manager |
| Data Management | Bulk definition updates and CSV import and export for data | |
| Master Data Management | Bulk property updates, type changes and CSV import and export for master data |
Solutions
Solutions are extensions for a particular business problem. Your organisation may have its own here, sometimes under a heading of their own.
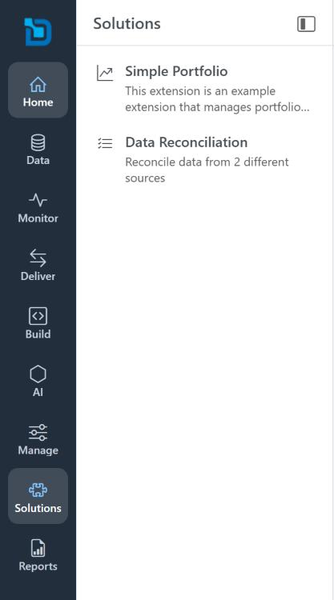
| Item | What it is for | Guide |
|---|---|---|
| Simple Portfolio | An example extension: portfolios of products and trades, with their profit and loss | Simple Portfolio |
| Data Reconciliation | Reconcile data from two different sources | Data Reconciliation |
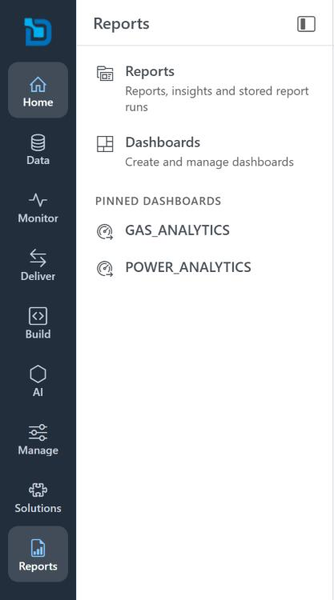
Reports
| Item | What it is for | Guide |
|---|---|---|
| Reports | Reports, insights and stored report runs | Reports and dashboards |
| Dashboards | Create and manage dashboards | Reports and dashboards |
Under Pinned dashboards and Pinned reports are the dashboards and reports you have pinned, so you can open them in one click. Select the pin beside a dashboard or report in its list to pin it, and select it again to unpin it.
Where the old menu items went
If you used the portal before the new menu, this is where to find things now:
| You used | Now |
|---|---|
| Master Data, Data, Events, GEO Data | Data > Data Explorer (the Explore and GEO Data tabs) |
| Smart Data | Data > Smart Data |
| Process Timeline | No longer in the menu: see Process timeline |
| Auditing | Monitor > Auditing |
| Groups, Favourites | Manage > Group Manager, and the starred items and groups in Data Explorer: see Favourites |
| Data Packages | No longer in the menu: ask your administrator or OpenDataDSL support about a data package |
| Account, Settings | The profile menu at the top right: see Account and settings |