Insights
Insight reports are interactive reports in the OpenDataDSL portal. Each one looks at your data from a particular angle, such as what every data environment holds or how data has changed, with summary cards, tabs to drill into the detail and exports to CSV. The reports on this page are public, so they are available in every tenant and work with your own access rights.
Pick a report below to see what it shows and how to read it.
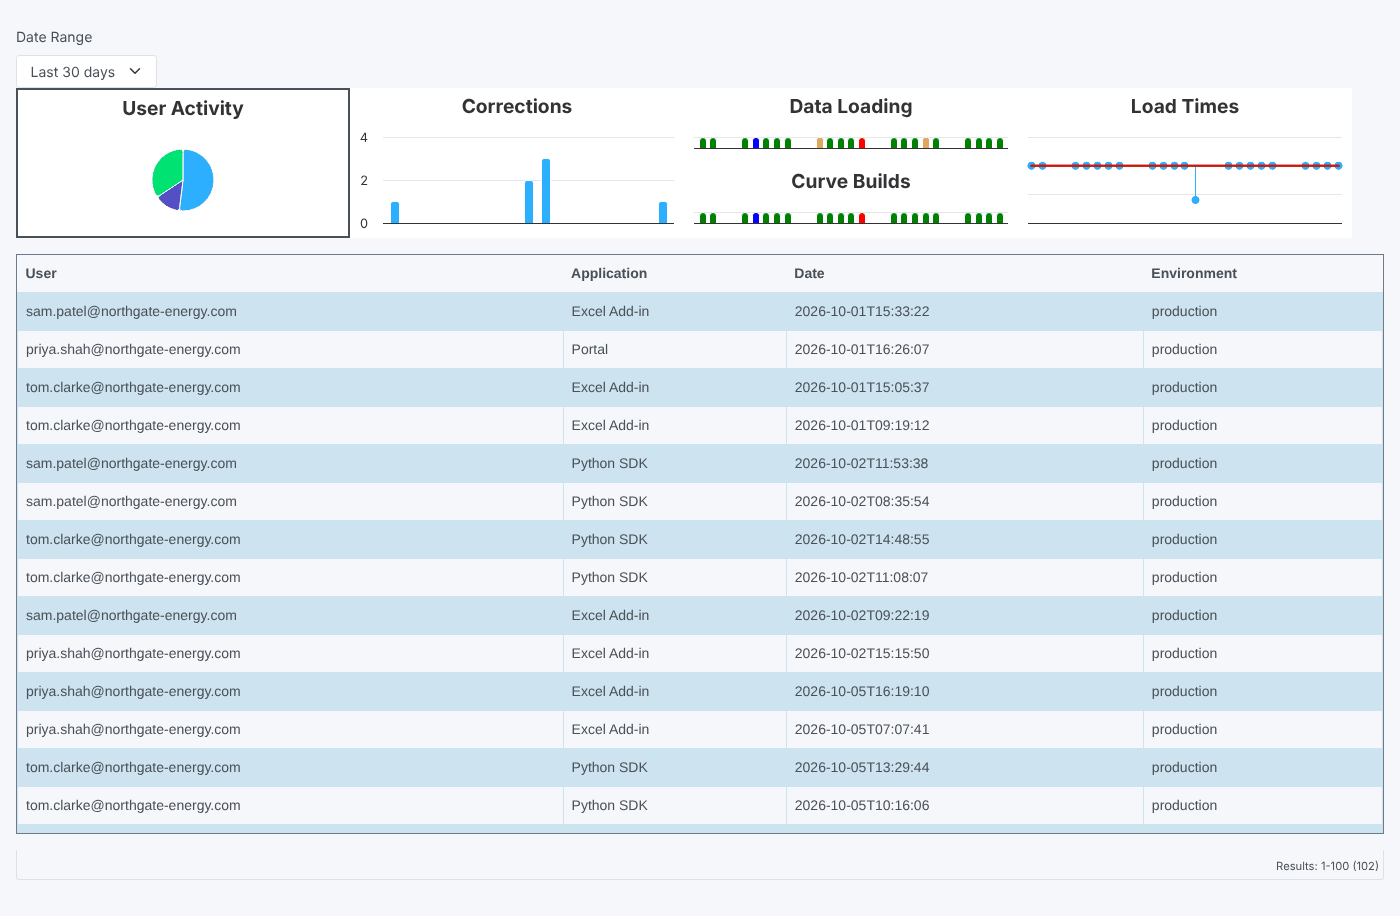
Activity Report
Usage, corrections, data loading, curve builds and load times for one dataset object
Read about this report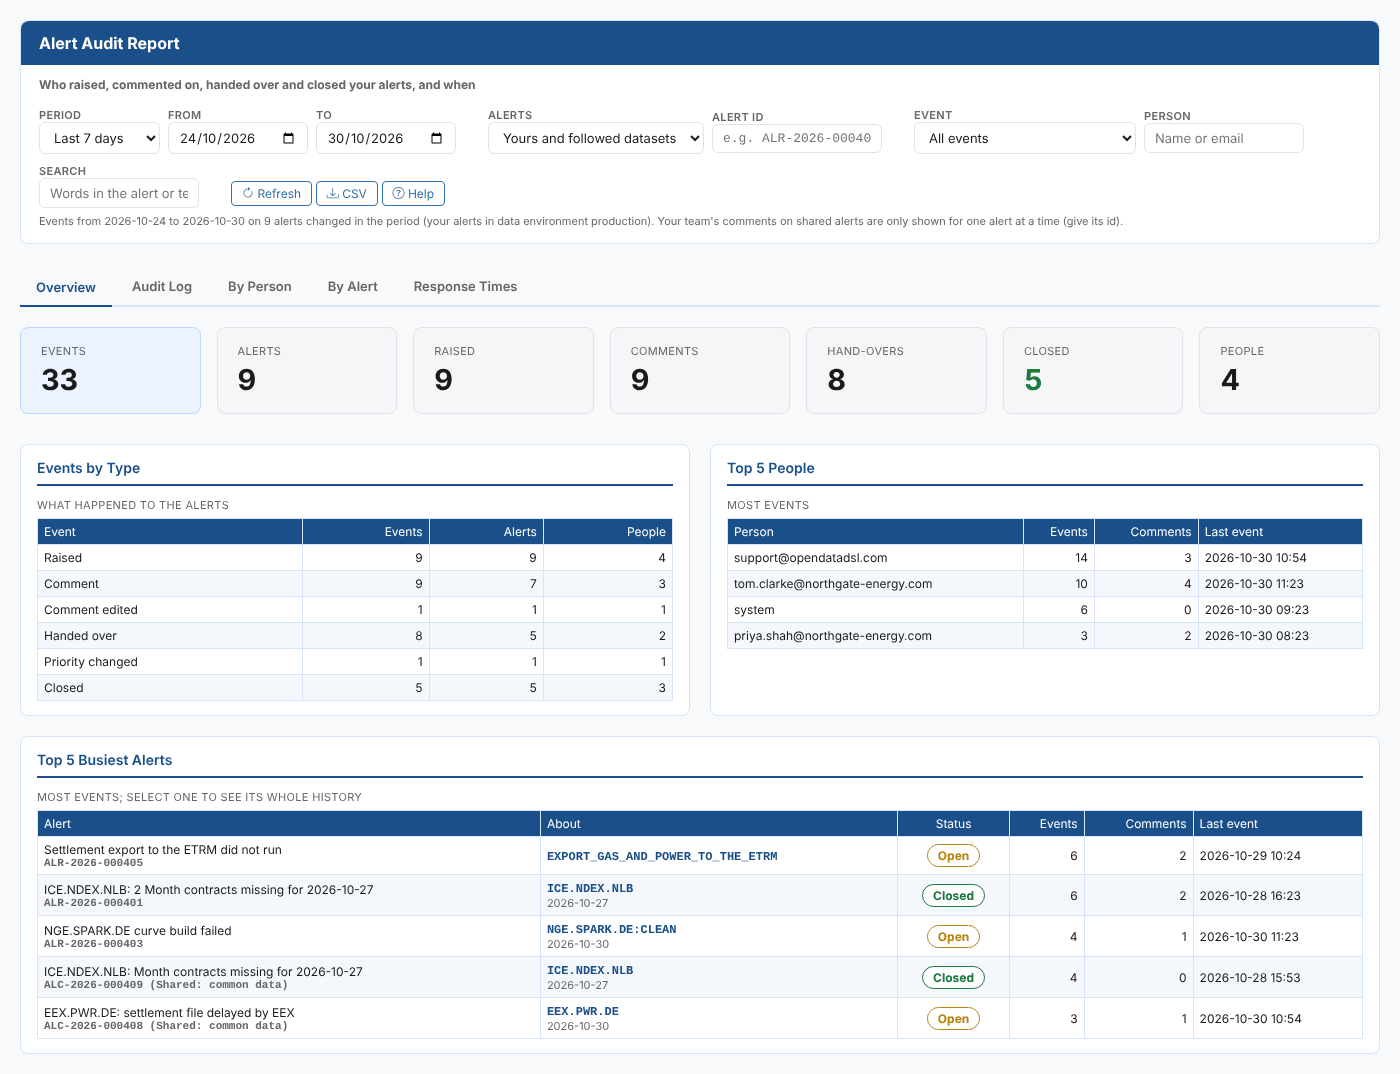
Alert Audit Report
Who raised, commented on, handed over and closed your alerts, and when, with the whole history of any one alert and your response times
Read about this report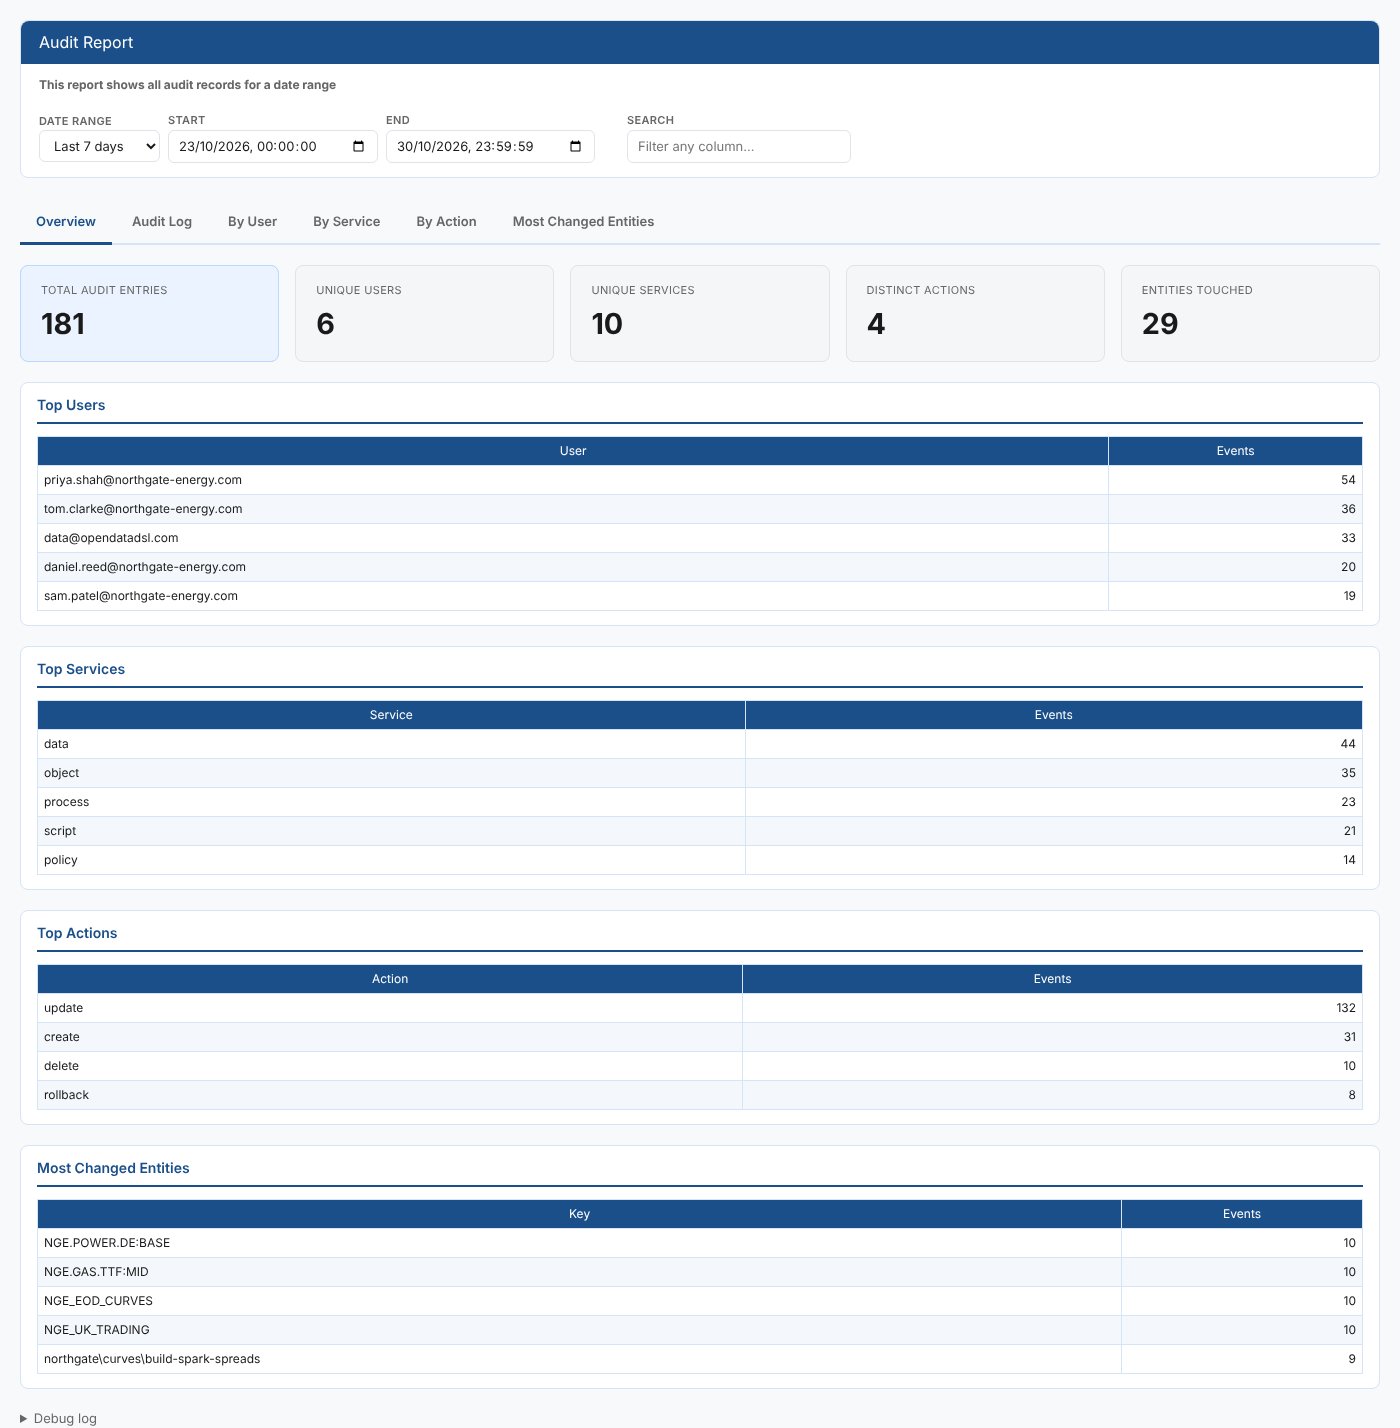
Audit Report
Every change made to your private data in a date range, who made it and what changed, with summaries by user, service and action
Read about this report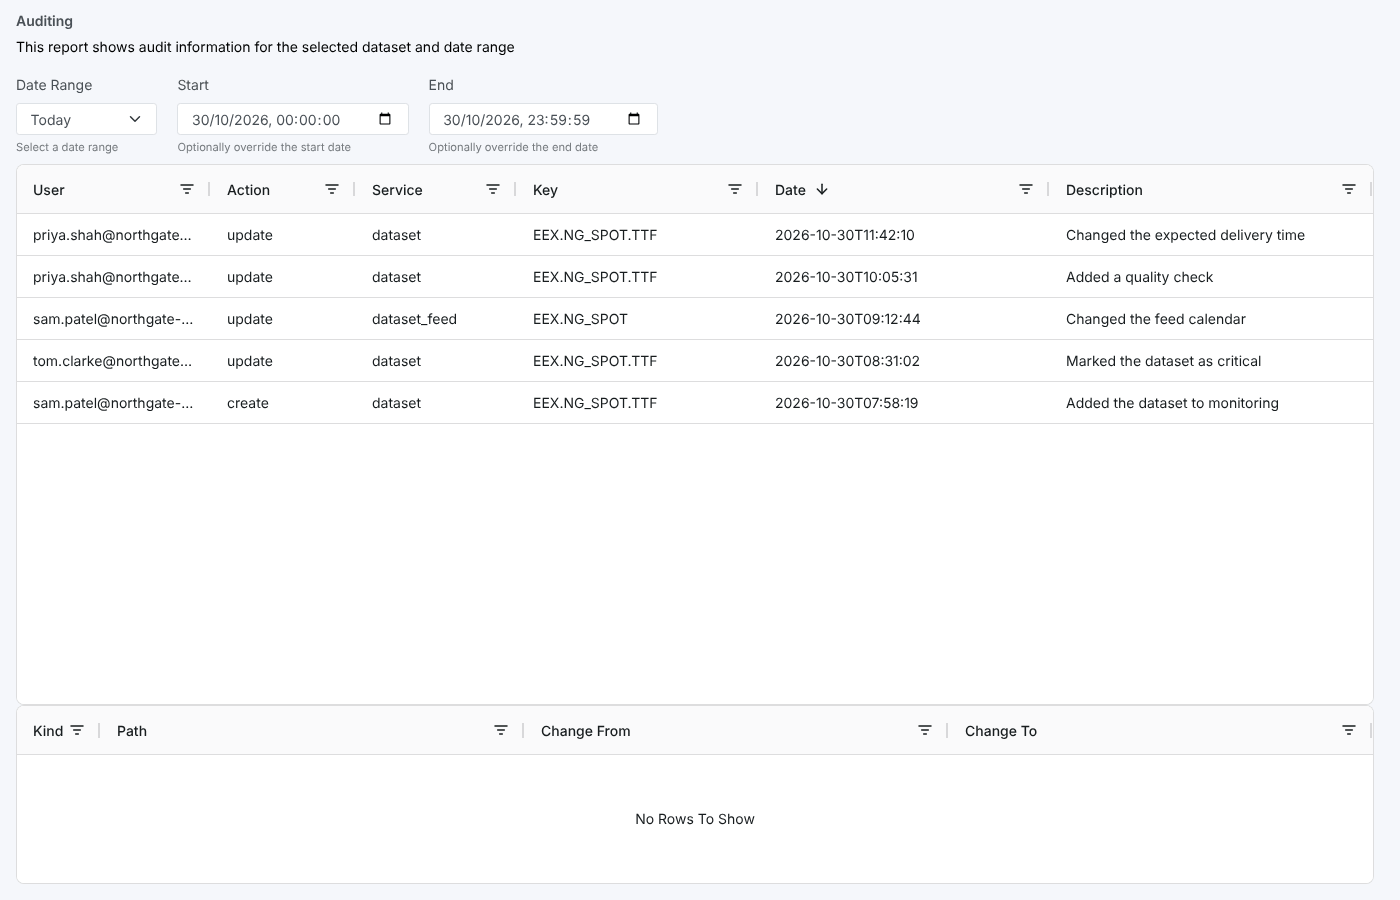
Auditing
Who changed a monitored dataset or its feed, when, and exactly which settings changed
Read about this report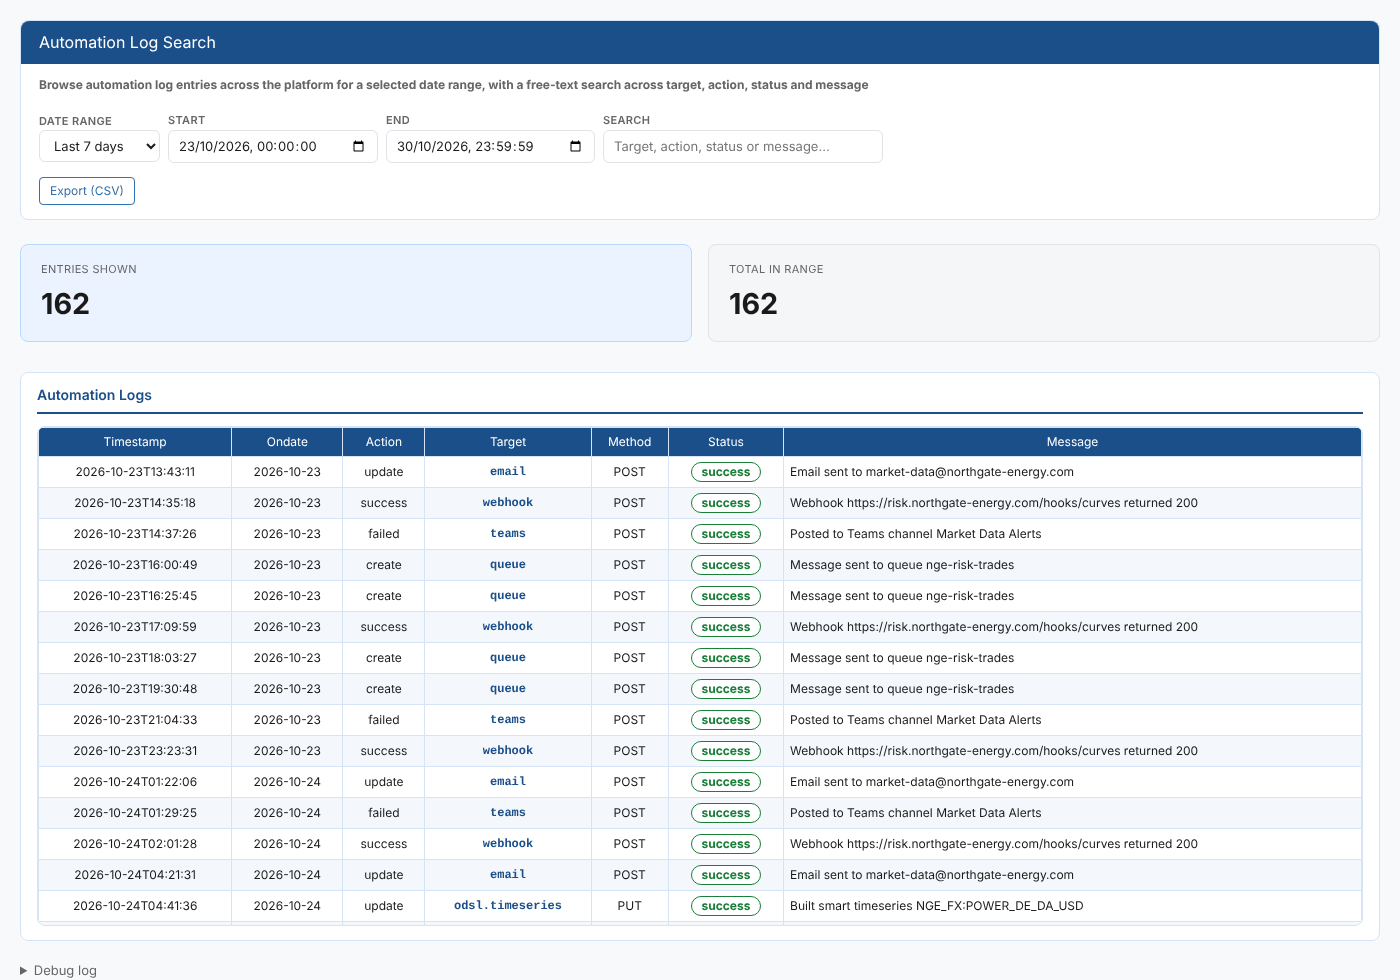
Automation Log Search
Every automation that ran in a date range, with a quick search to find failures and the messages behind them
Read about this report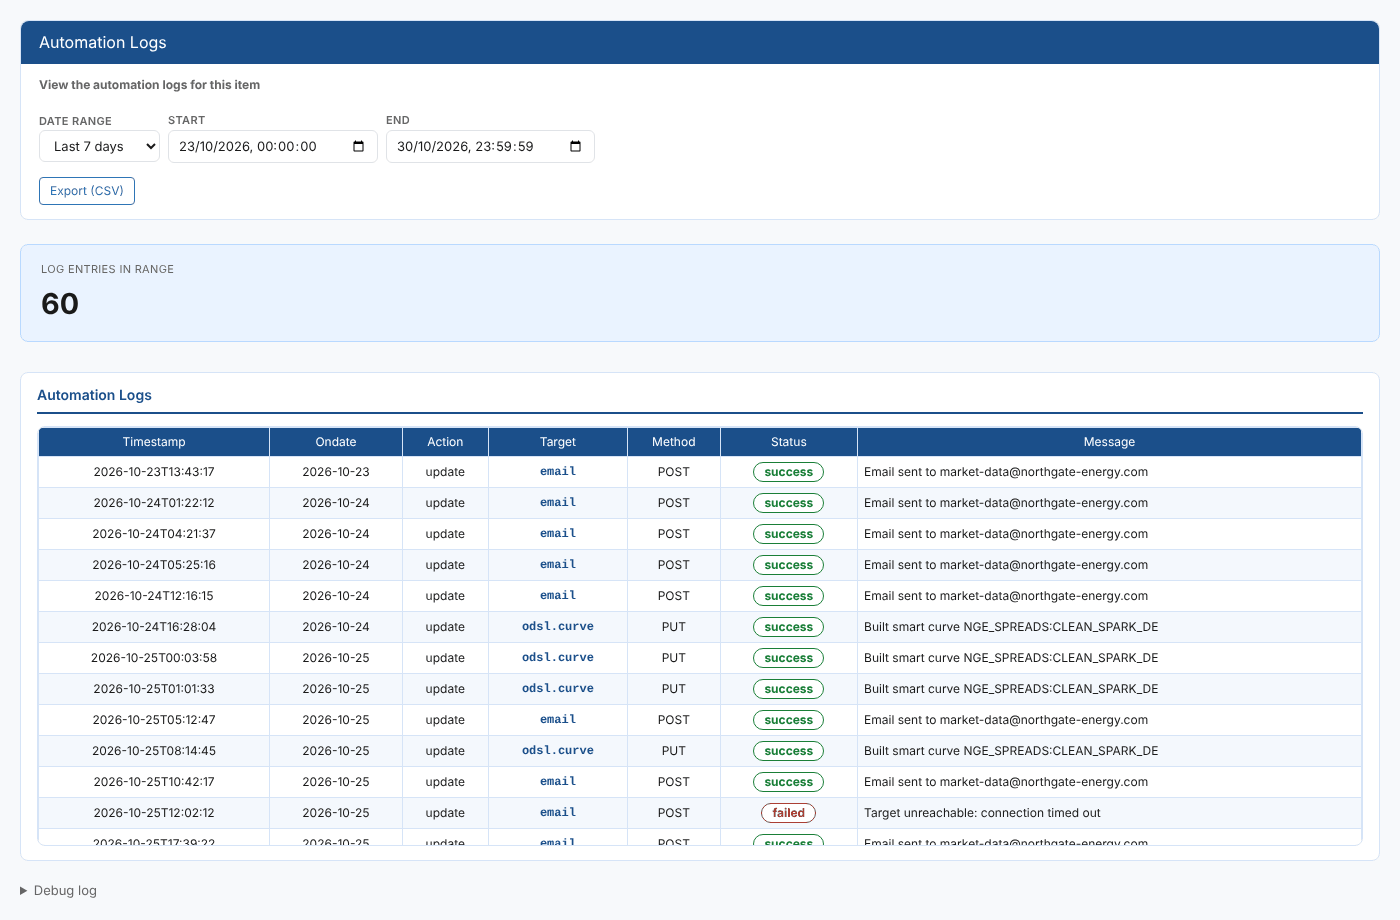
Automation Logs
What the automations on one item did, when, and whether each one succeeded
Read about this report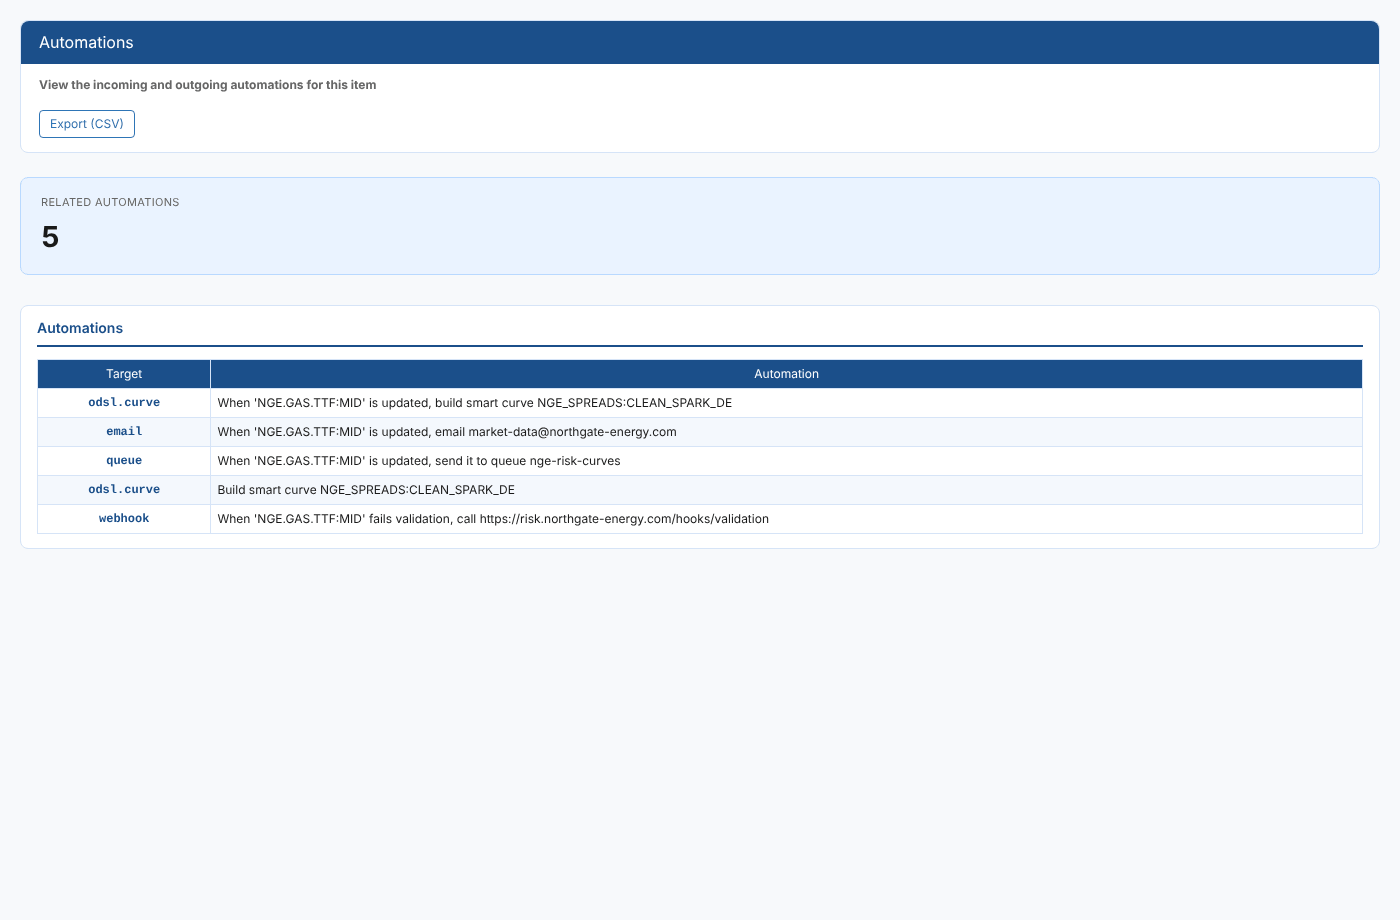
Automations
The automations that watch or act on the item you are looking at
Read about this report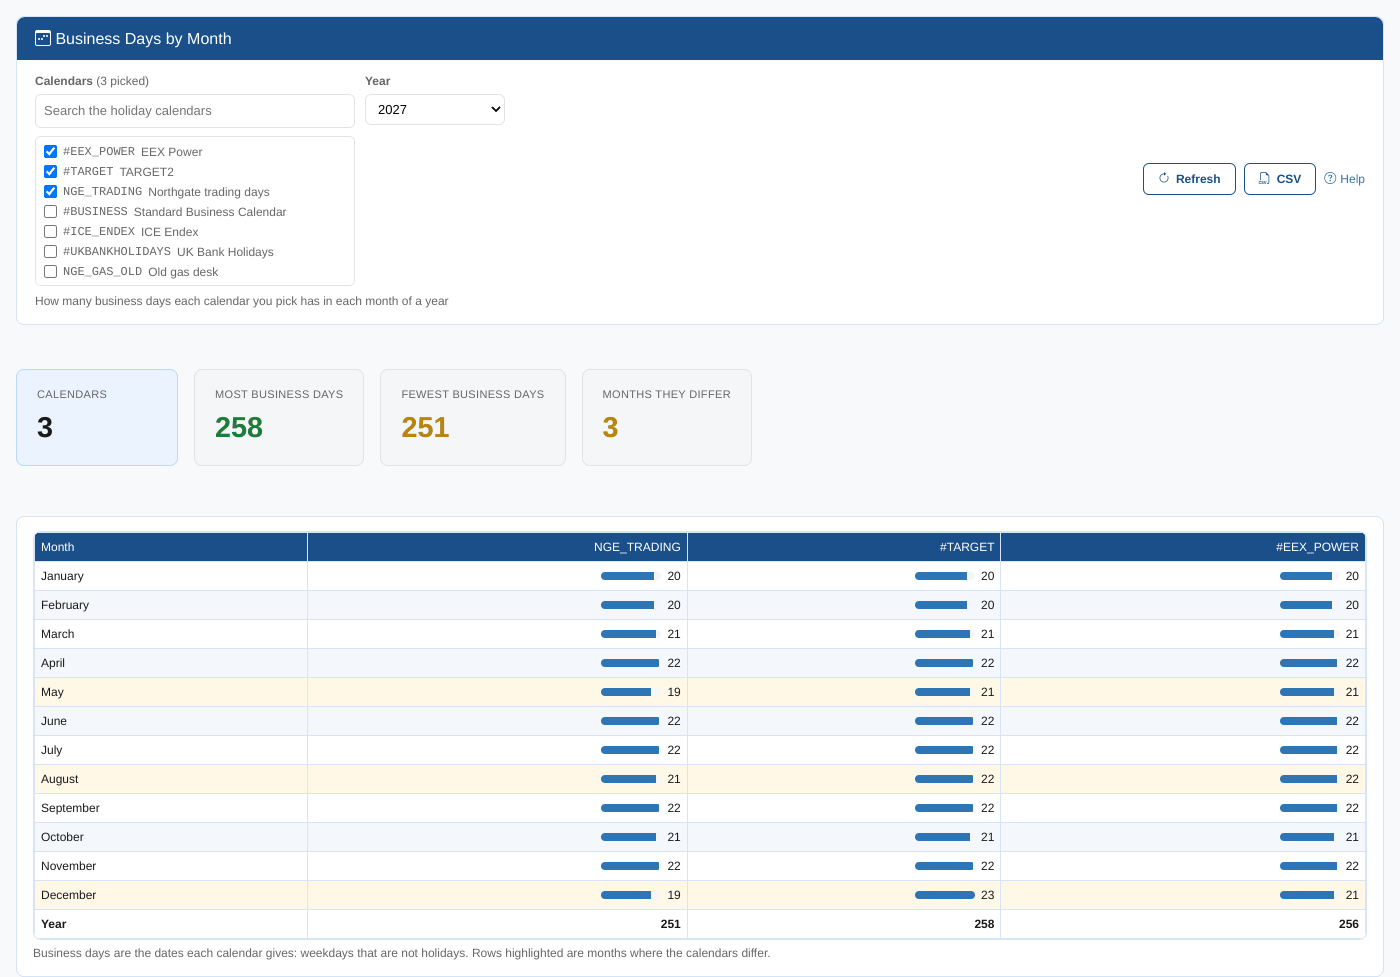
Business Days by Month
How many business days each calendar has in each month of a year
Read about this report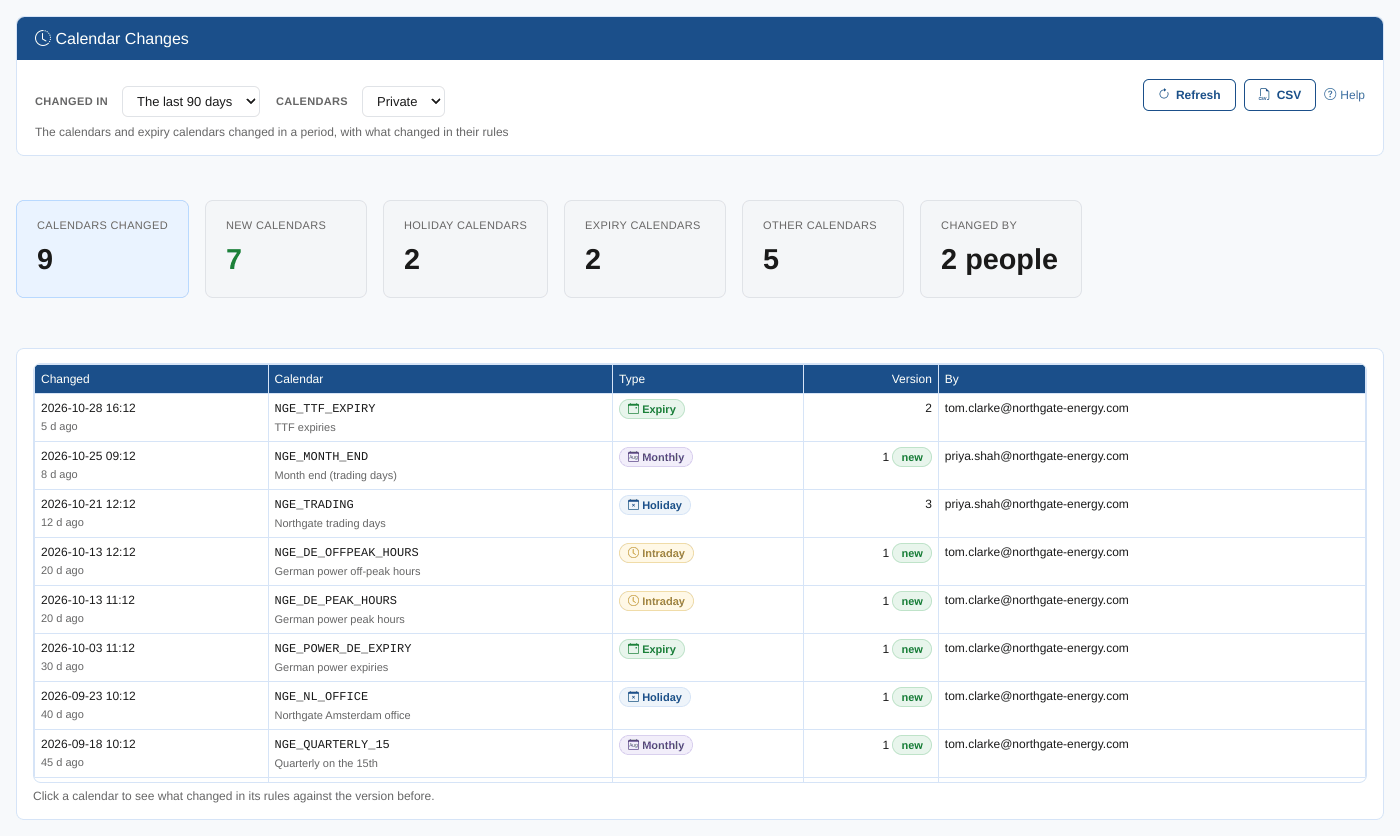
Calendar Changes
The calendars changed in a period, who changed them and what changed in their rules
Read about this report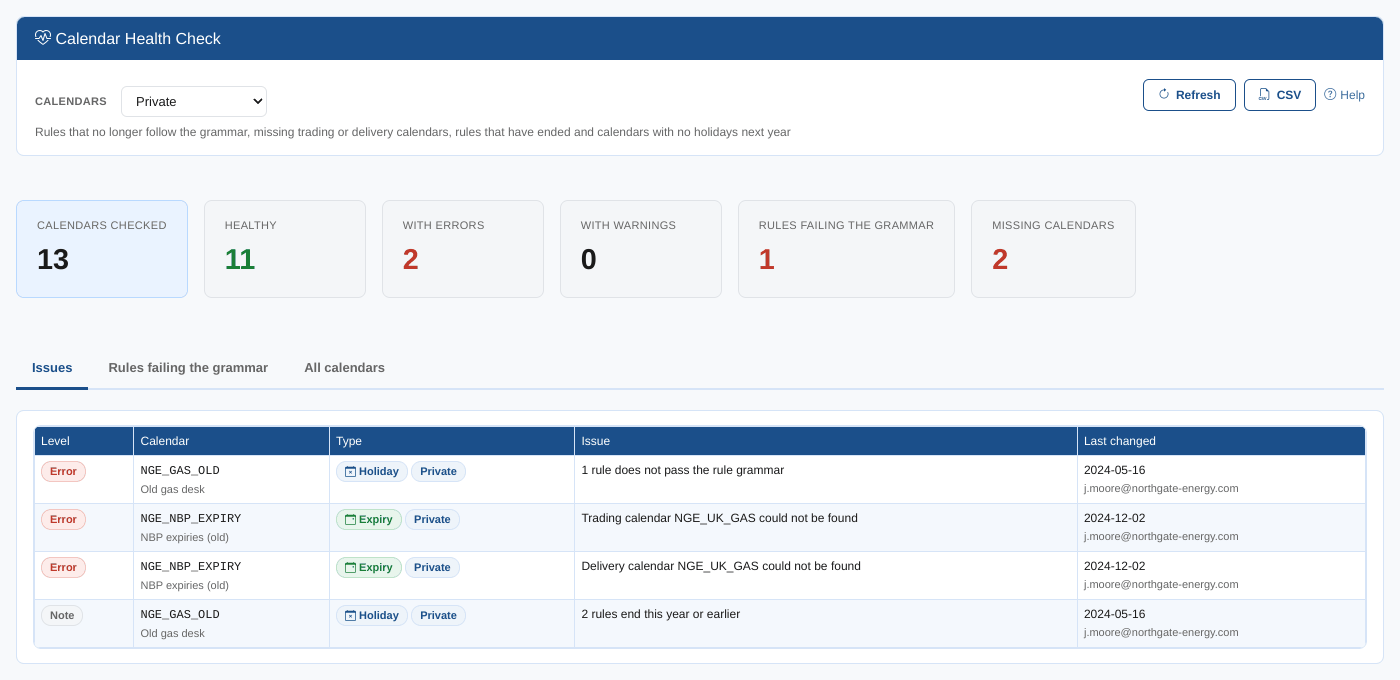
Calendar Health Check
Holiday and expiry calendars with broken rules, missing trading calendars or no holidays next year
Read about this report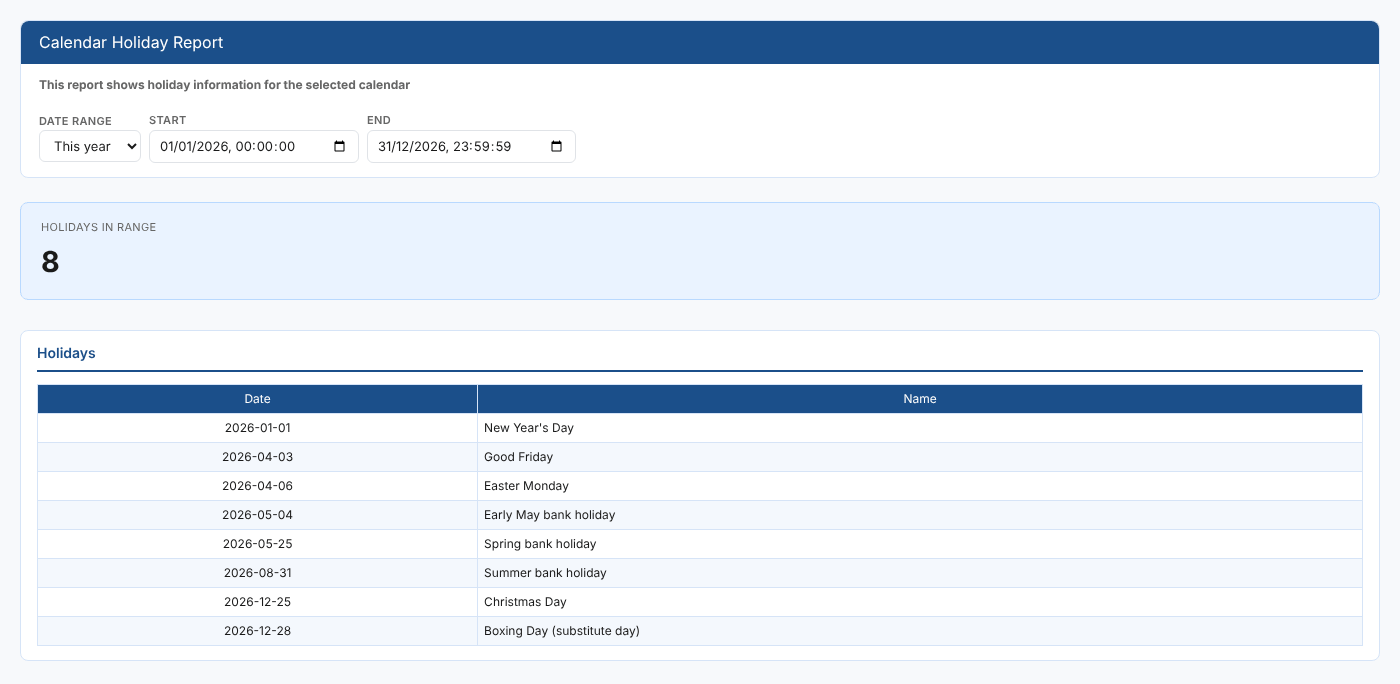
Calendar Holiday Report
From a holiday calendar's own screen, its holidays for this year or next
Read about this report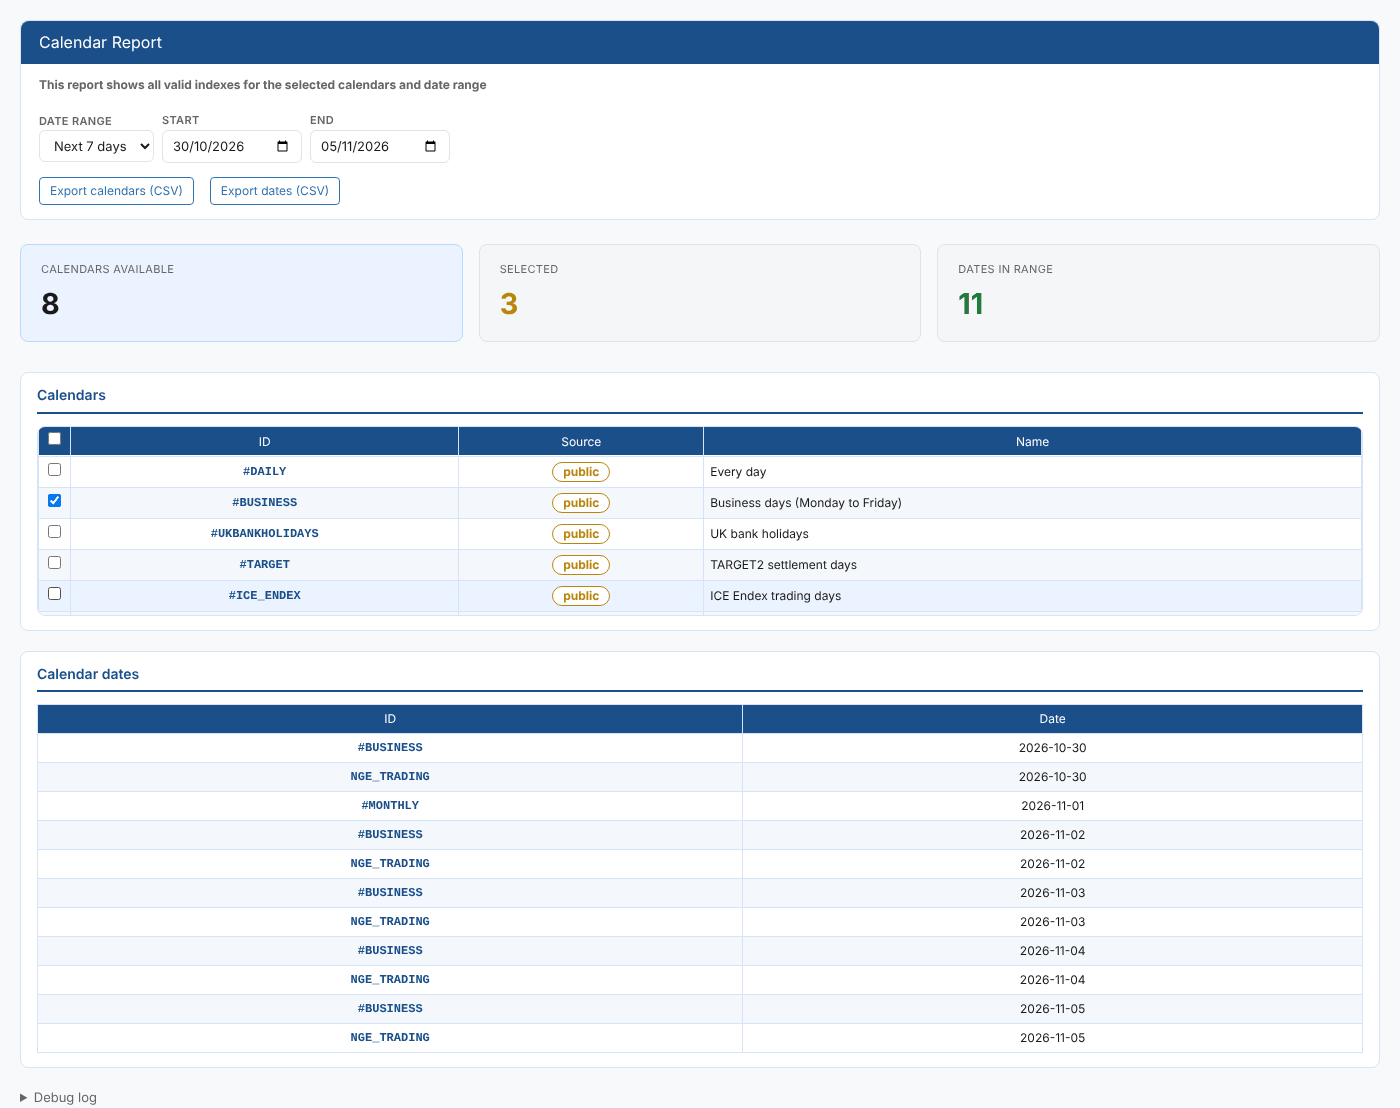
Calendar Report
Every valid date of the calendars you pick, side by side for any date range
Read about this report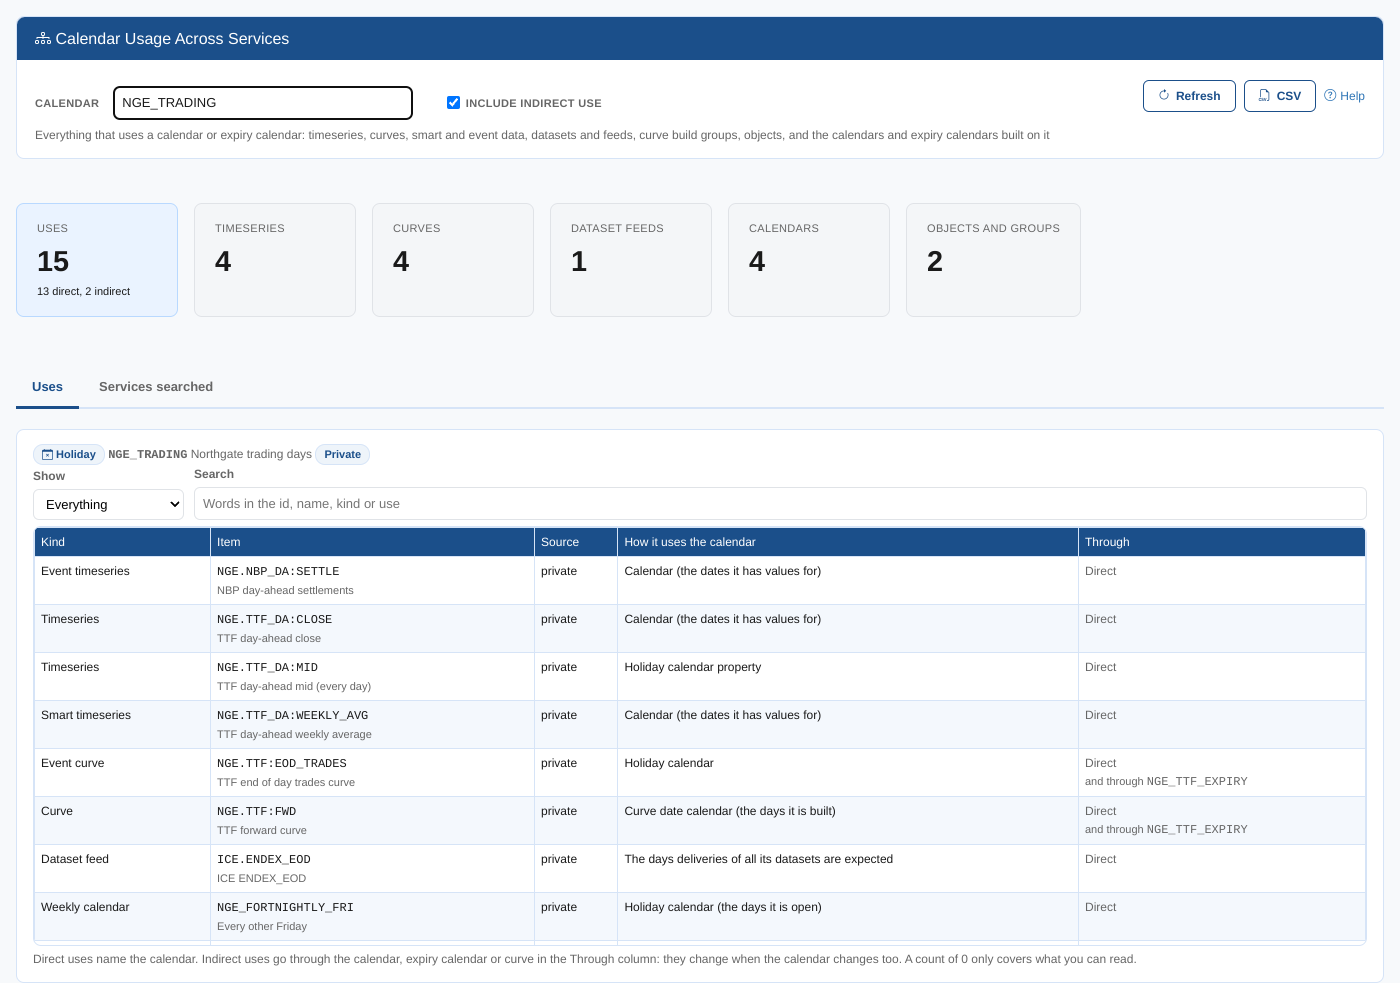
Calendar Usage Across Services
Everything that uses a calendar, across timeseries, curves, datasets, groups, objects and other calendars, directly or indirectly
Read about this report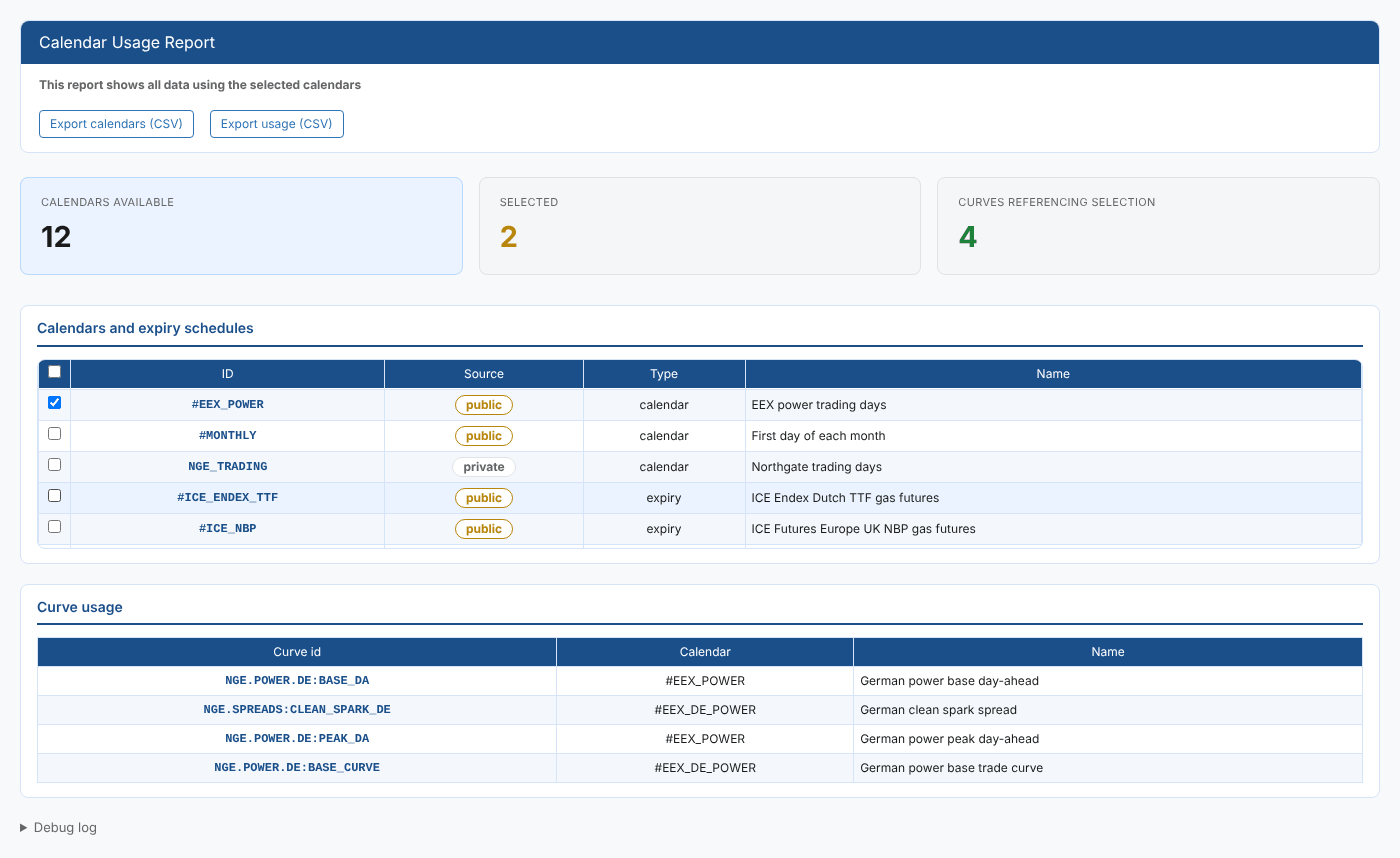
Calendar Usage Report
Which timeseries and curves use the calendars and expiry calendars you pick
Read about this report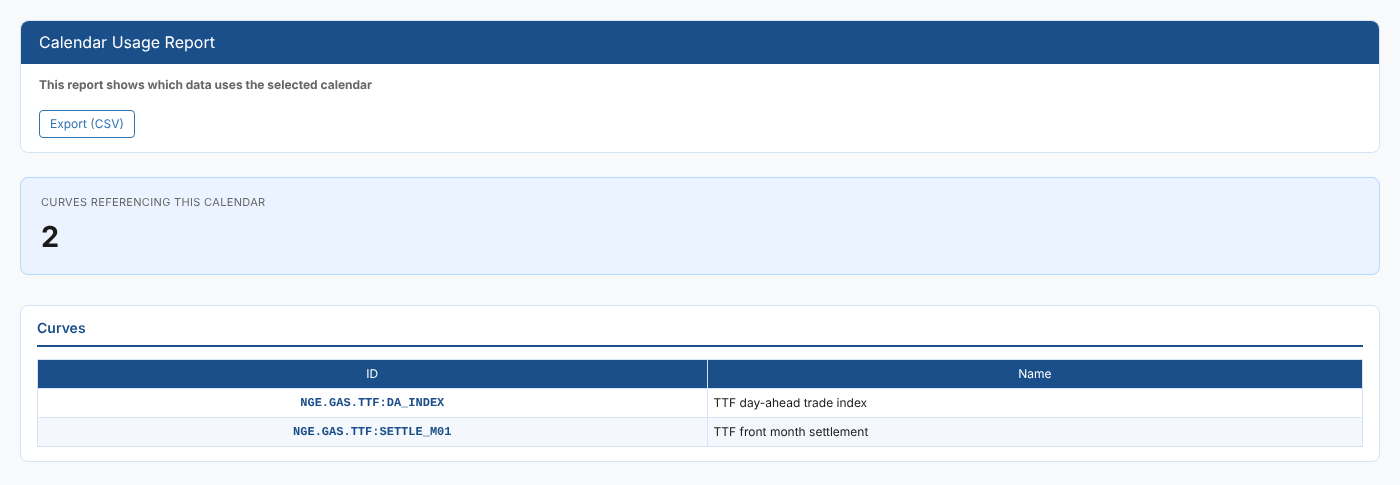
Calendar Usage Report (one calendar)
From a calendar's own screen, the timeseries and curves that use it
Read about this report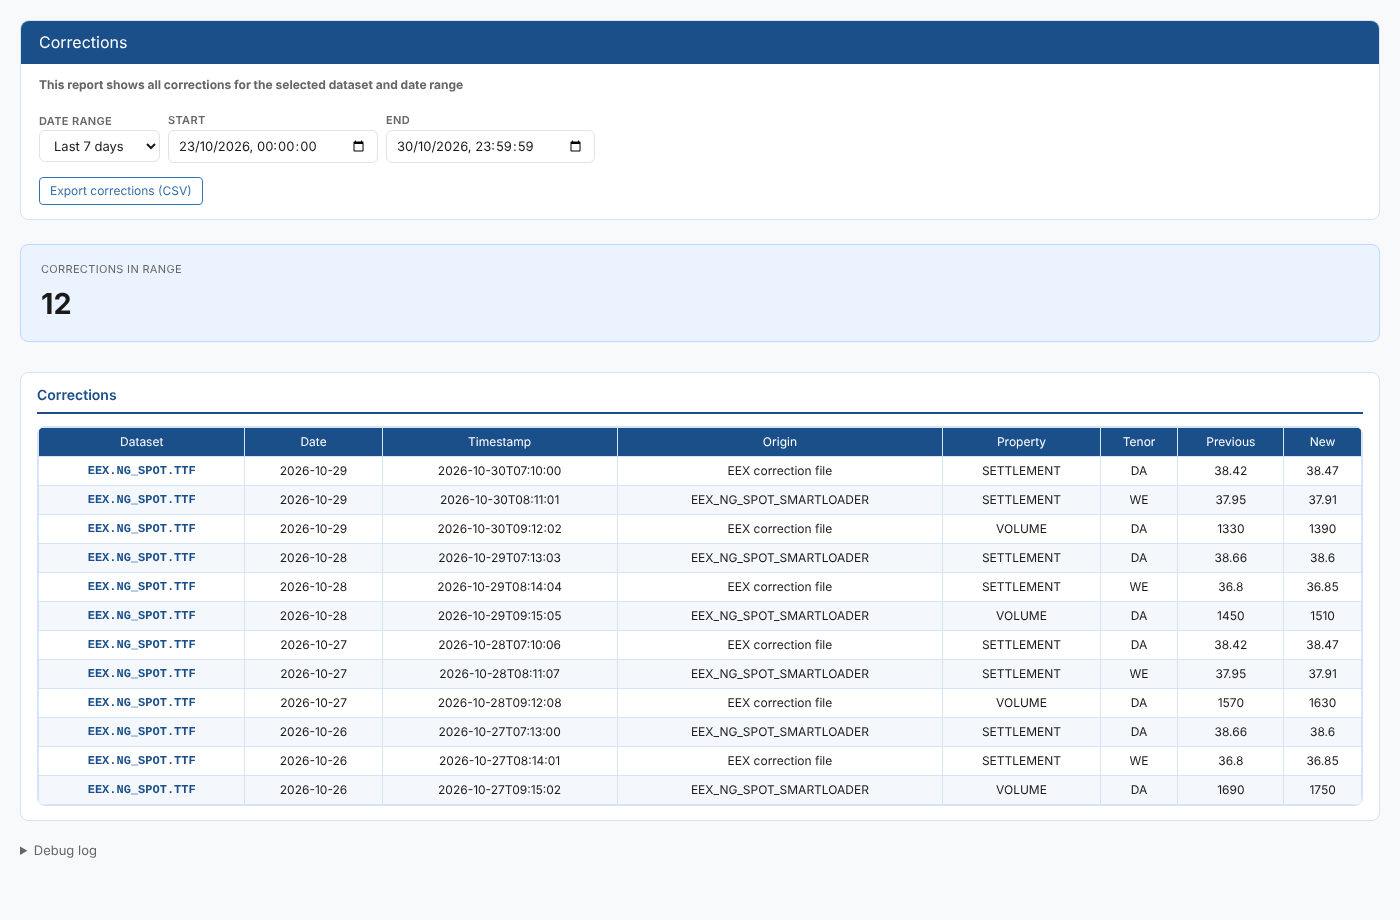
Corrections
Every correction to a dataset's data, with the previous and new value of each one
Read about this report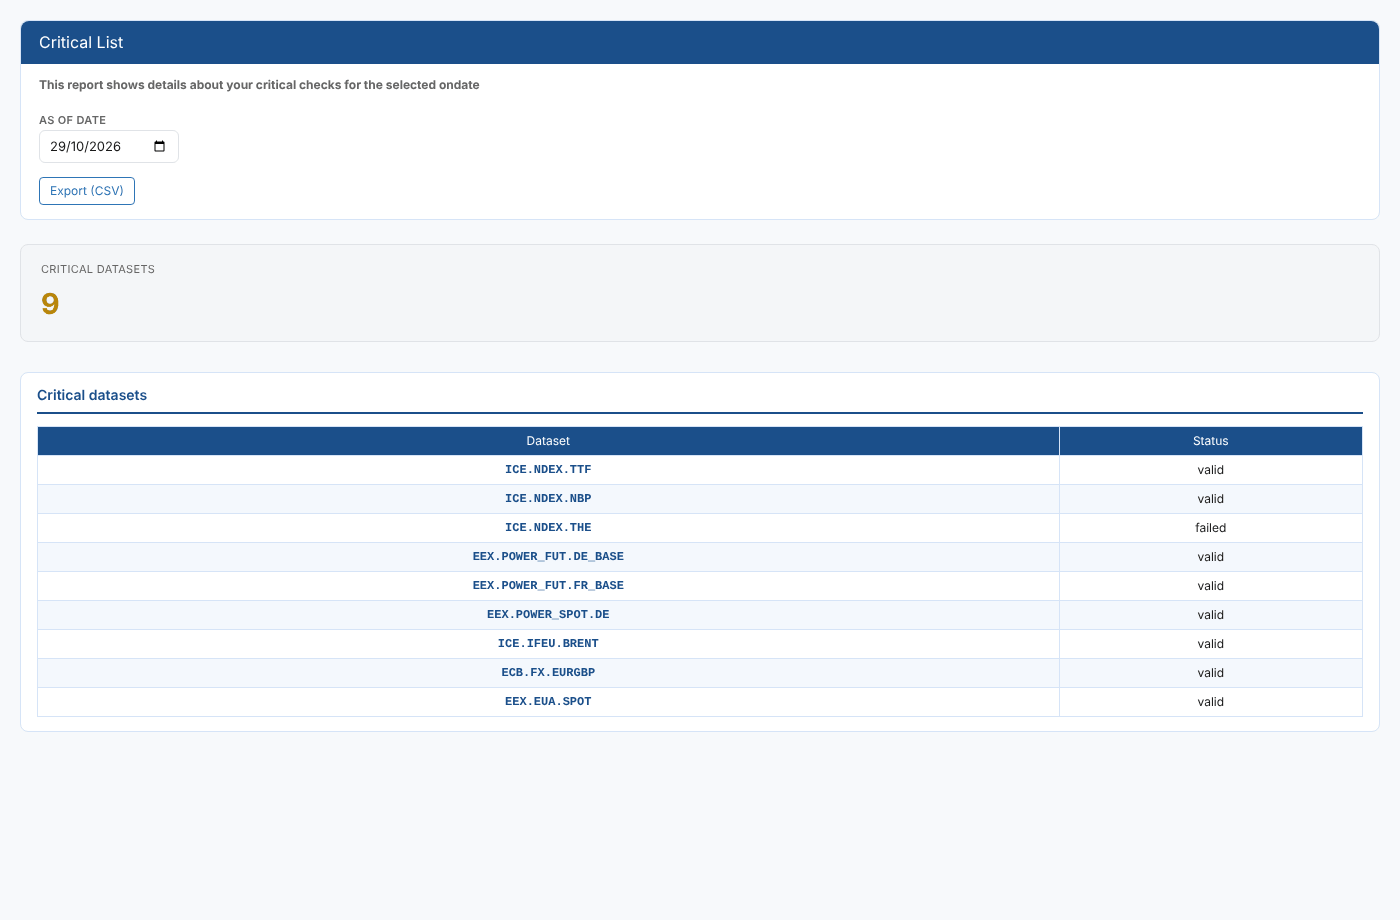
Critical List
The critical check status of every dataset for one date, on one page
Read about this report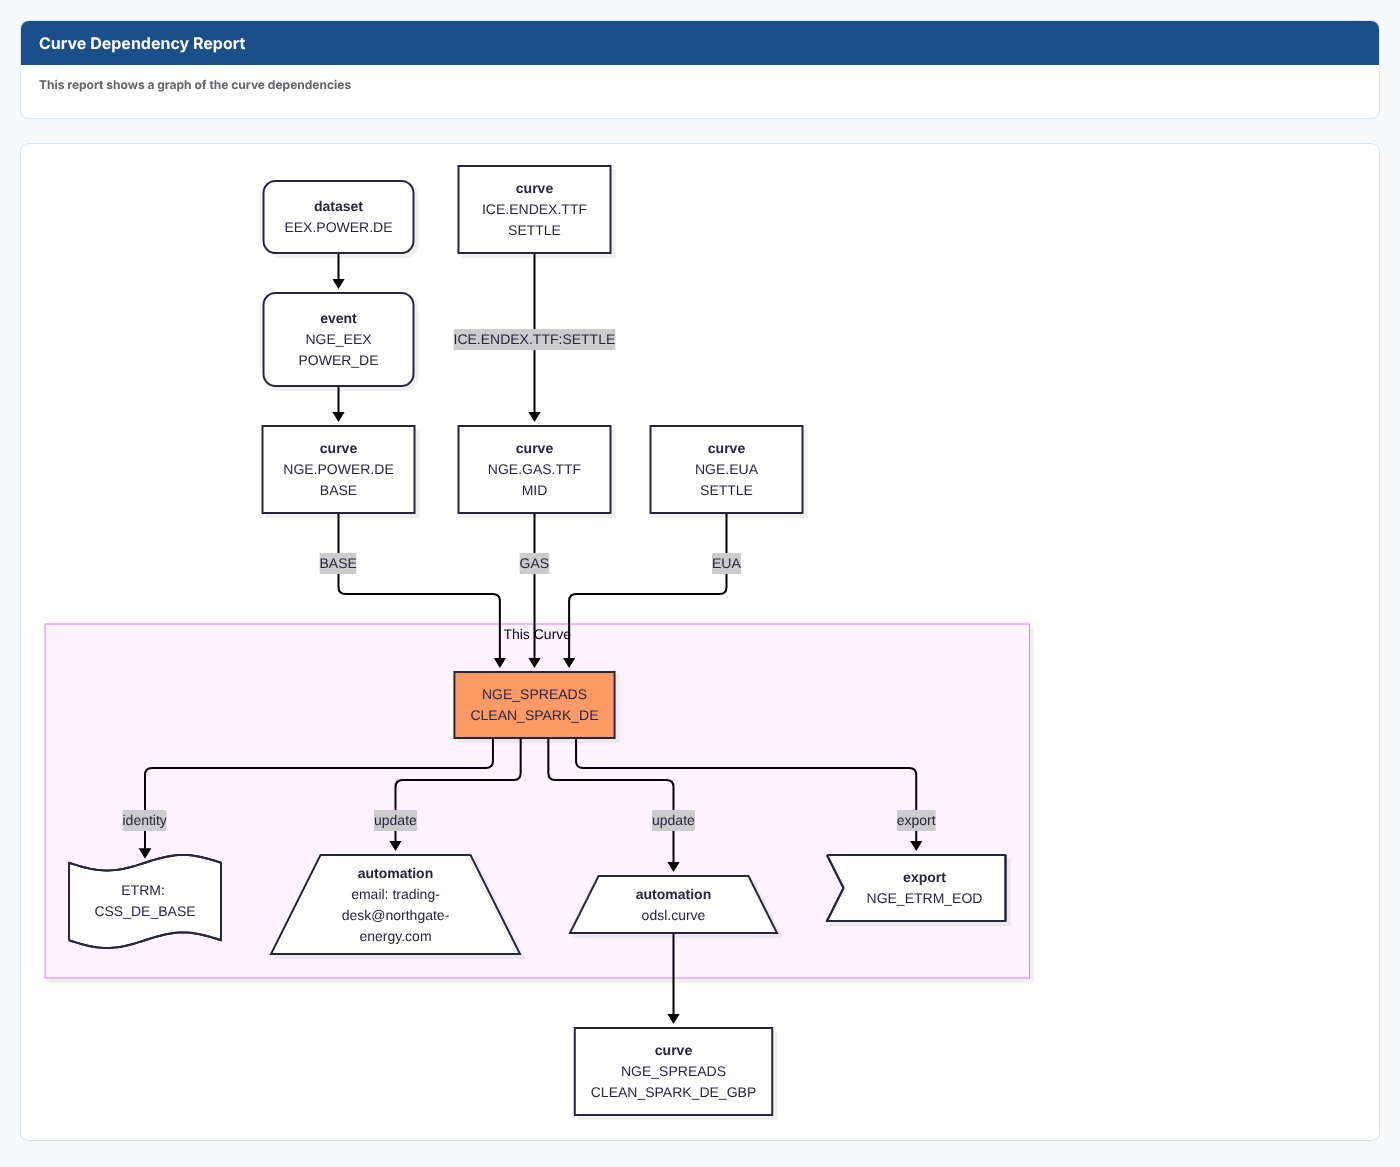
Curve Dependency Report
A diagram of what a curve is built from and what is built from it, from datasets to automations and exports
Read about this report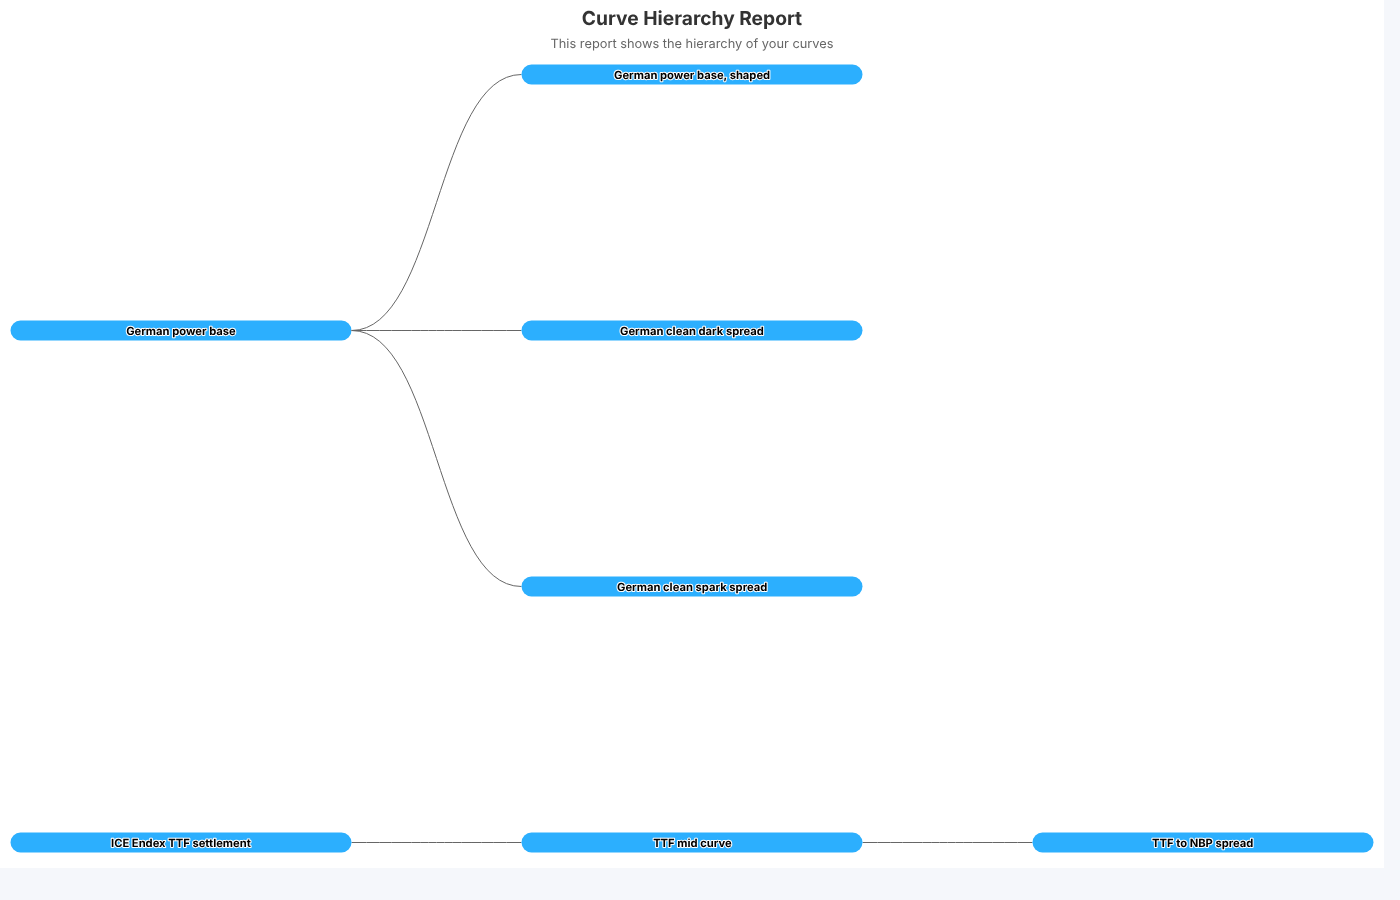
Curve Hierarchy Report
Your managed curves drawn as a tree, from each source curve to the curves built from it
Read about this report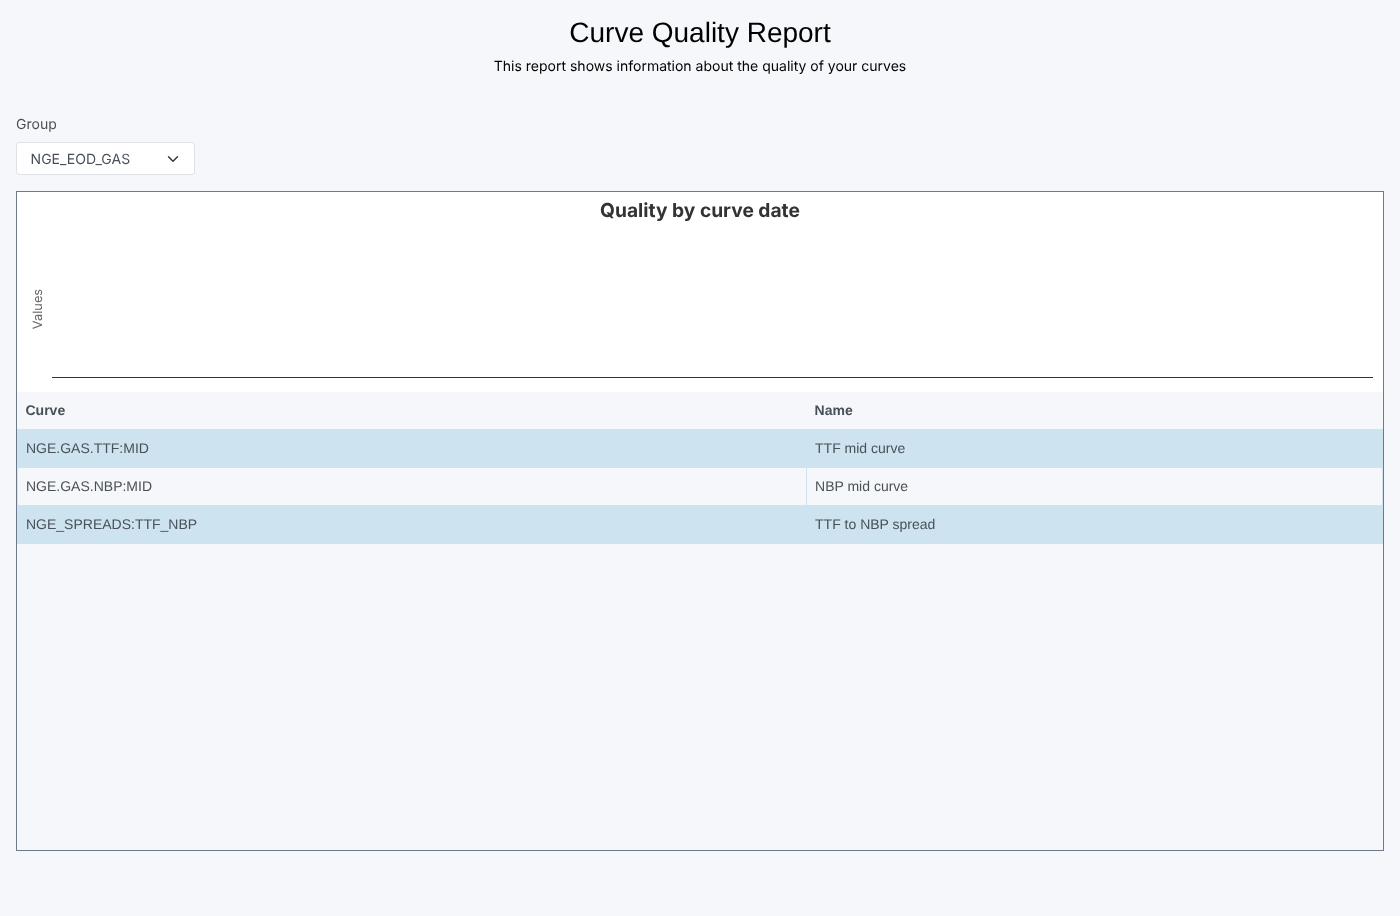
Curve Quality Report
The curves in each curve quality group, one group at a time
Read about this report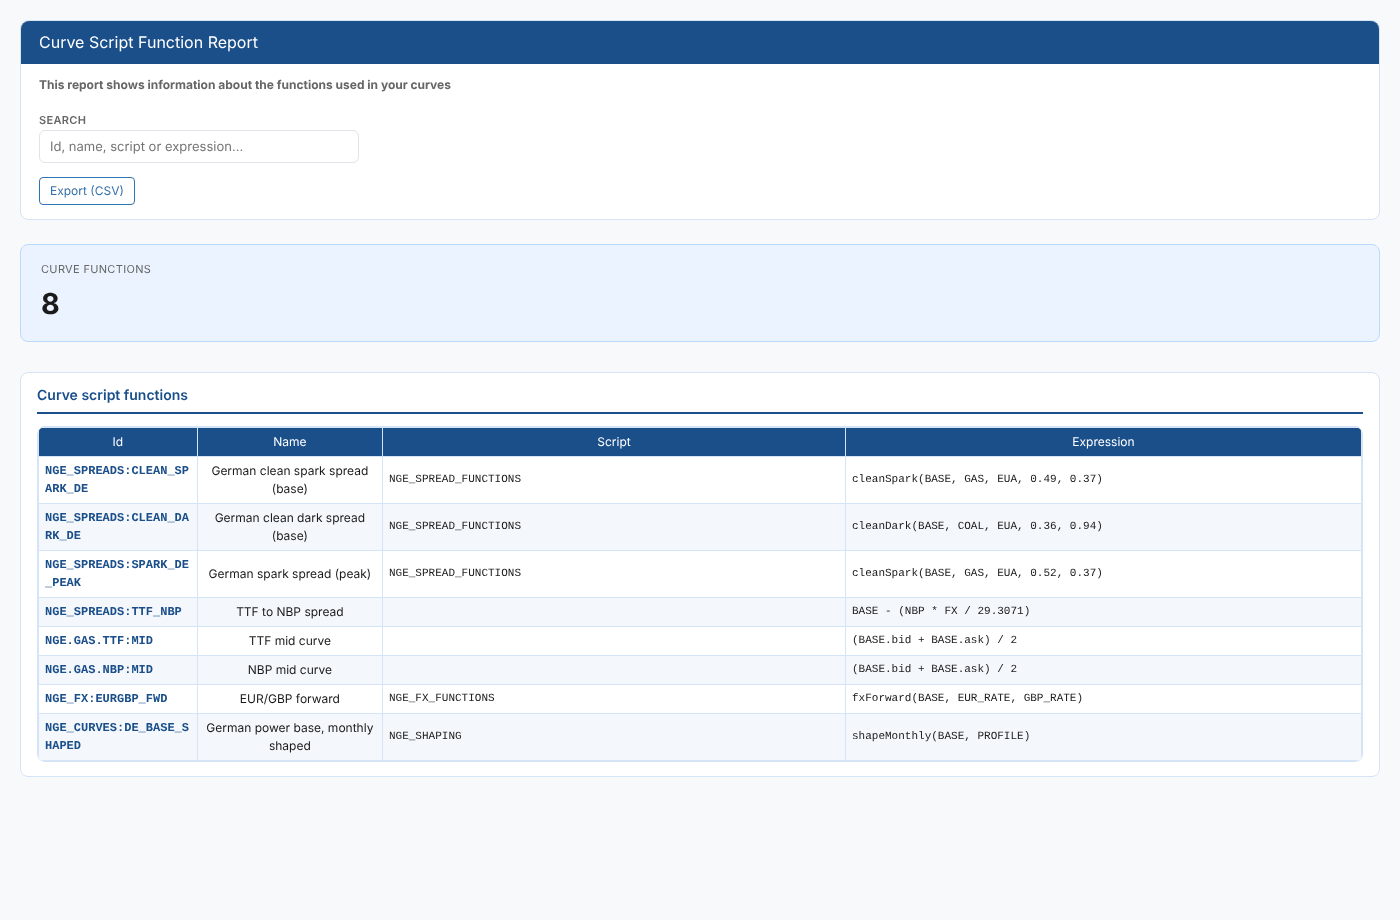
Curve Script Function Report
Every smart curve with the script and expression it is built from, searchable and exportable
Read about this report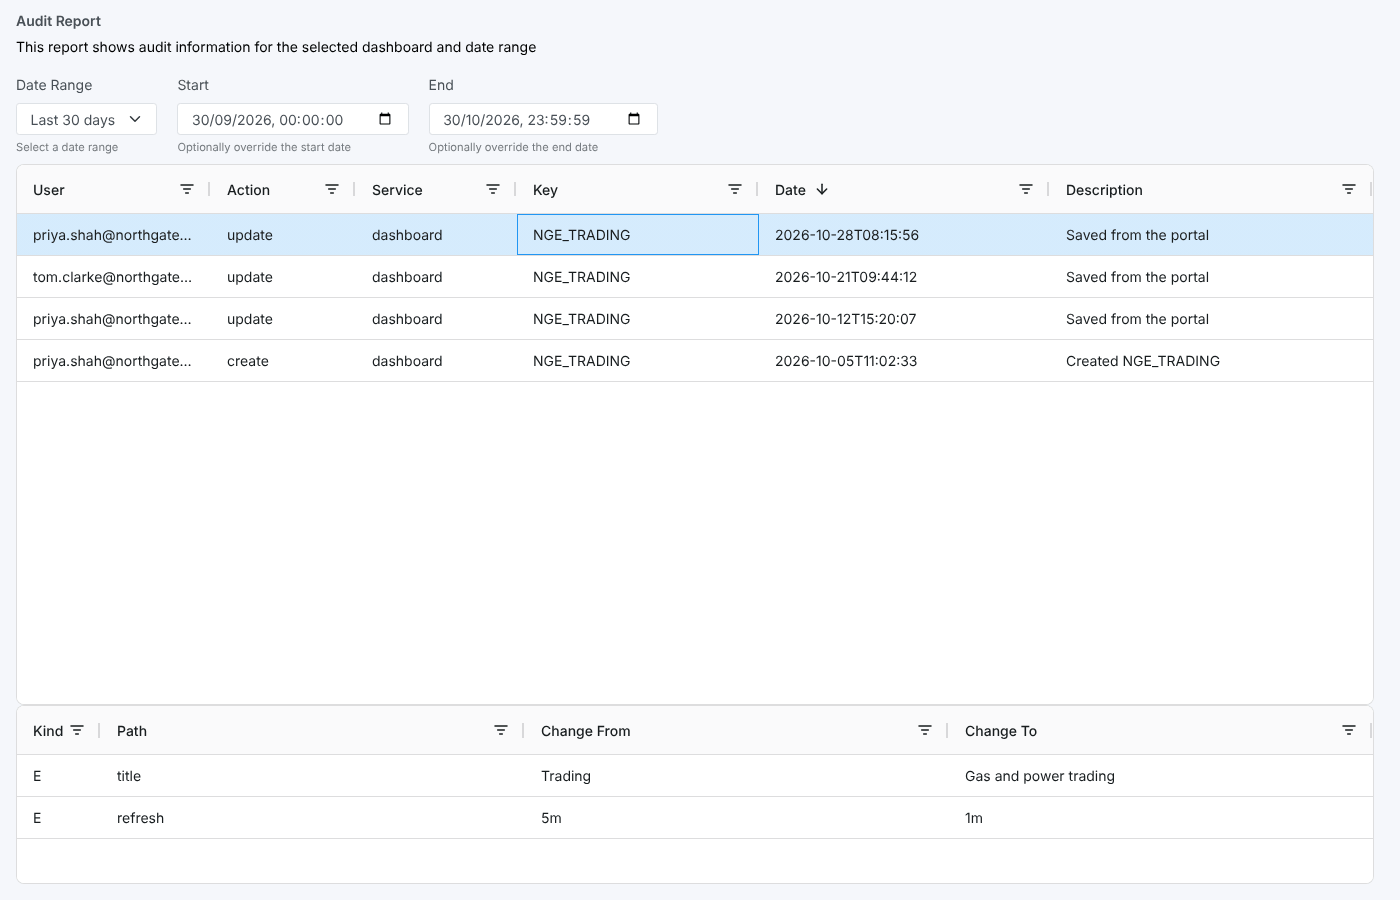
Dashboard Audit Report
Who changed a dashboard, when, and which widgets or settings changed in each save
Read about this report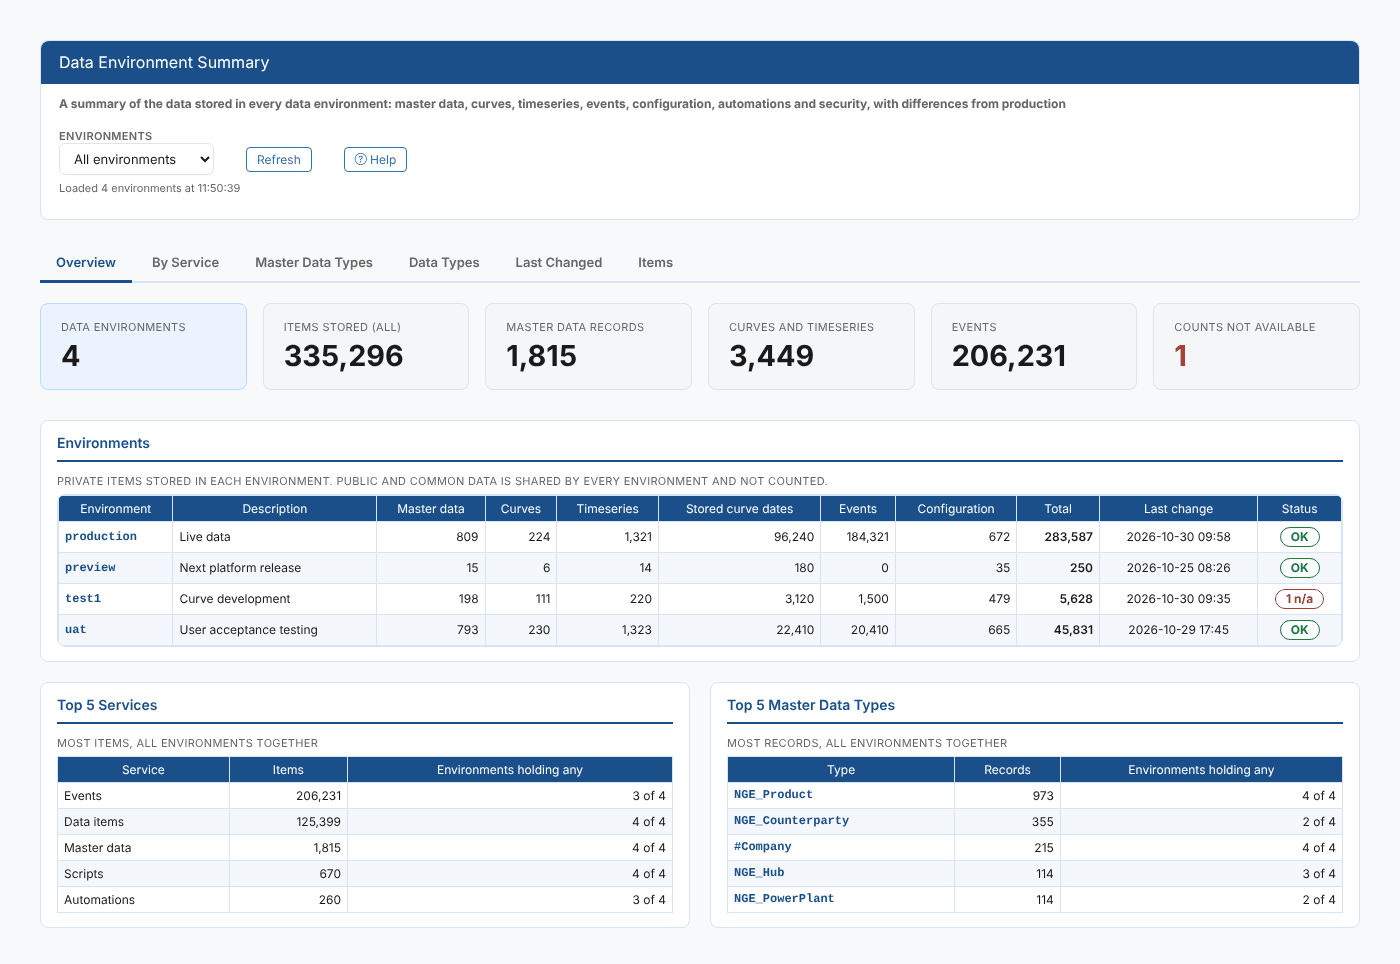
Data Environment Summary
Every data environment side by side, what each one holds, how it differs from production and where work last happened
Read about this report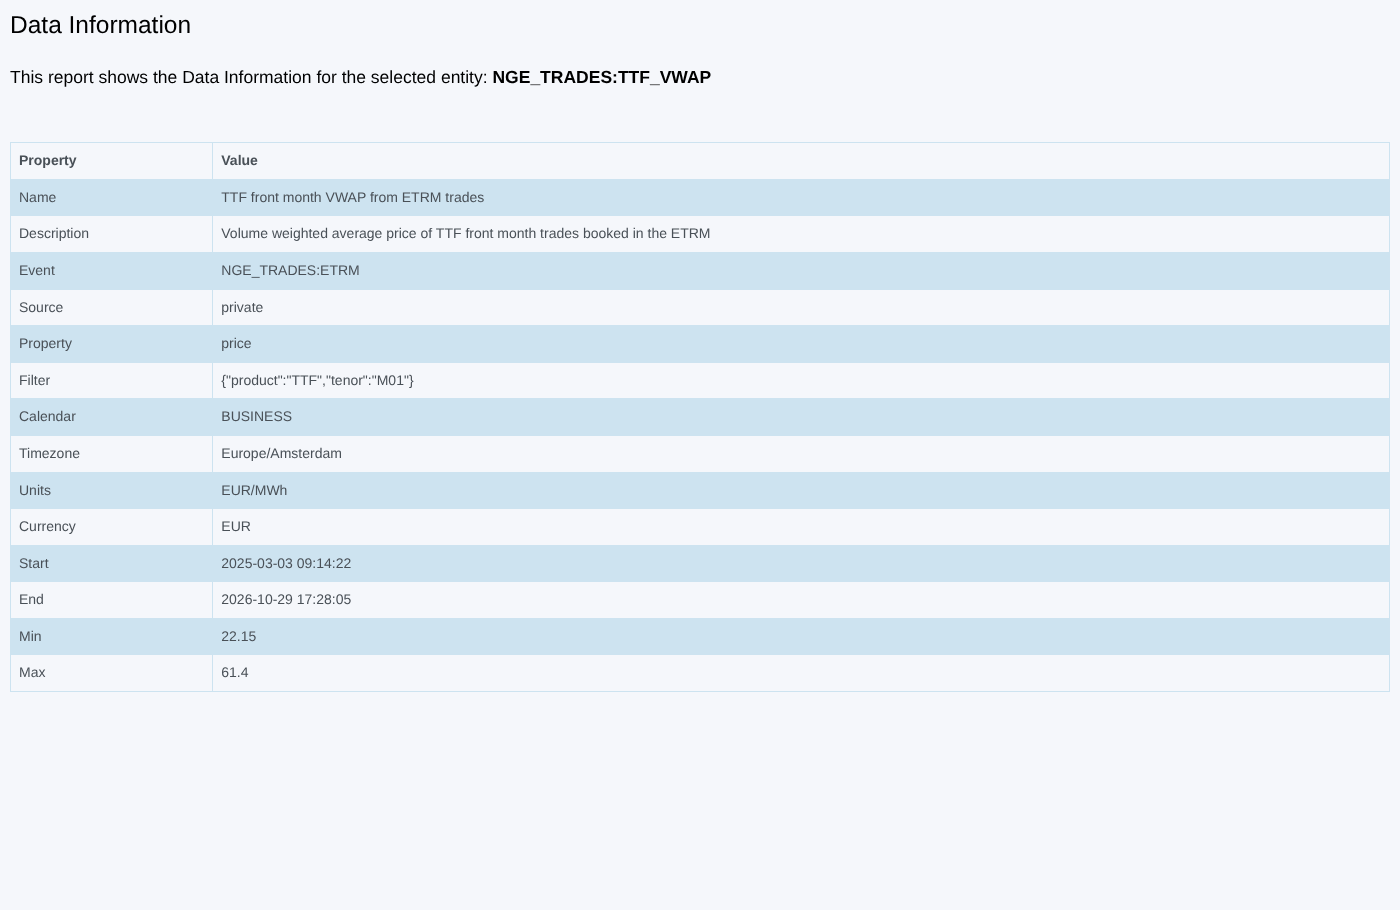
Data Report
The definition of a timeseries or curve, plus its date range and value range for event and smart timeseries
Read about this report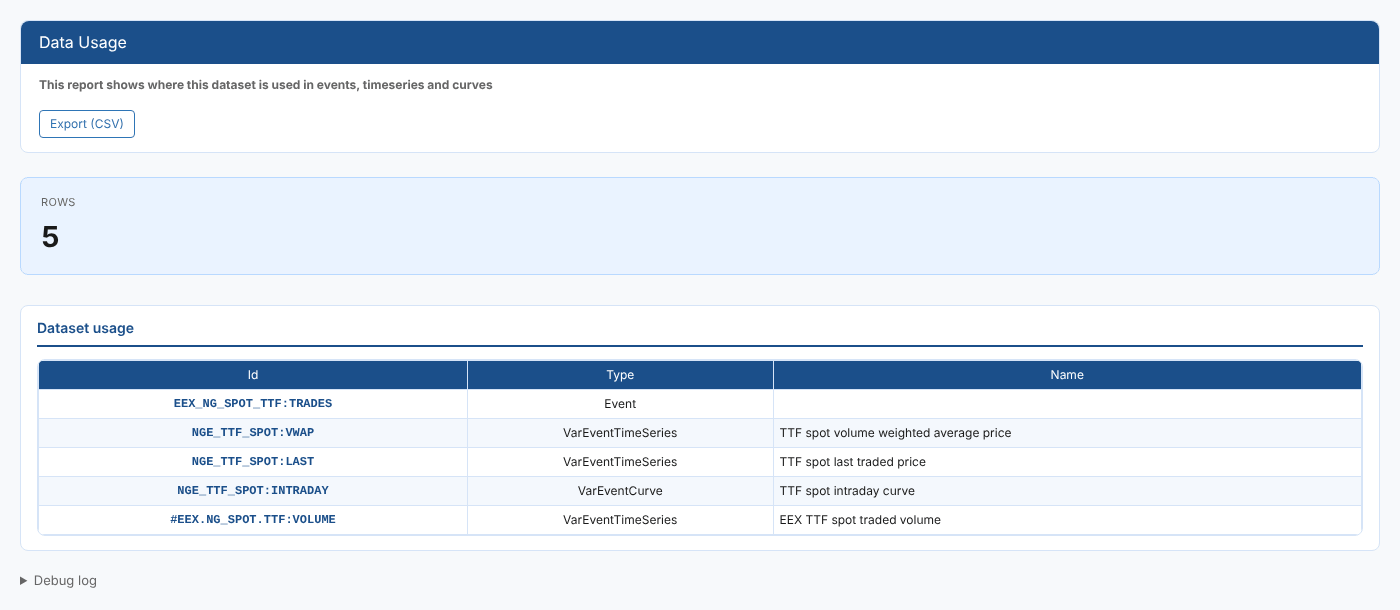
Data Usage
The event lists, event curves and event timeseries that depend on a dataset
Read about this report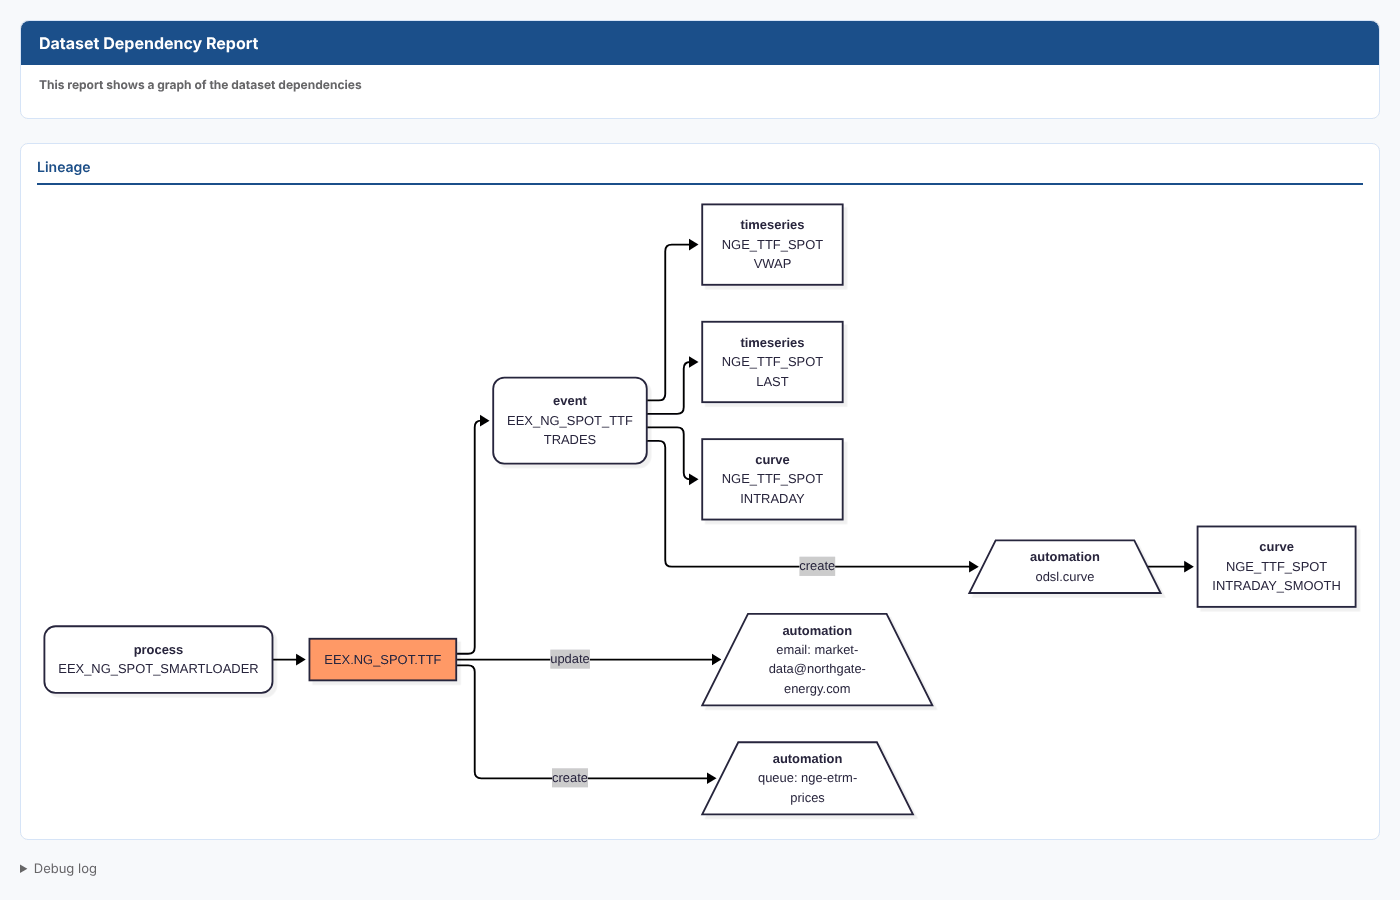
Dataset Dependency Report
A lineage diagram of a dataset, from its loading process to the events, curves and automations that depend on it
Read about this report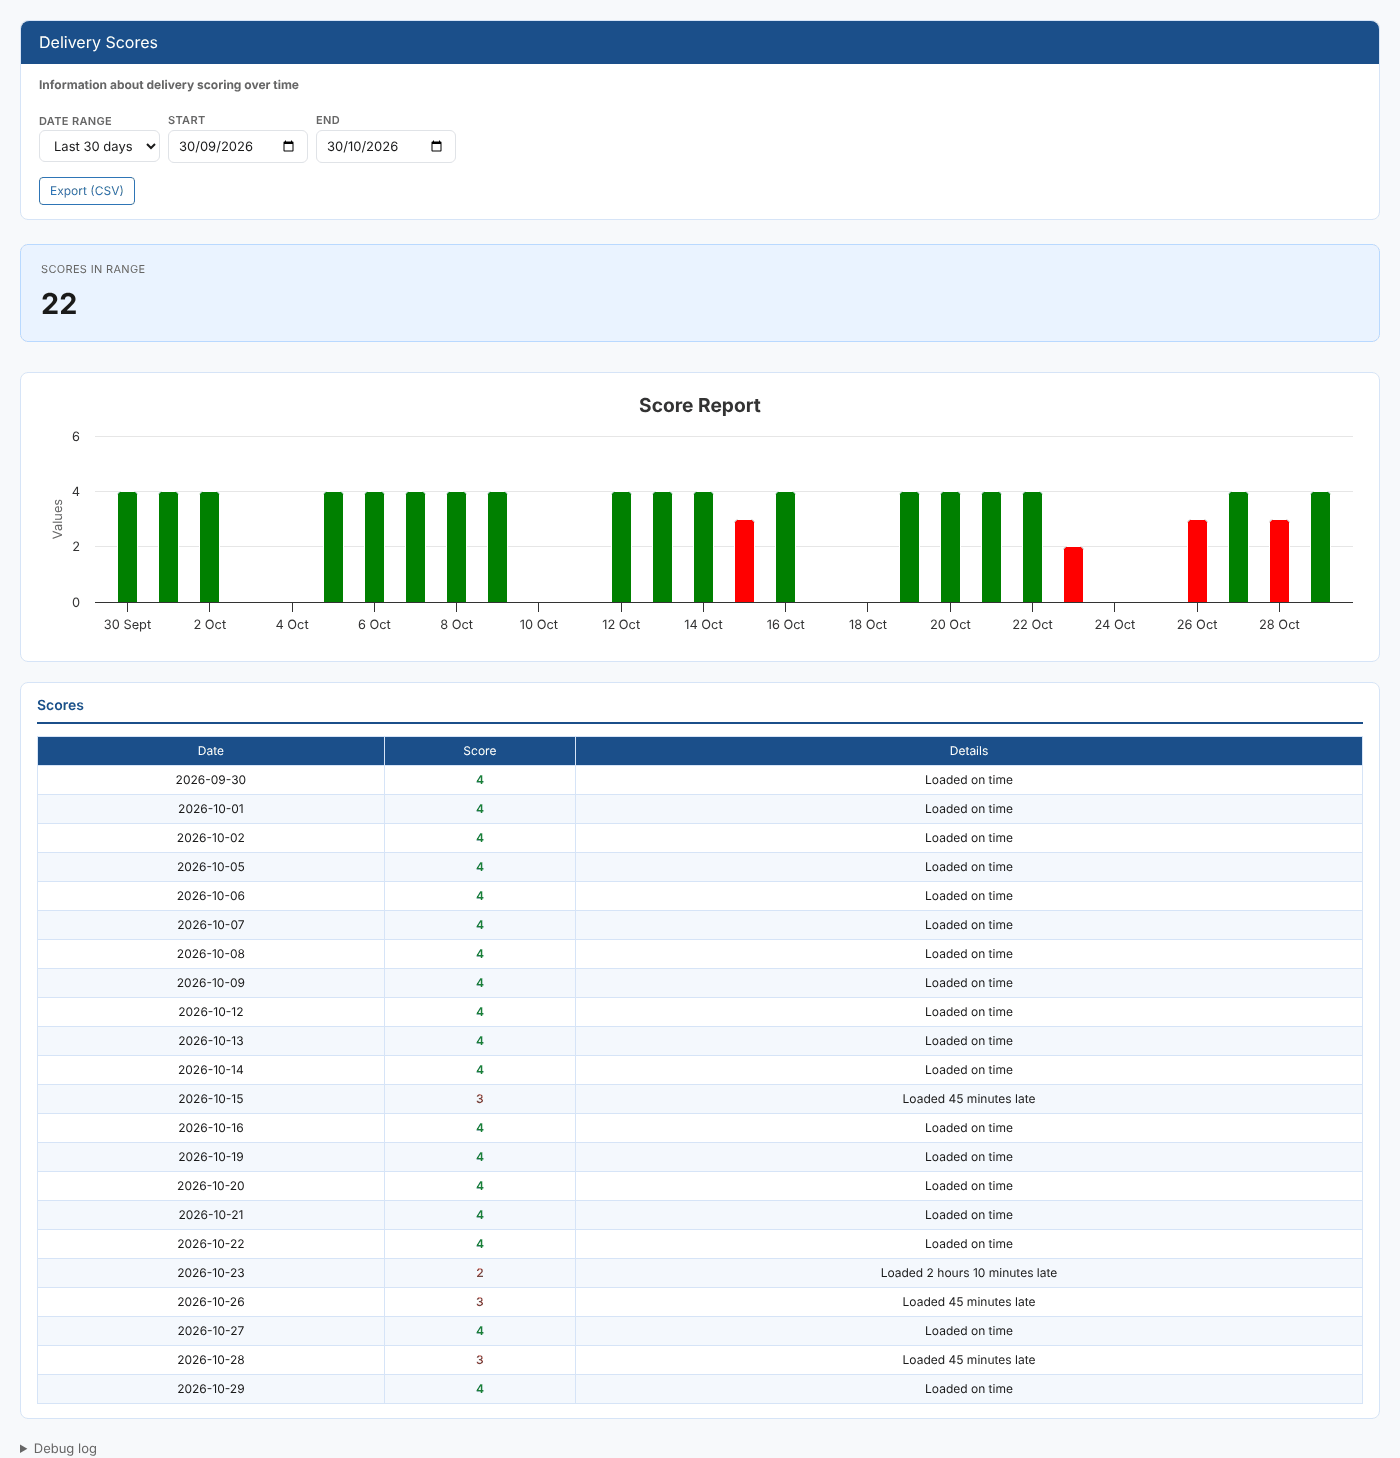
Delivery Scores
The daily delivery score of one dataset as a chart and table, with late days in red
Read about this report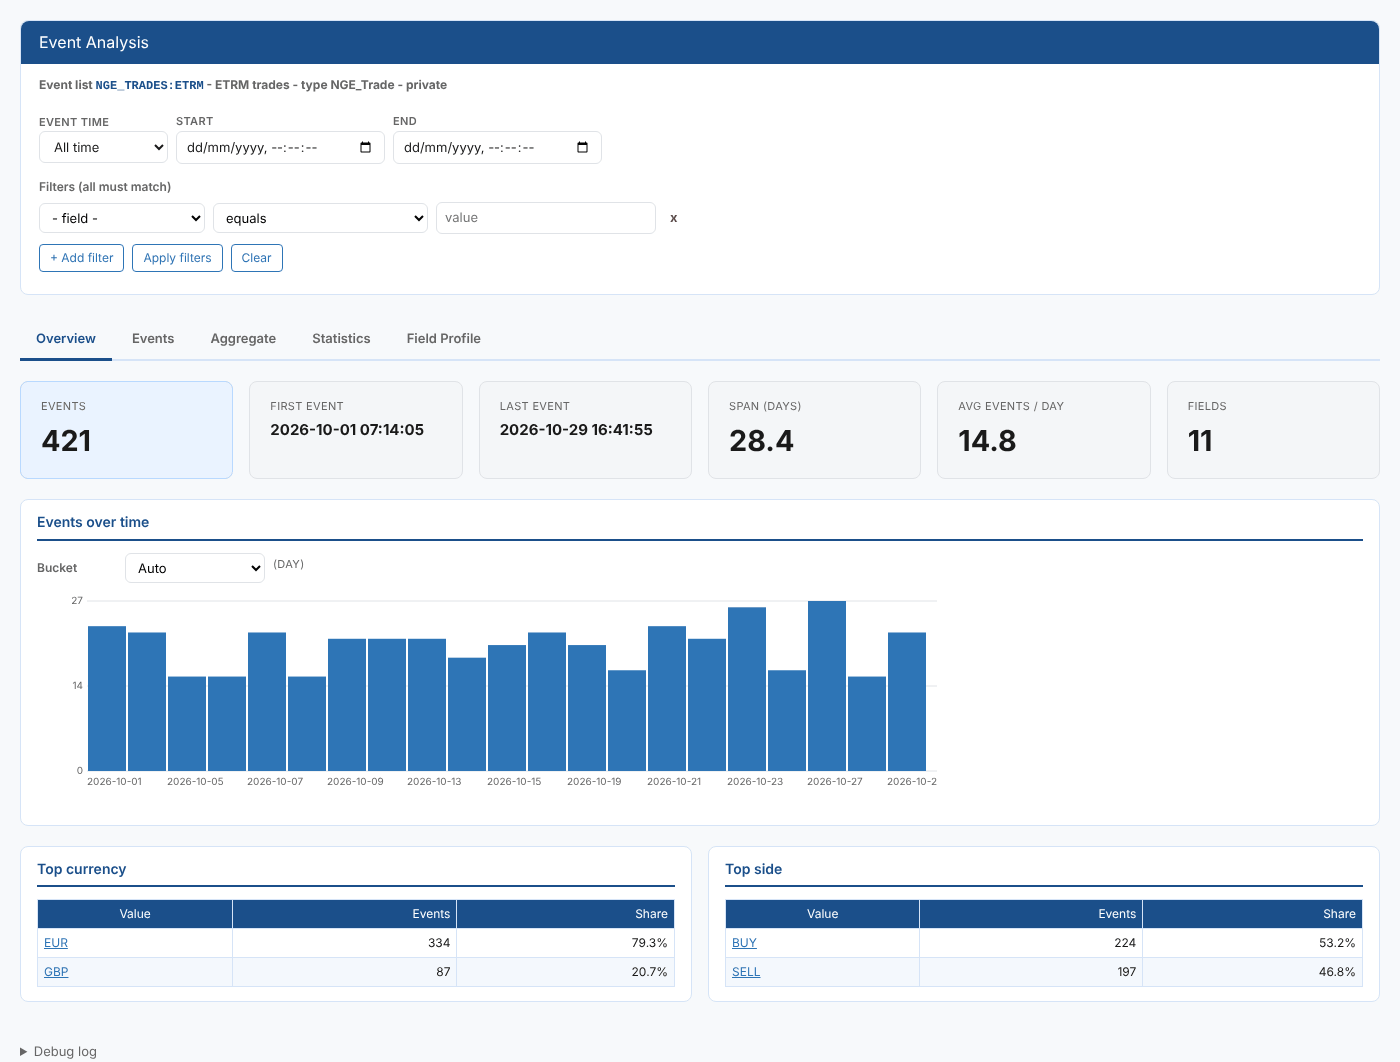
Event Analysis
Filter, group and profile the events in an event list, with counts, statistics and a pivot builder
Read about this report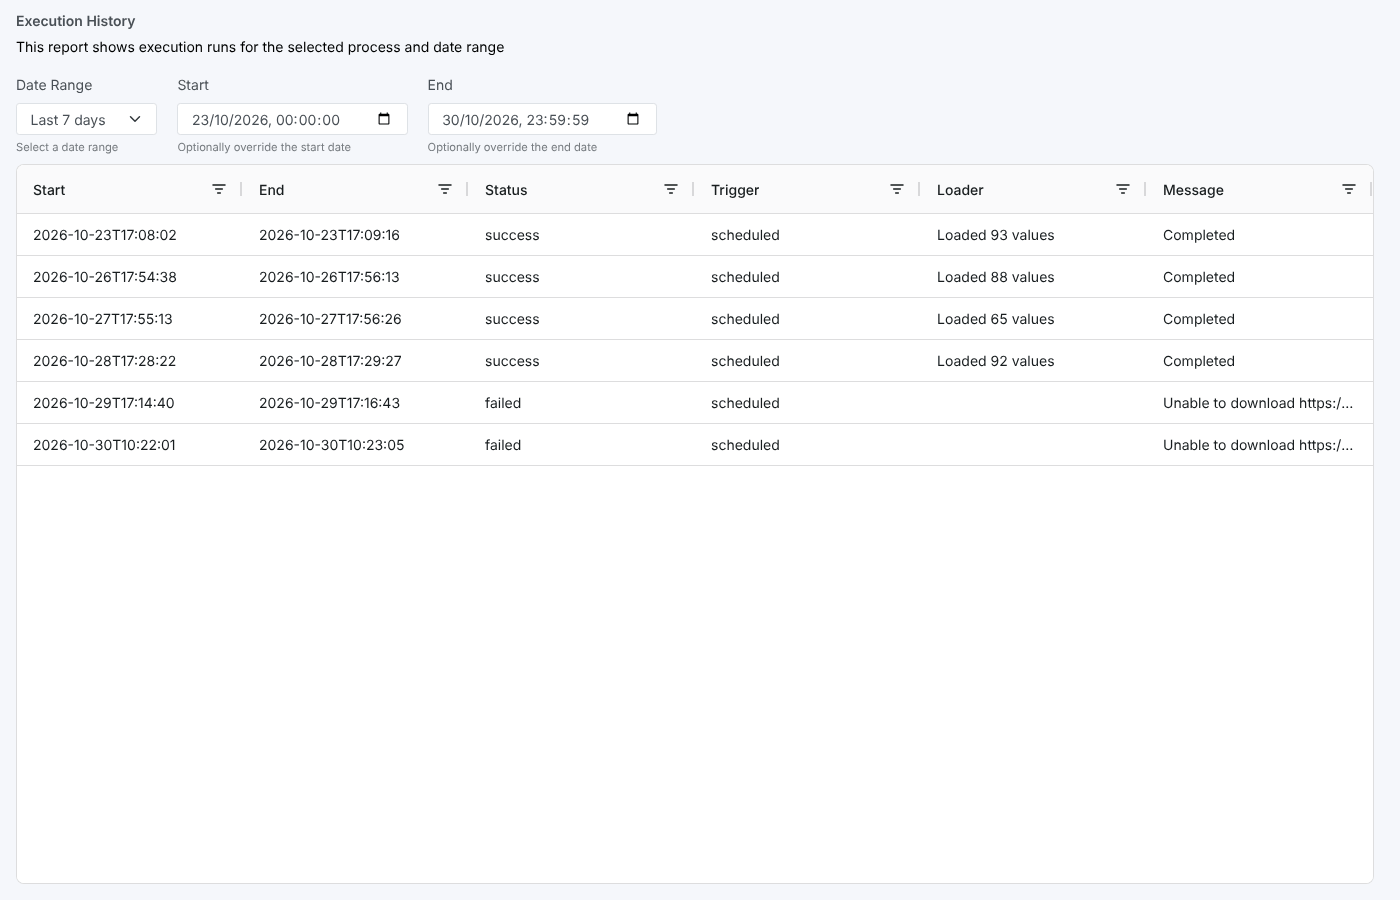
Execution History
Every run of one process in a date range, with its status and messages
Read about this report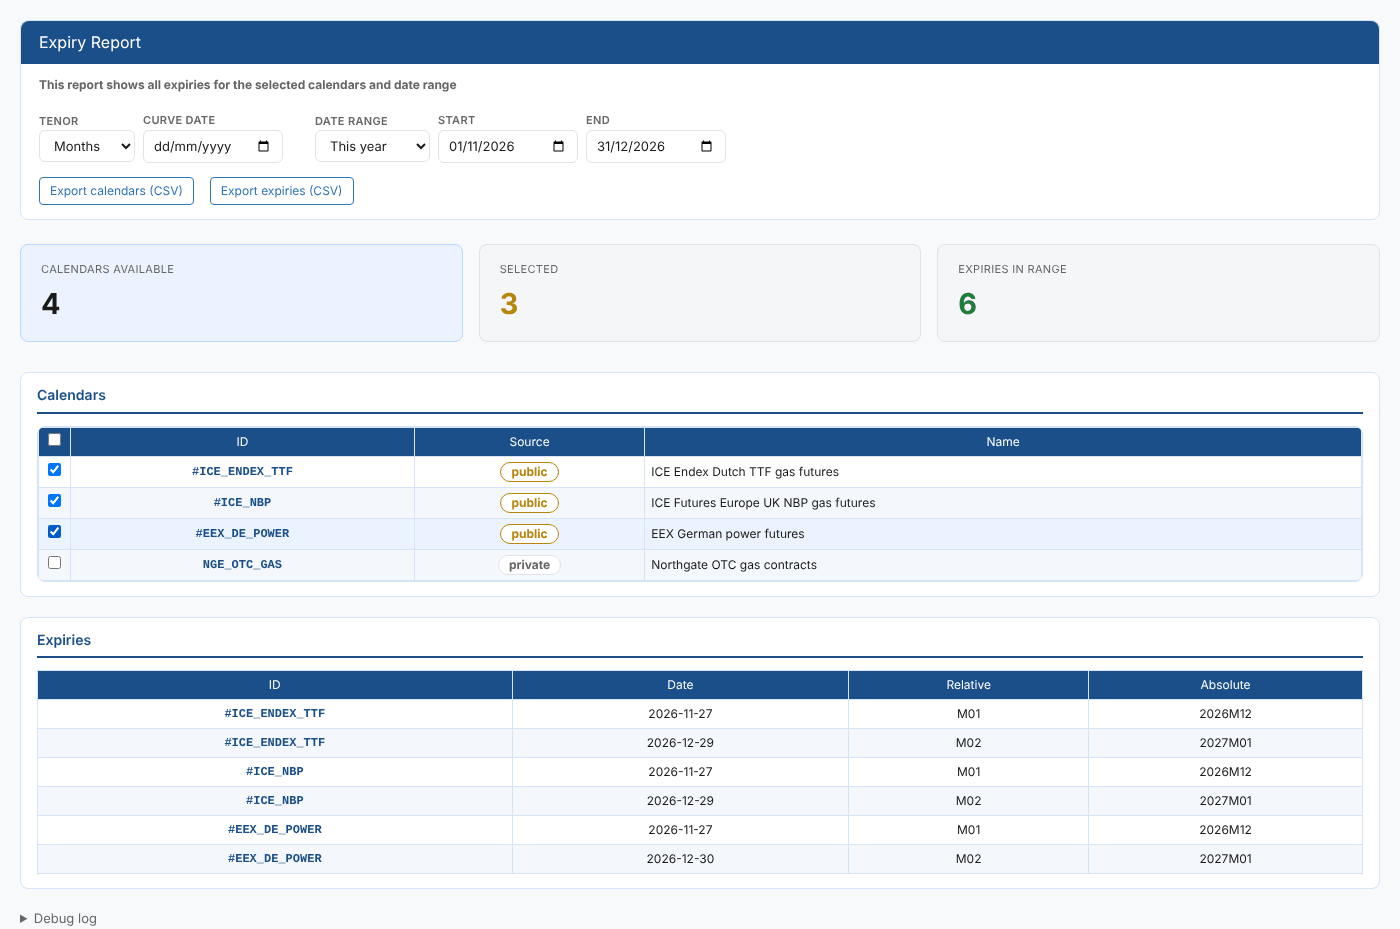
Expiry Report
When each contract expires in the expiry calendars you pick, with relative and absolute tenors
Read about this report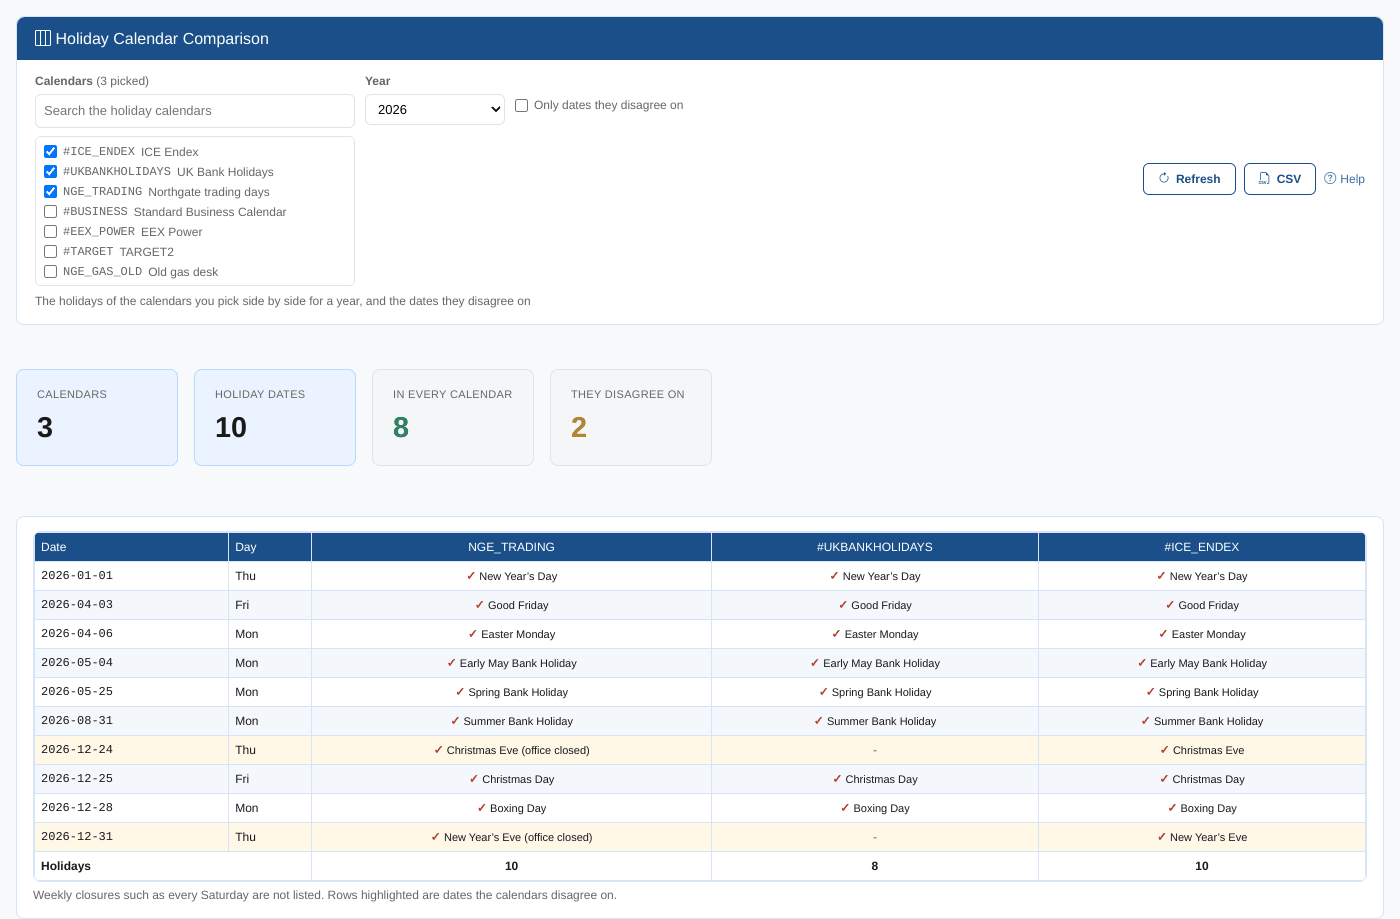
Holiday Calendar Comparison
The holidays of several calendars side by side for a year, and where they disagree
Read about this report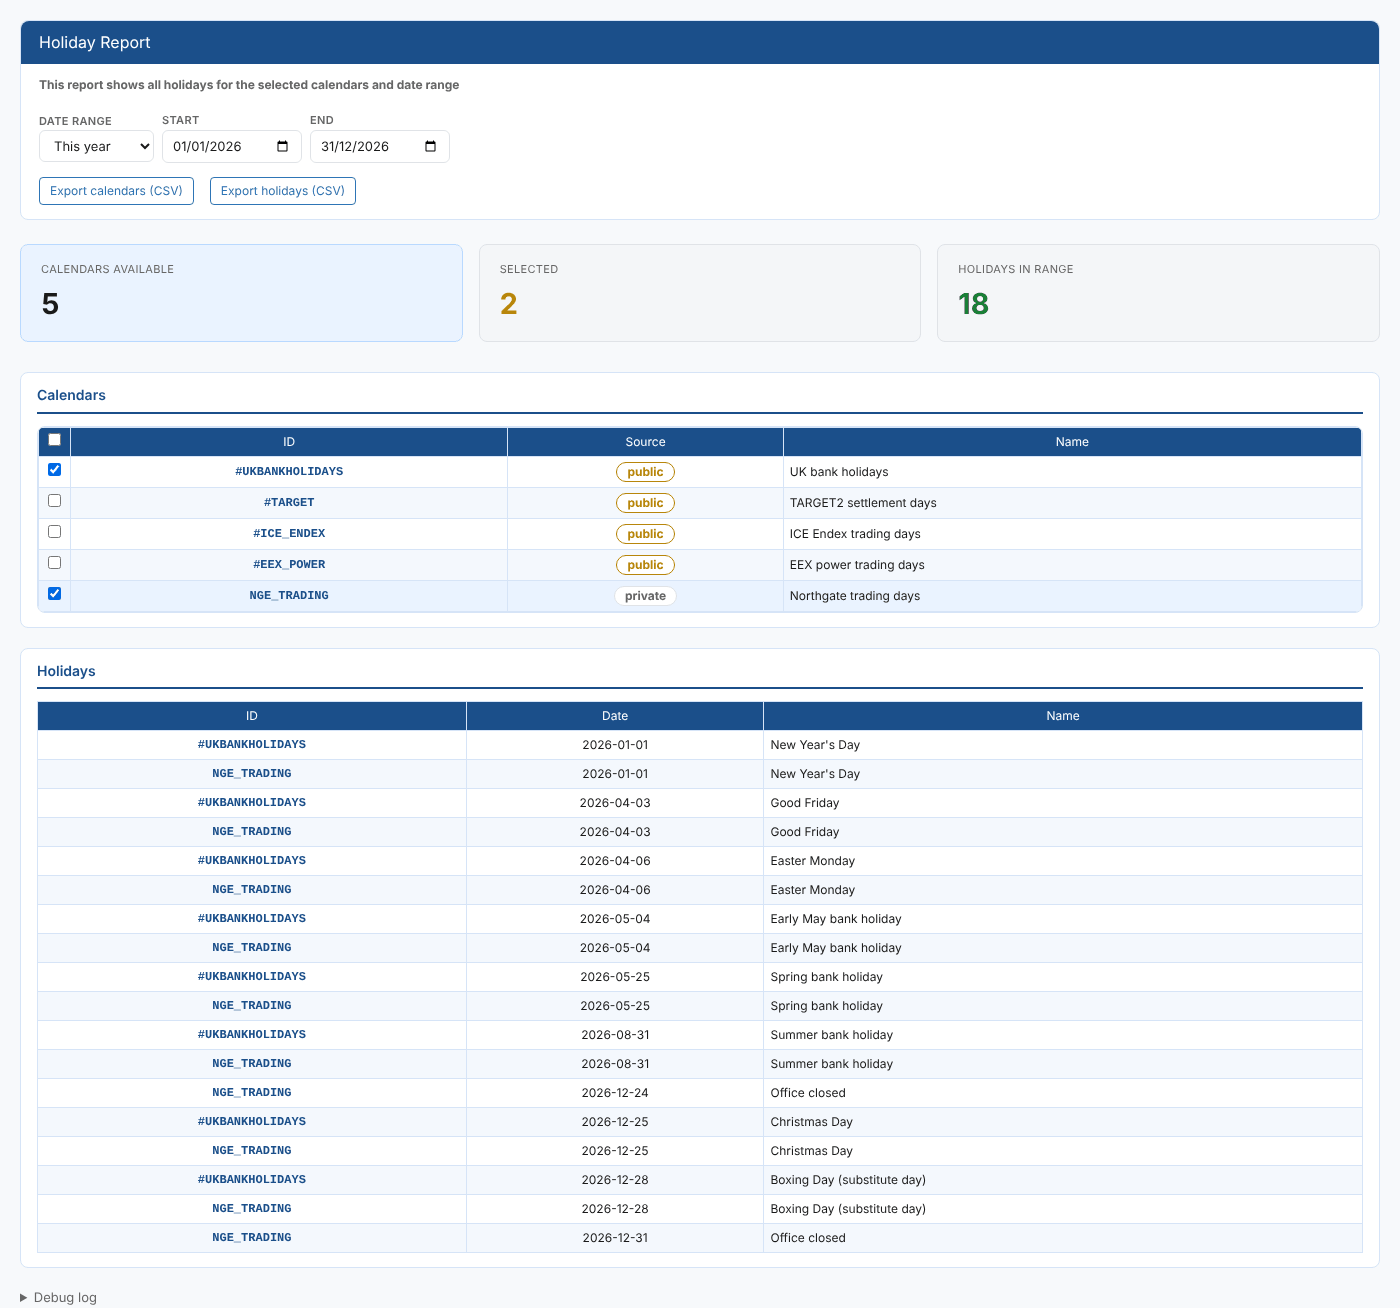
Holiday Report
The holidays of the holiday calendars you pick, with their names, for any date range
Read about this report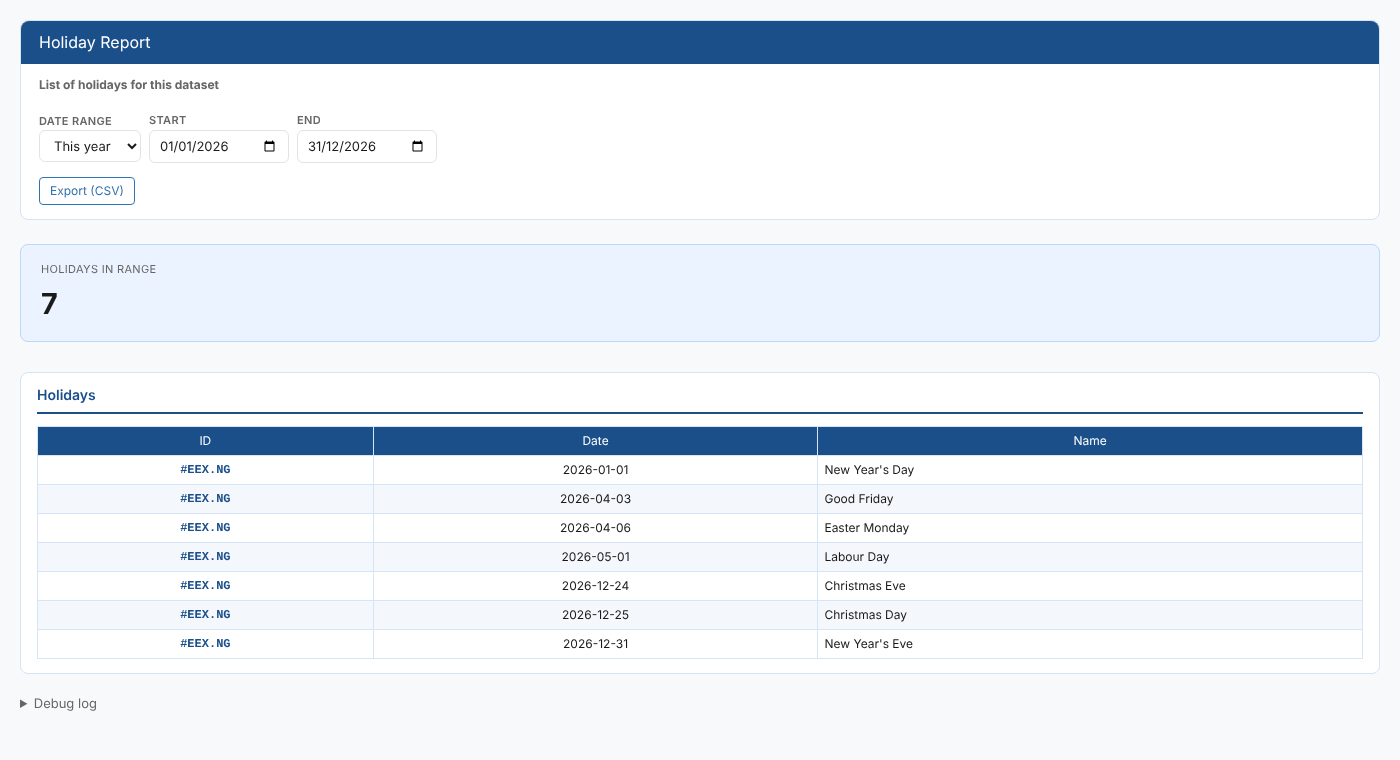
Holiday Report (dataset)
The holidays a dataset follows this year or next, from its own or its feed's calendar
Read about this report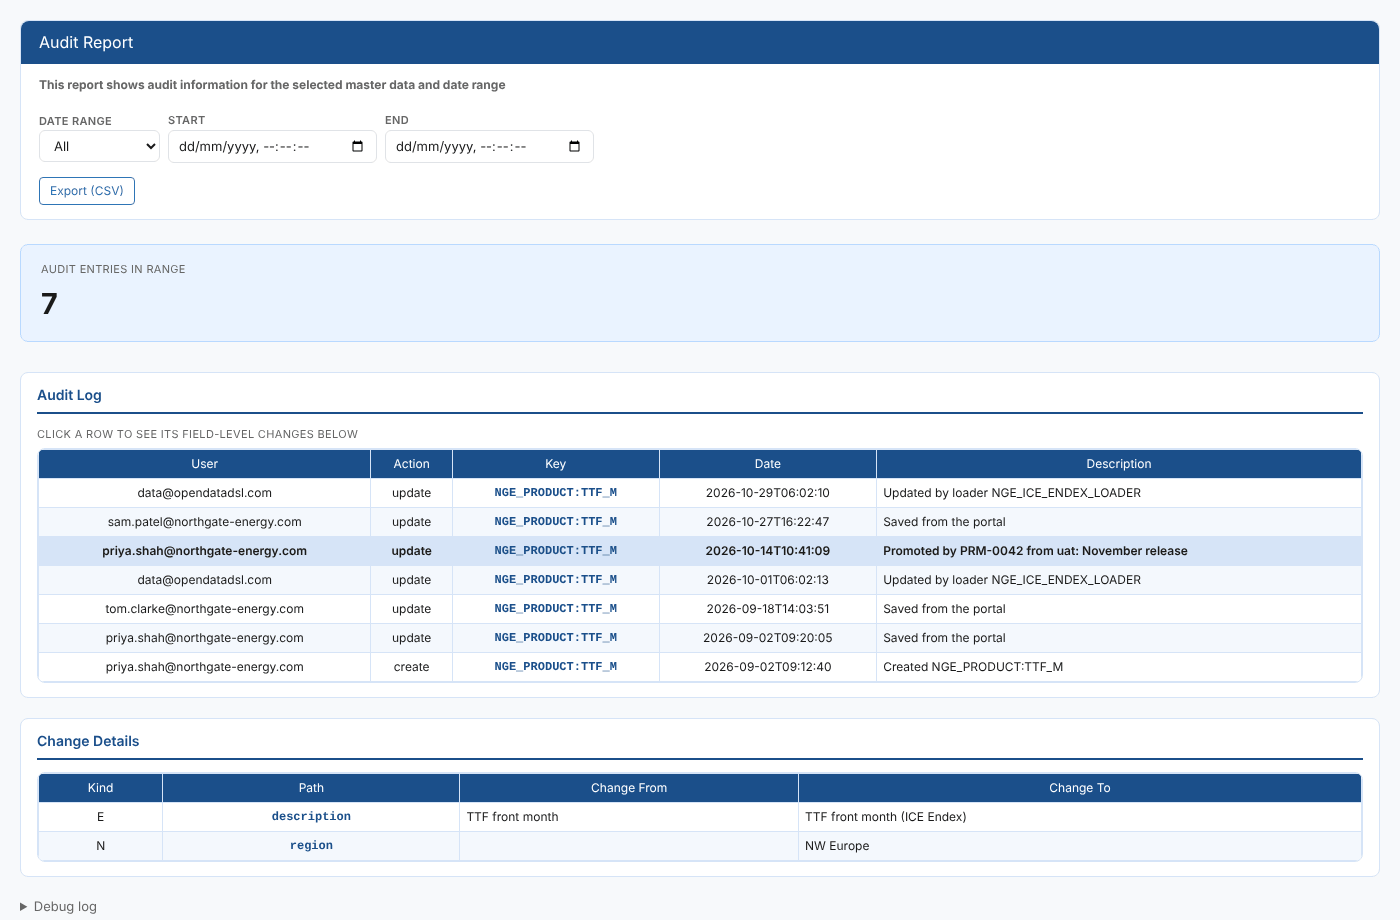
Item Audit Report
The full change history of one item, who changed it, when, and exactly which fields changed
Read about this report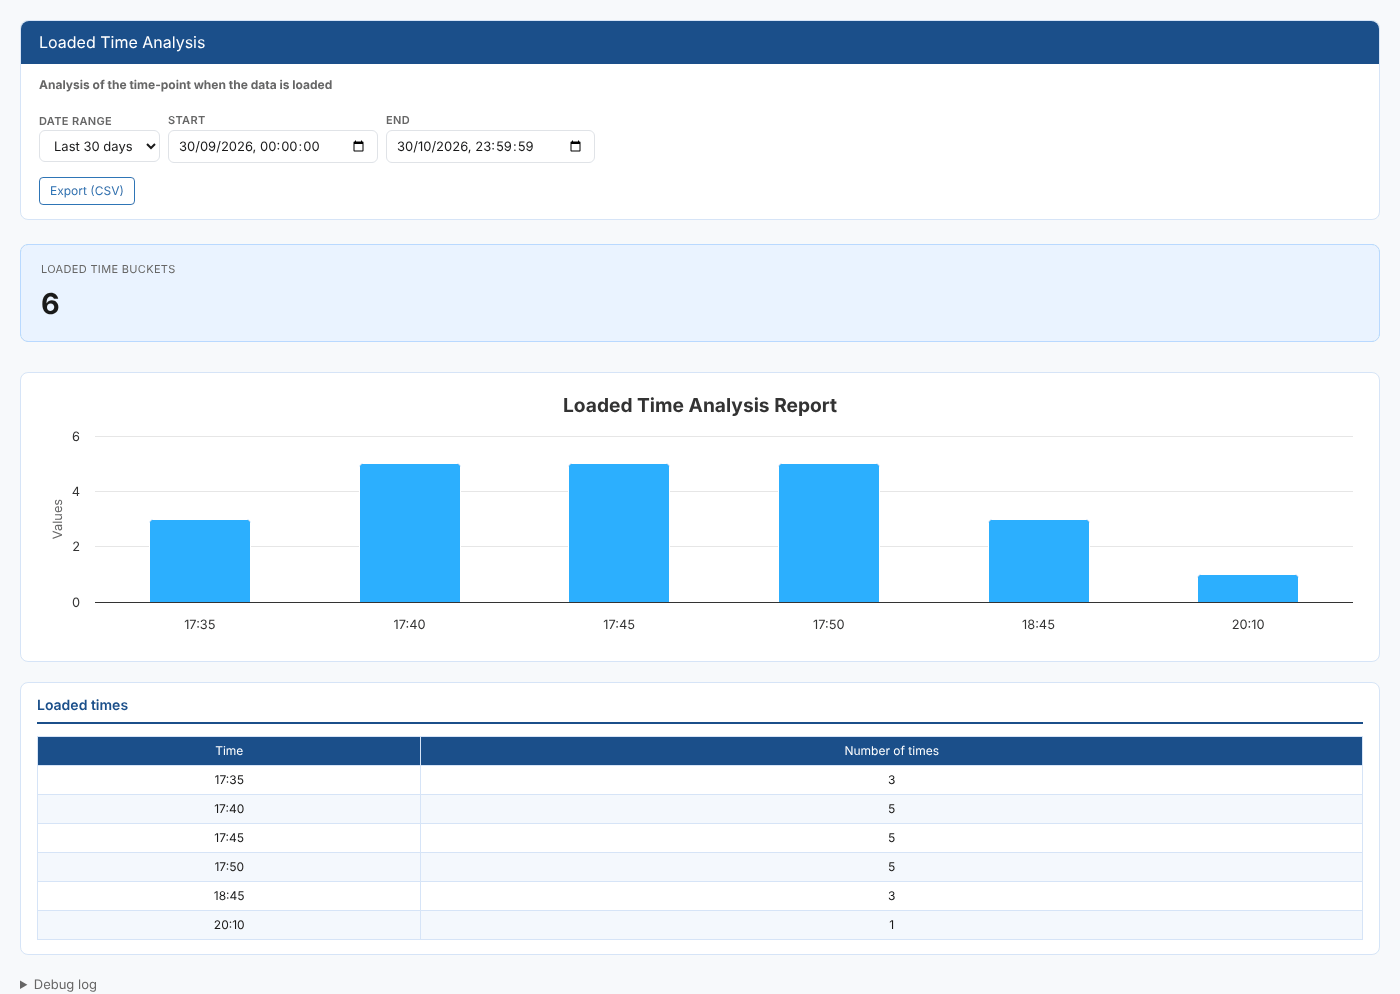
Loaded Time Analysis
What time of day one dataset actually loads, counted over any date range
Read about this report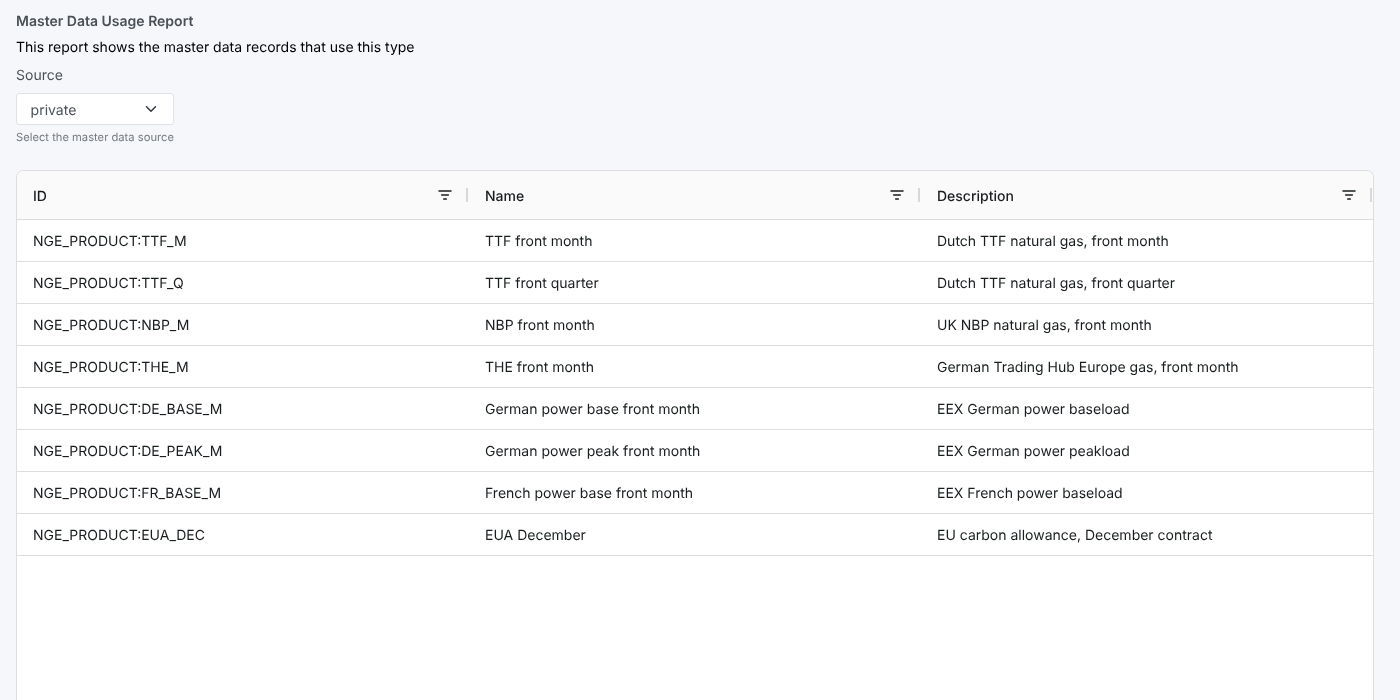
Master Data Usage Report
Every master data record that uses the selected type
Read about this report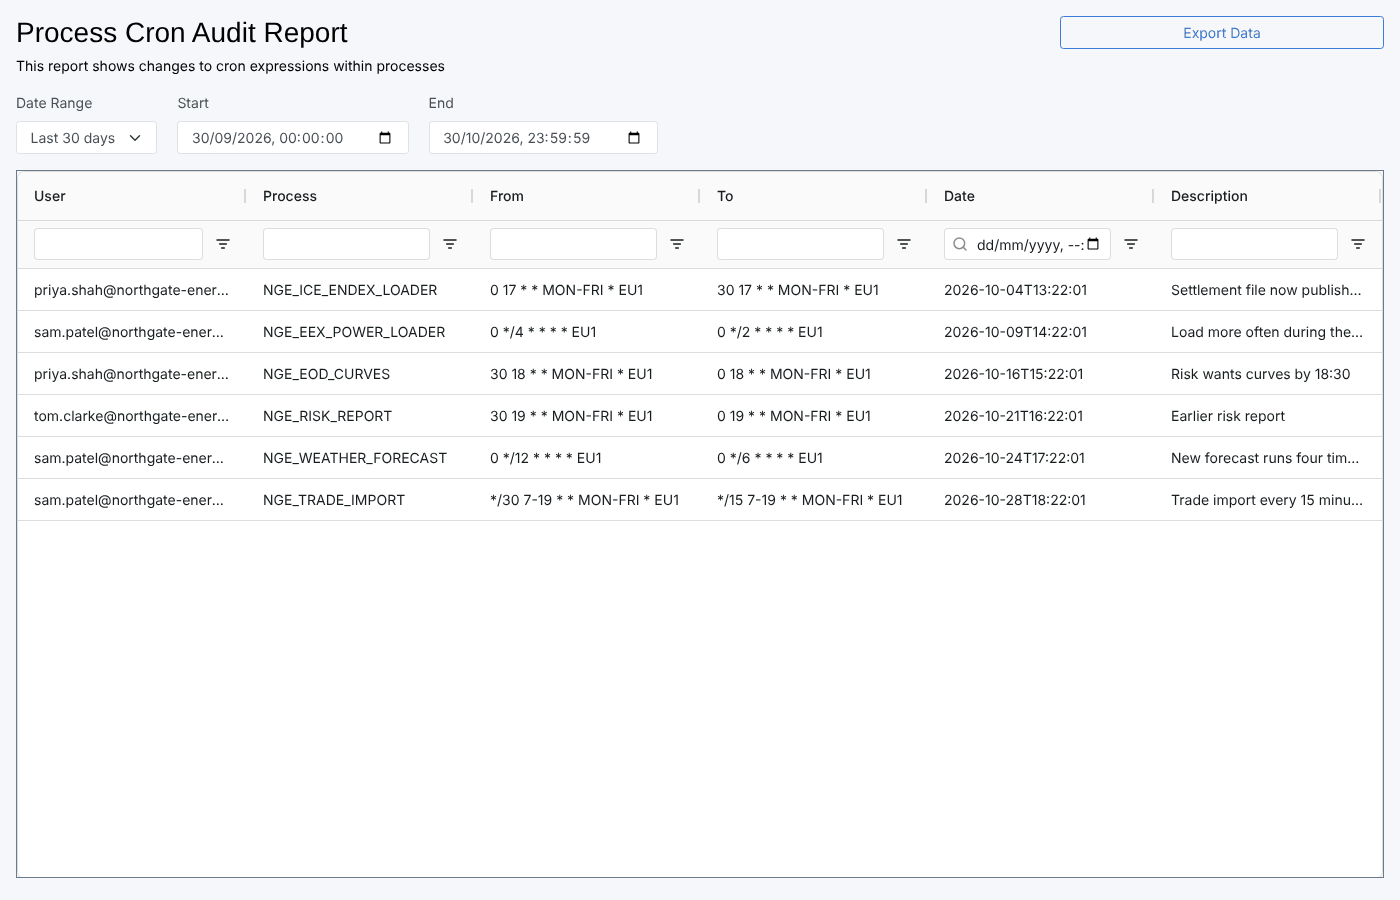
Process Cron Audit Report
Every change to a process schedule, who made it, and the schedule before and after
Read about this report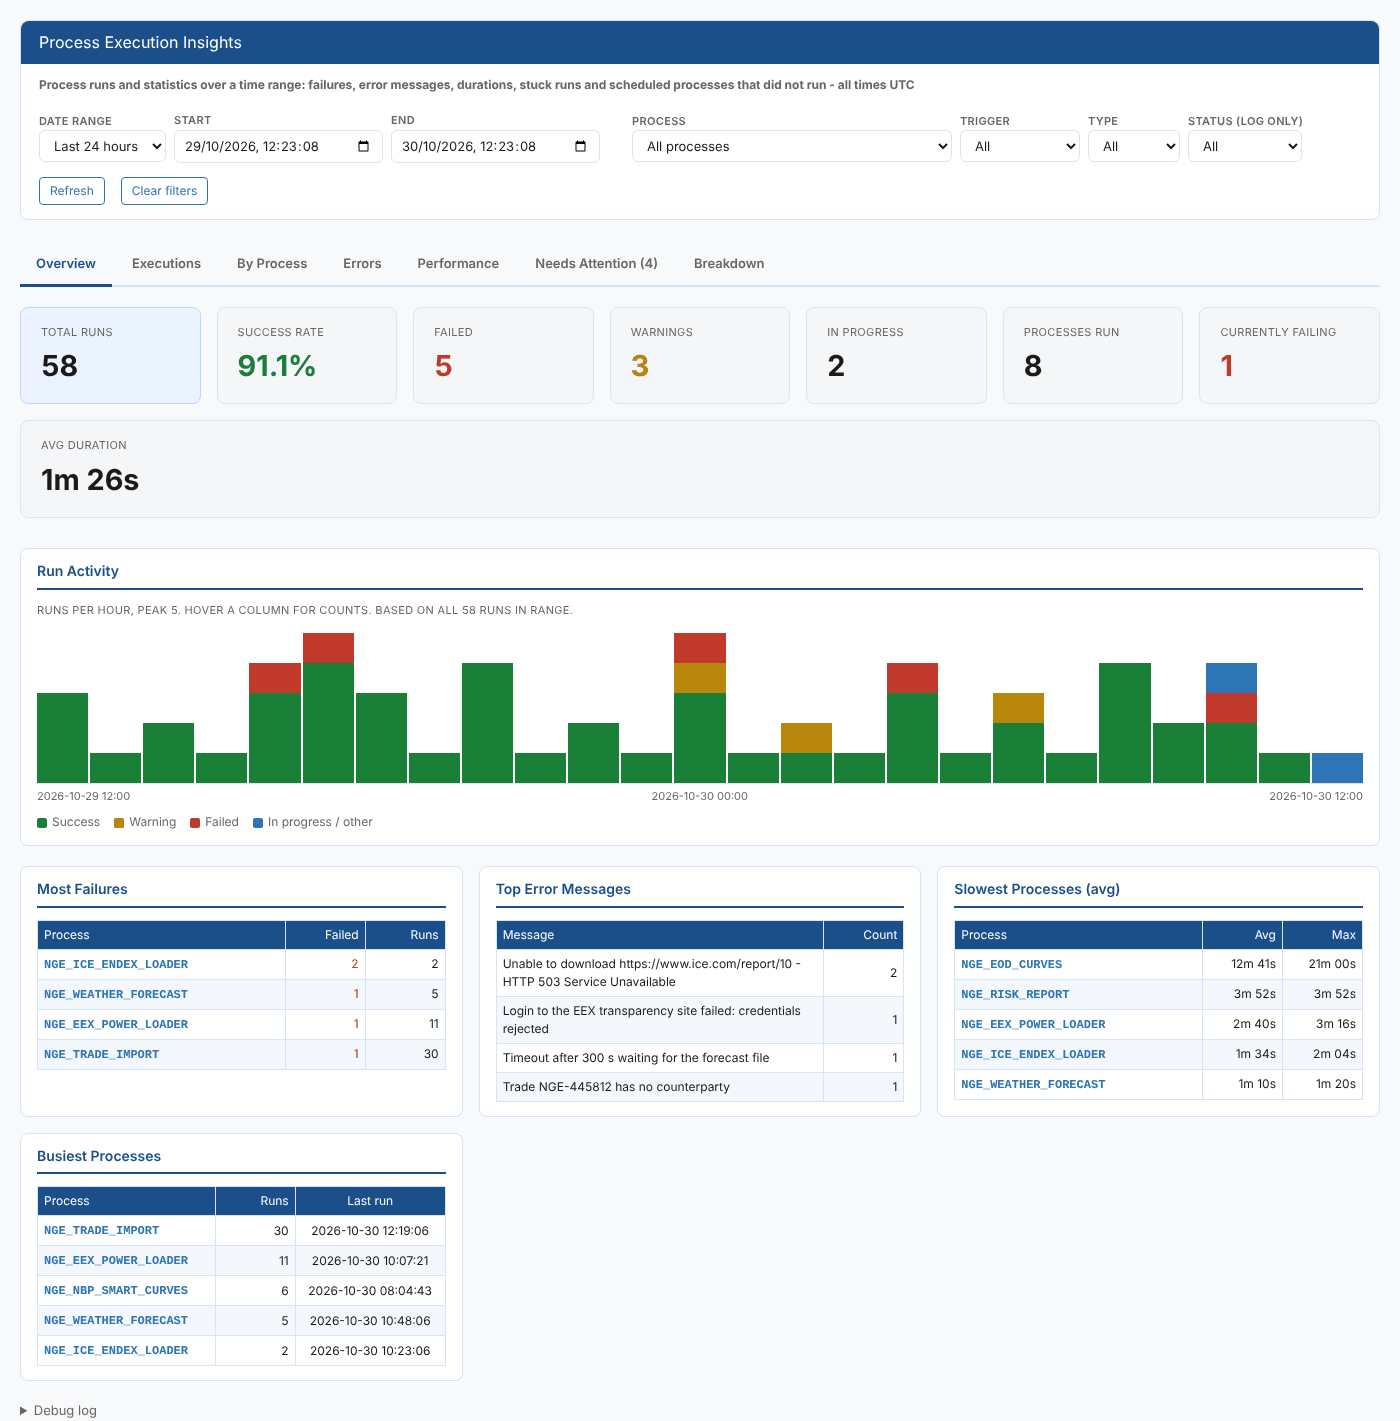
Process Execution Insights
Process runs at a glance, with failures, shared error messages, slow and stuck runs and schedules that did not run
Read about this report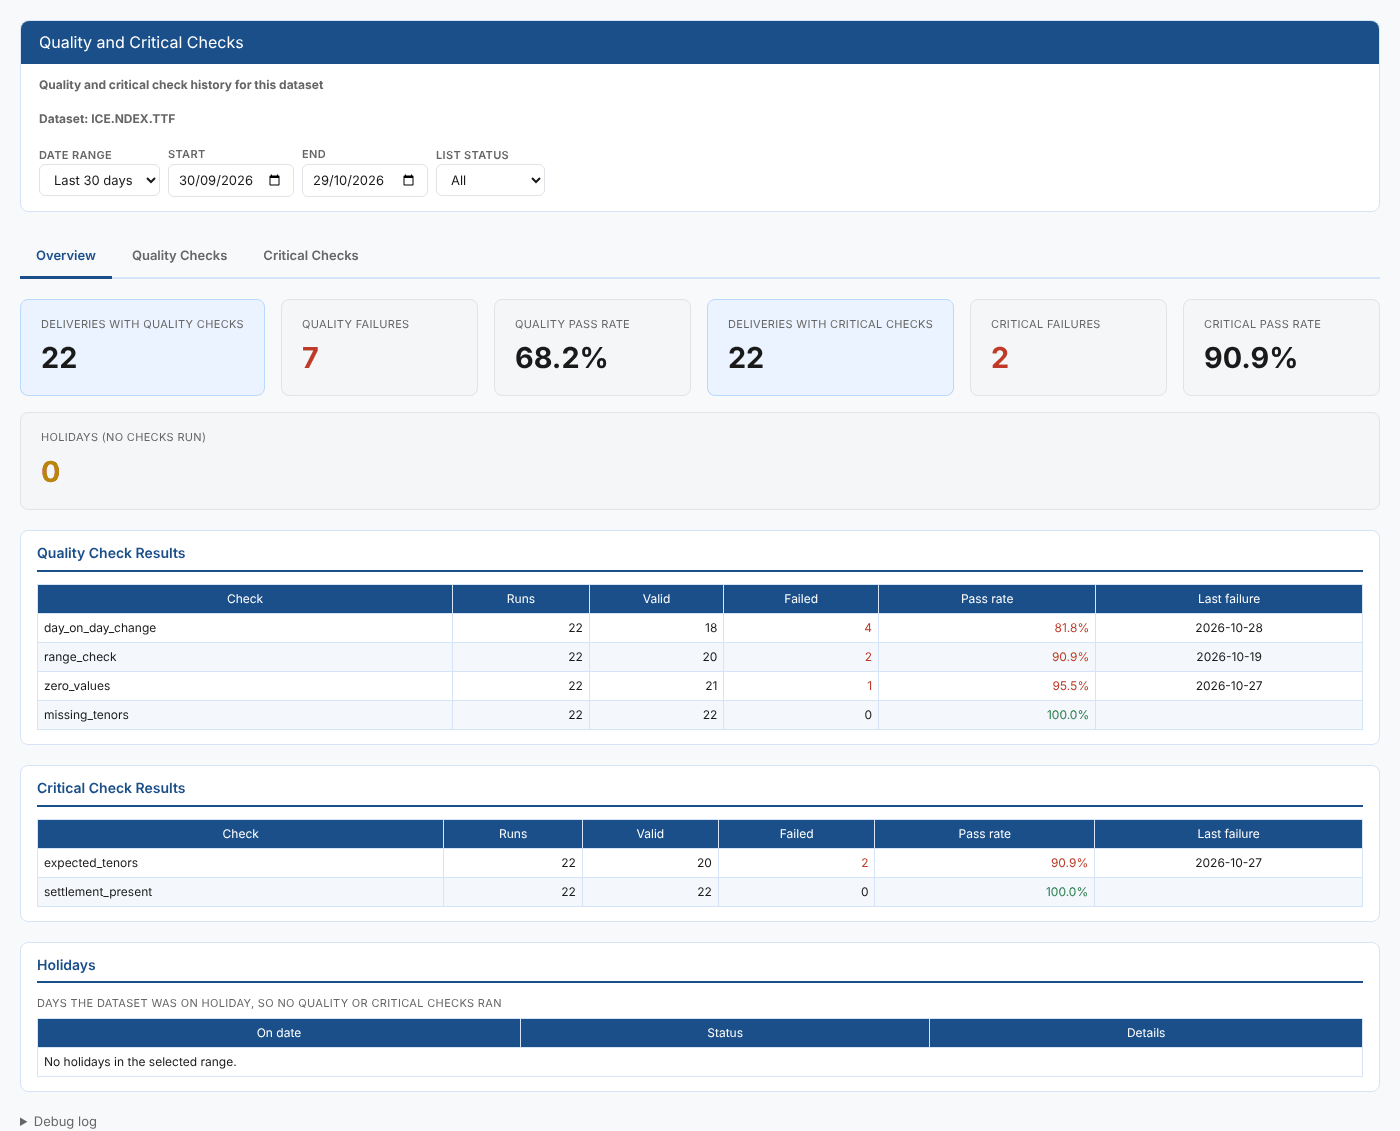
Quality and Critical Checks
The check history of one dataset, with pass rates per check and the log of every delivery
Read about this report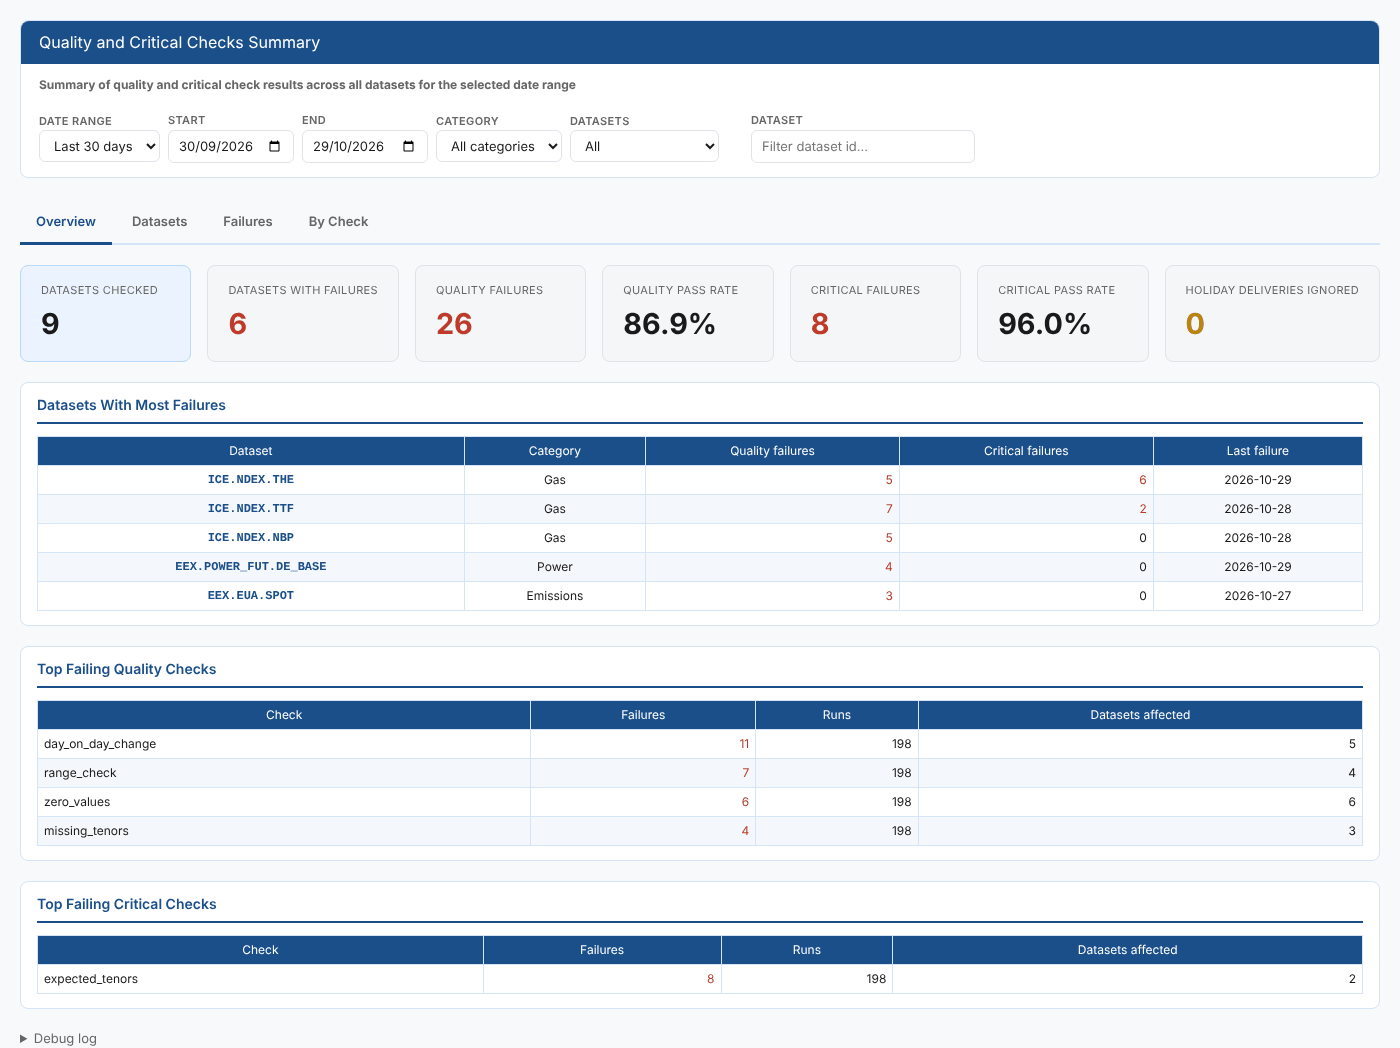
Quality and Critical Checks Summary
Quality and critical check results across every dataset, worst first, for any date range
Read about this report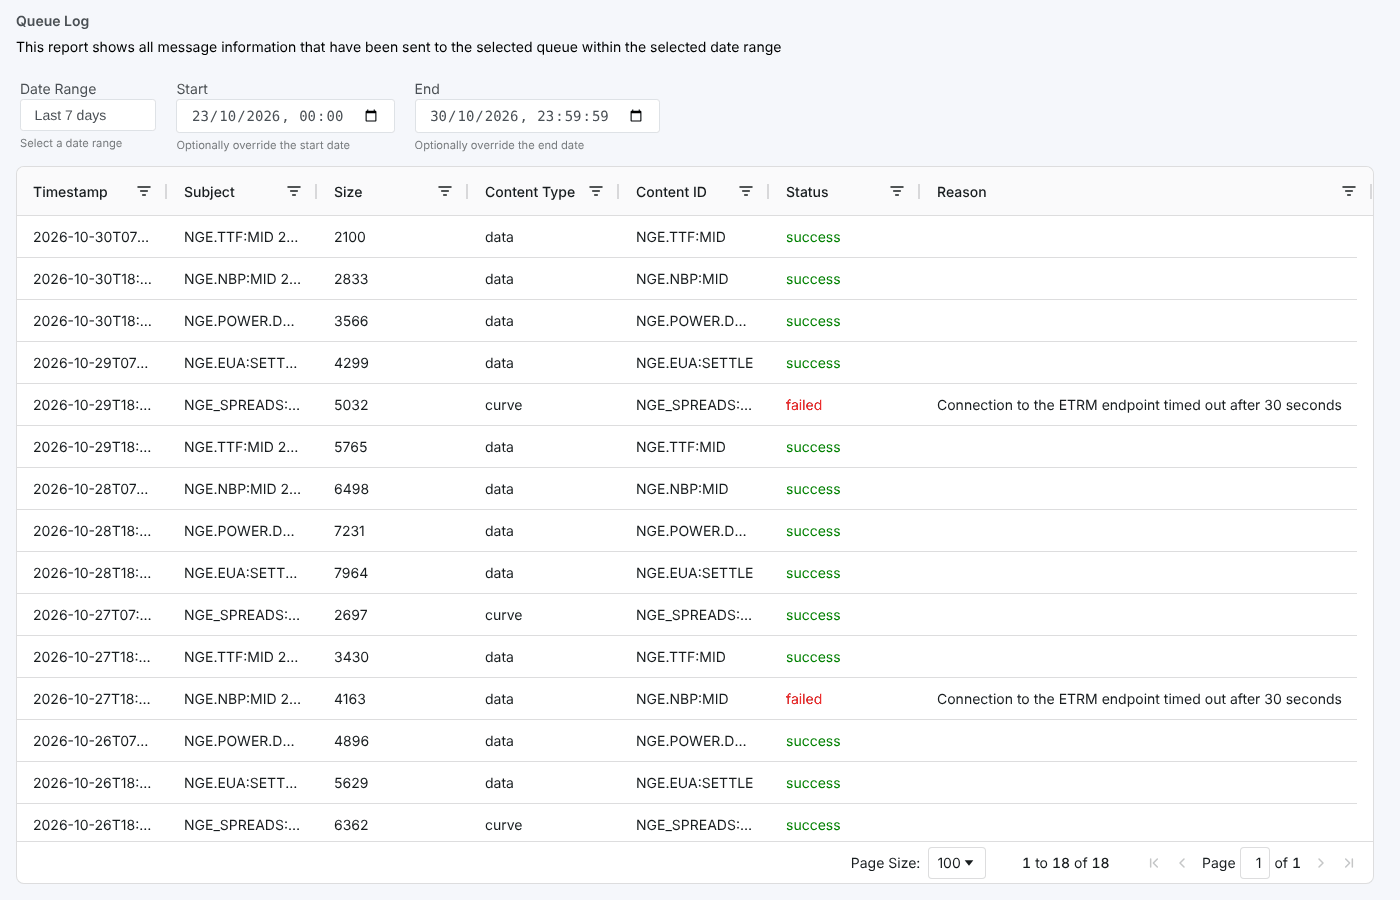
Queue Log
Every message sent to a queue, with its status and failure reason
Read about this report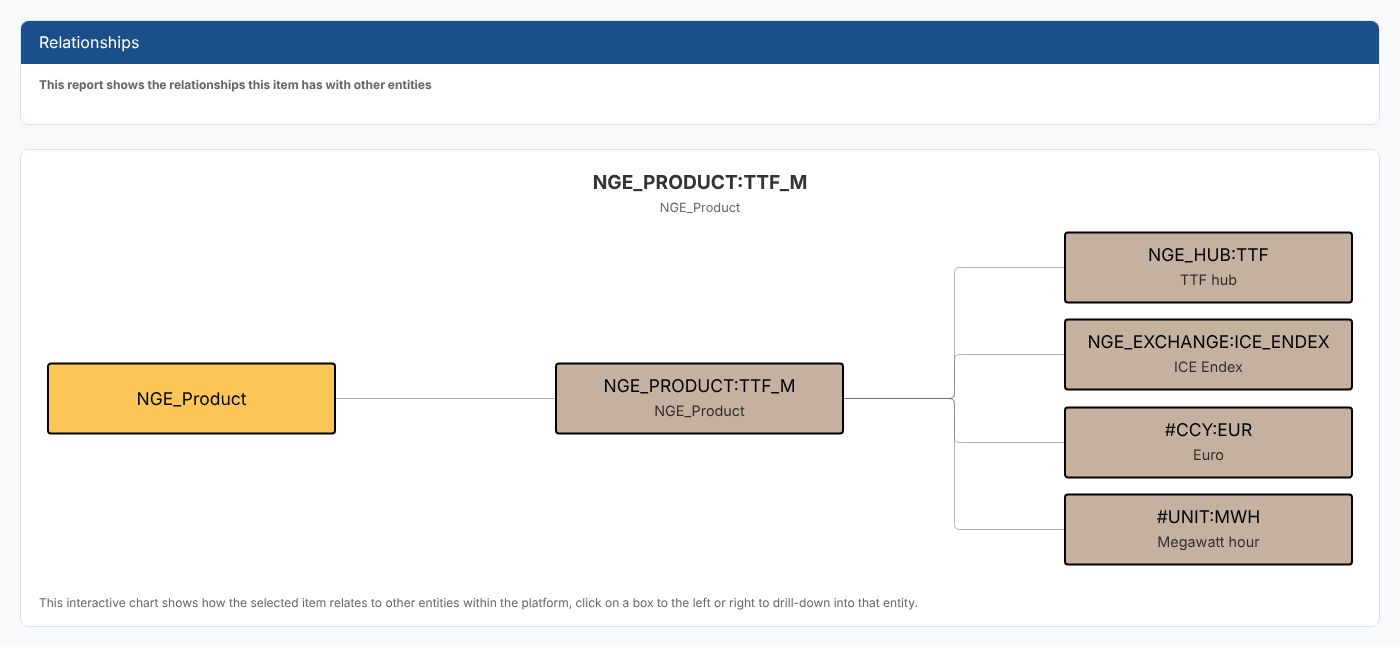
Relationships
A clickable chart of what an item depends on and what depends on it
Read about this report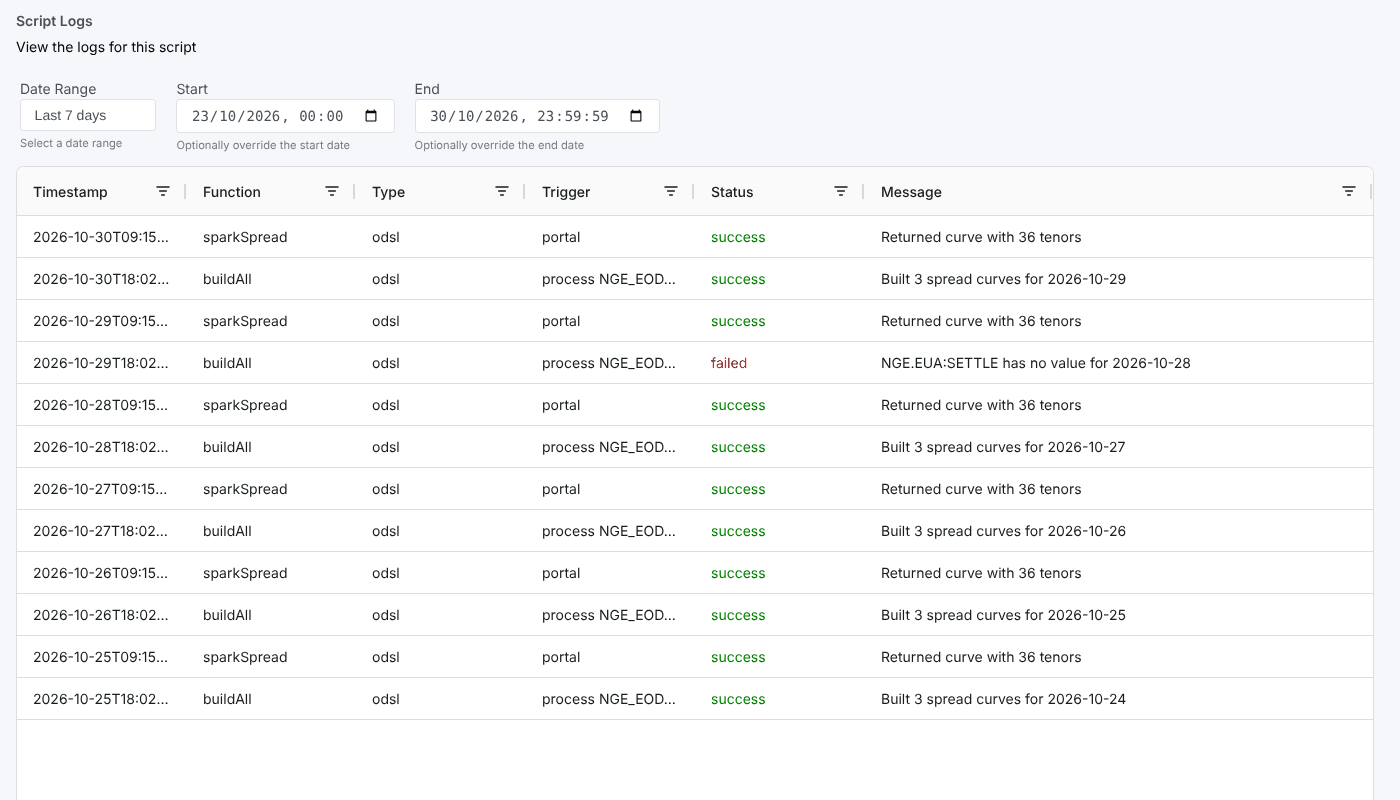
Script Logs
The logged runs of a script, with what triggered them and how they ended
Read about this report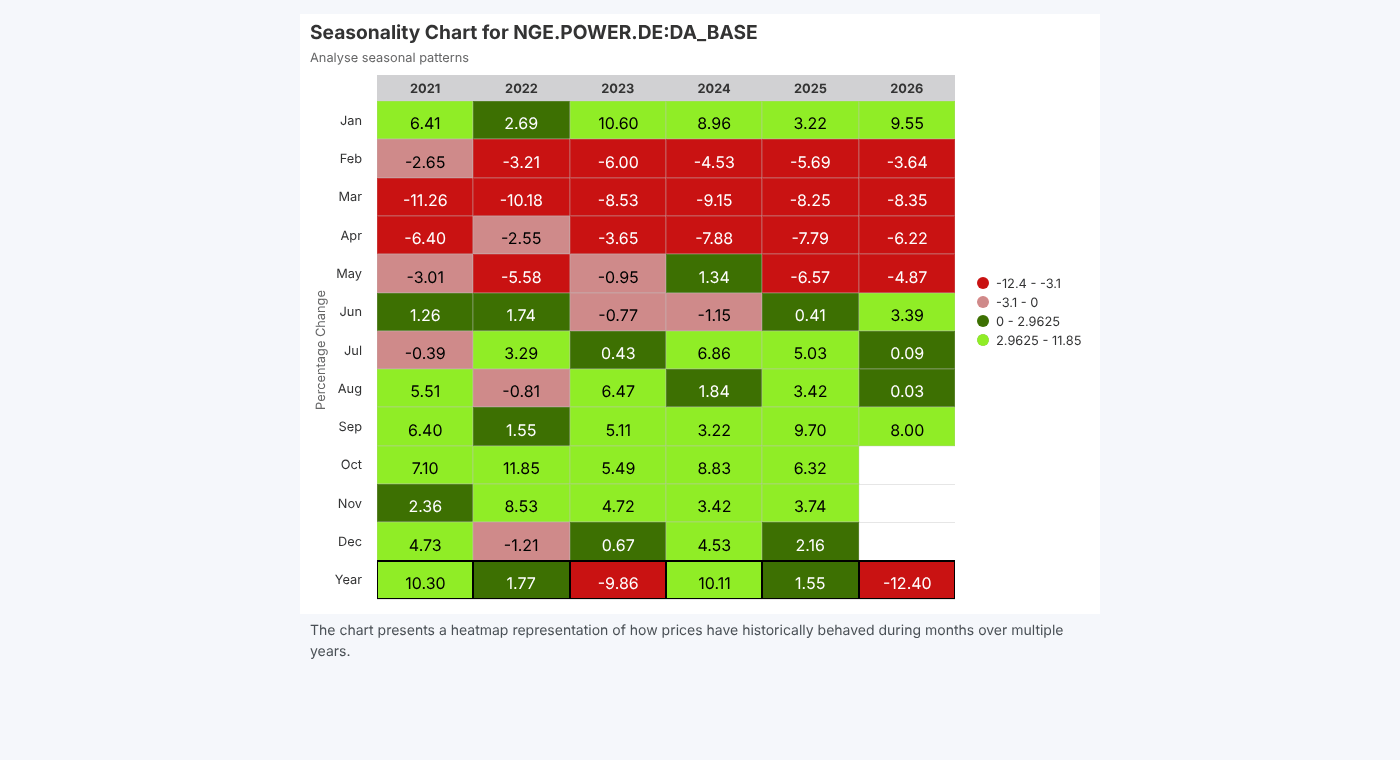
Seasonality Chart
Month by month and yearly price changes as a heatmap, to spot seasonal patterns in a timeseries or curve tenor
Read about this report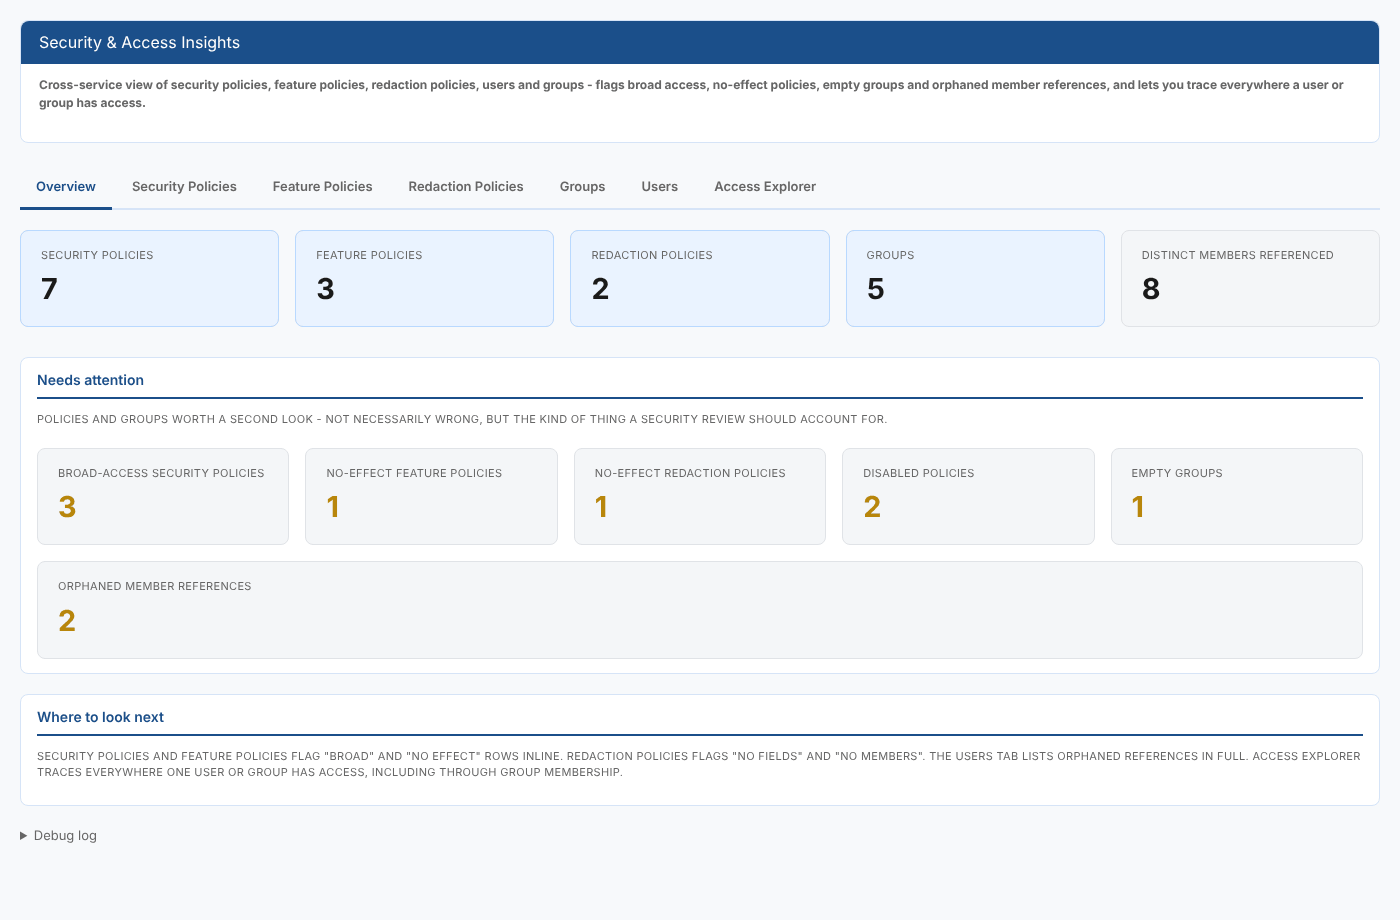
Security & Access Insights
A security review in one place, with broad access, policies that do nothing, empty groups and departed users flagged, and every access a person has traced
Read about this report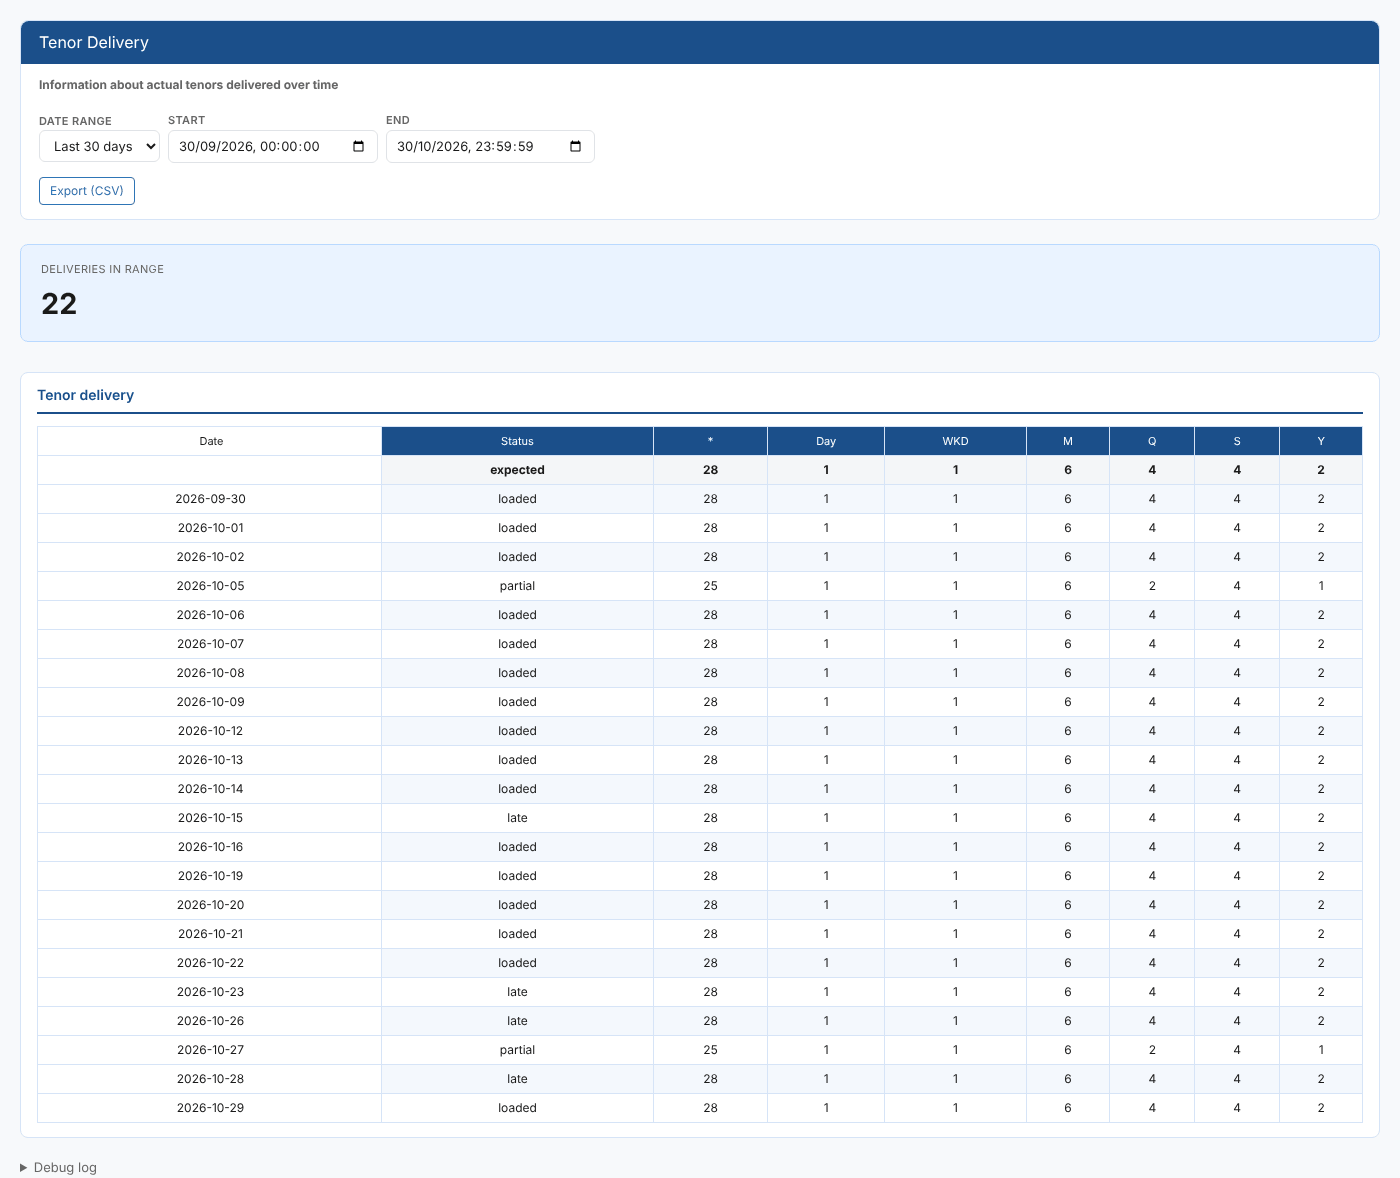
Tenor Delivery
The tenors one dataset delivered each day, by tenor type, against what was expected
Read about this report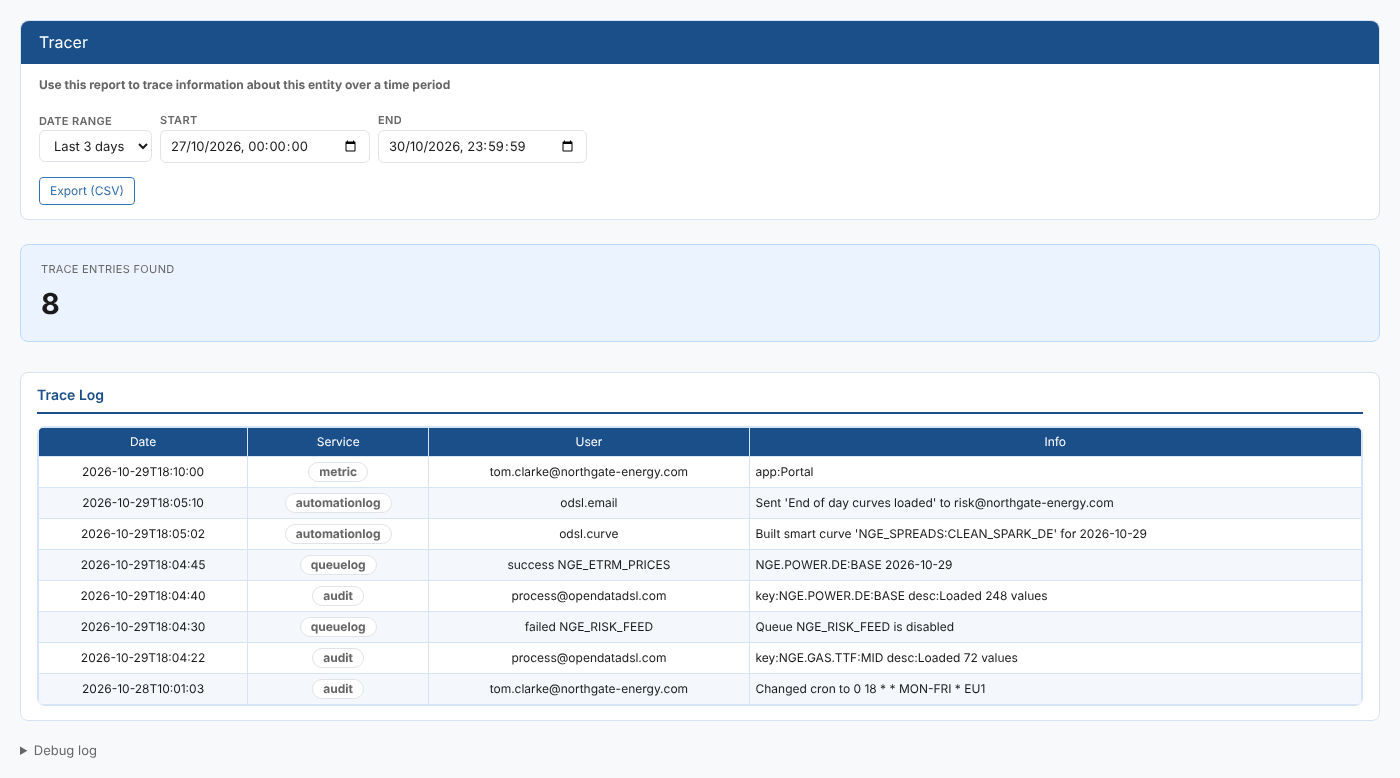
Tracer
Audit, usage, automation and queue activity for an item in one log
Read about this report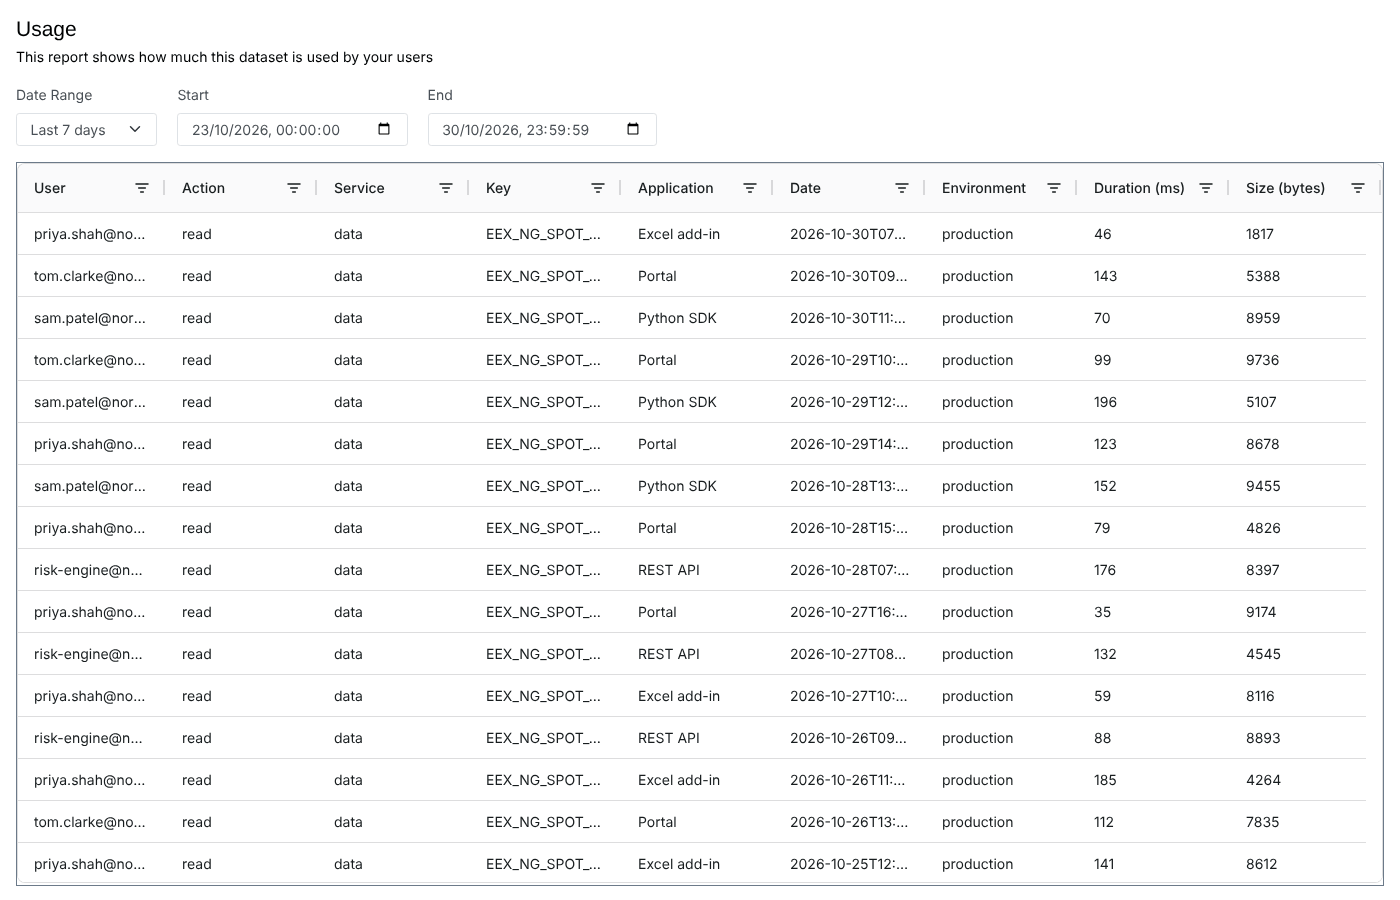
Usage (dataset)
Who reads a dataset's data, from which application, how often and how fast
Read about this report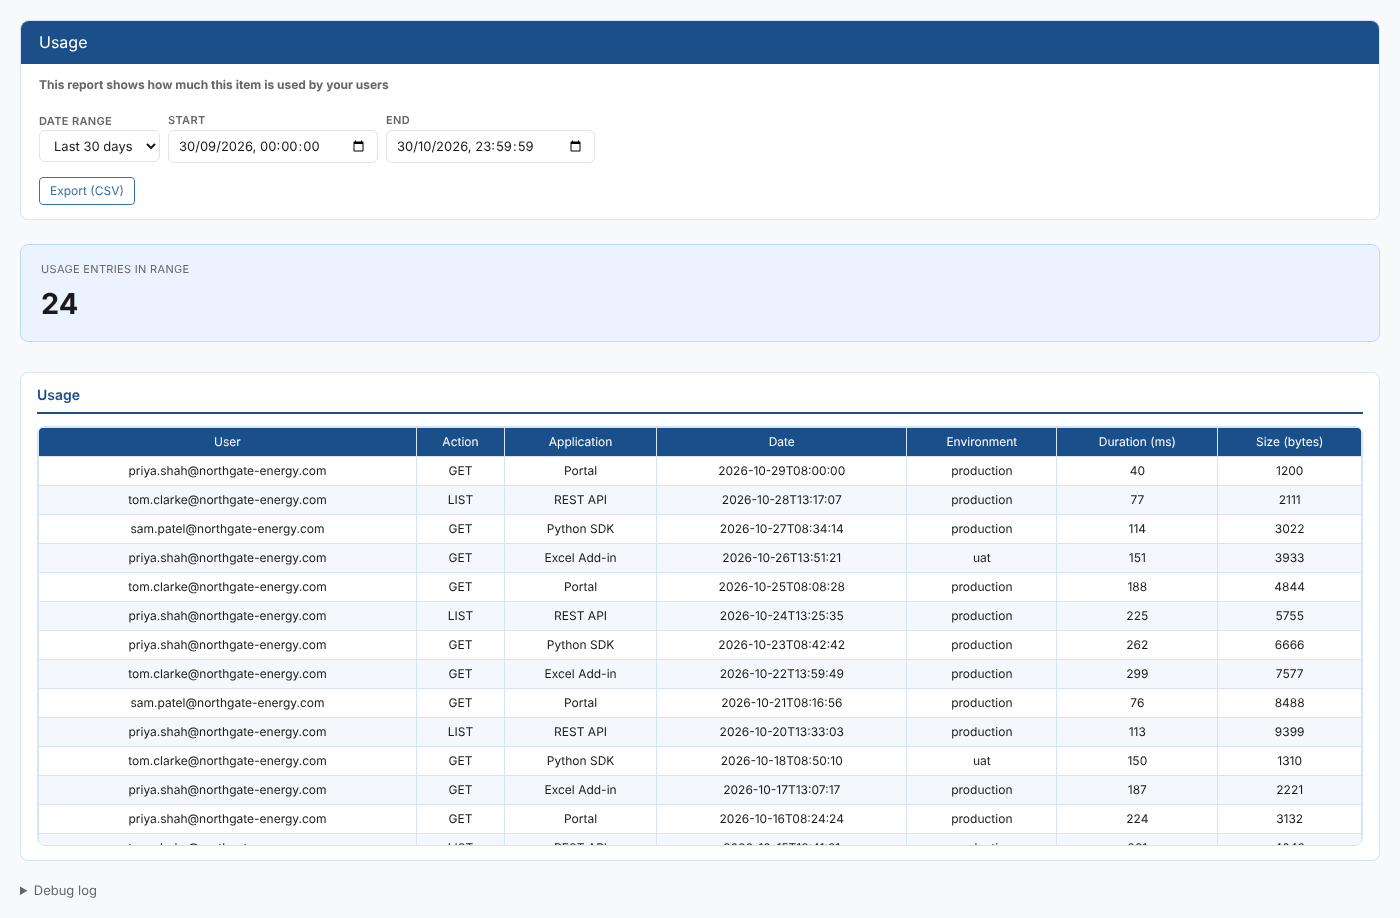
Usage (item)
Who has used the selected item, when, and from which application
Read about this report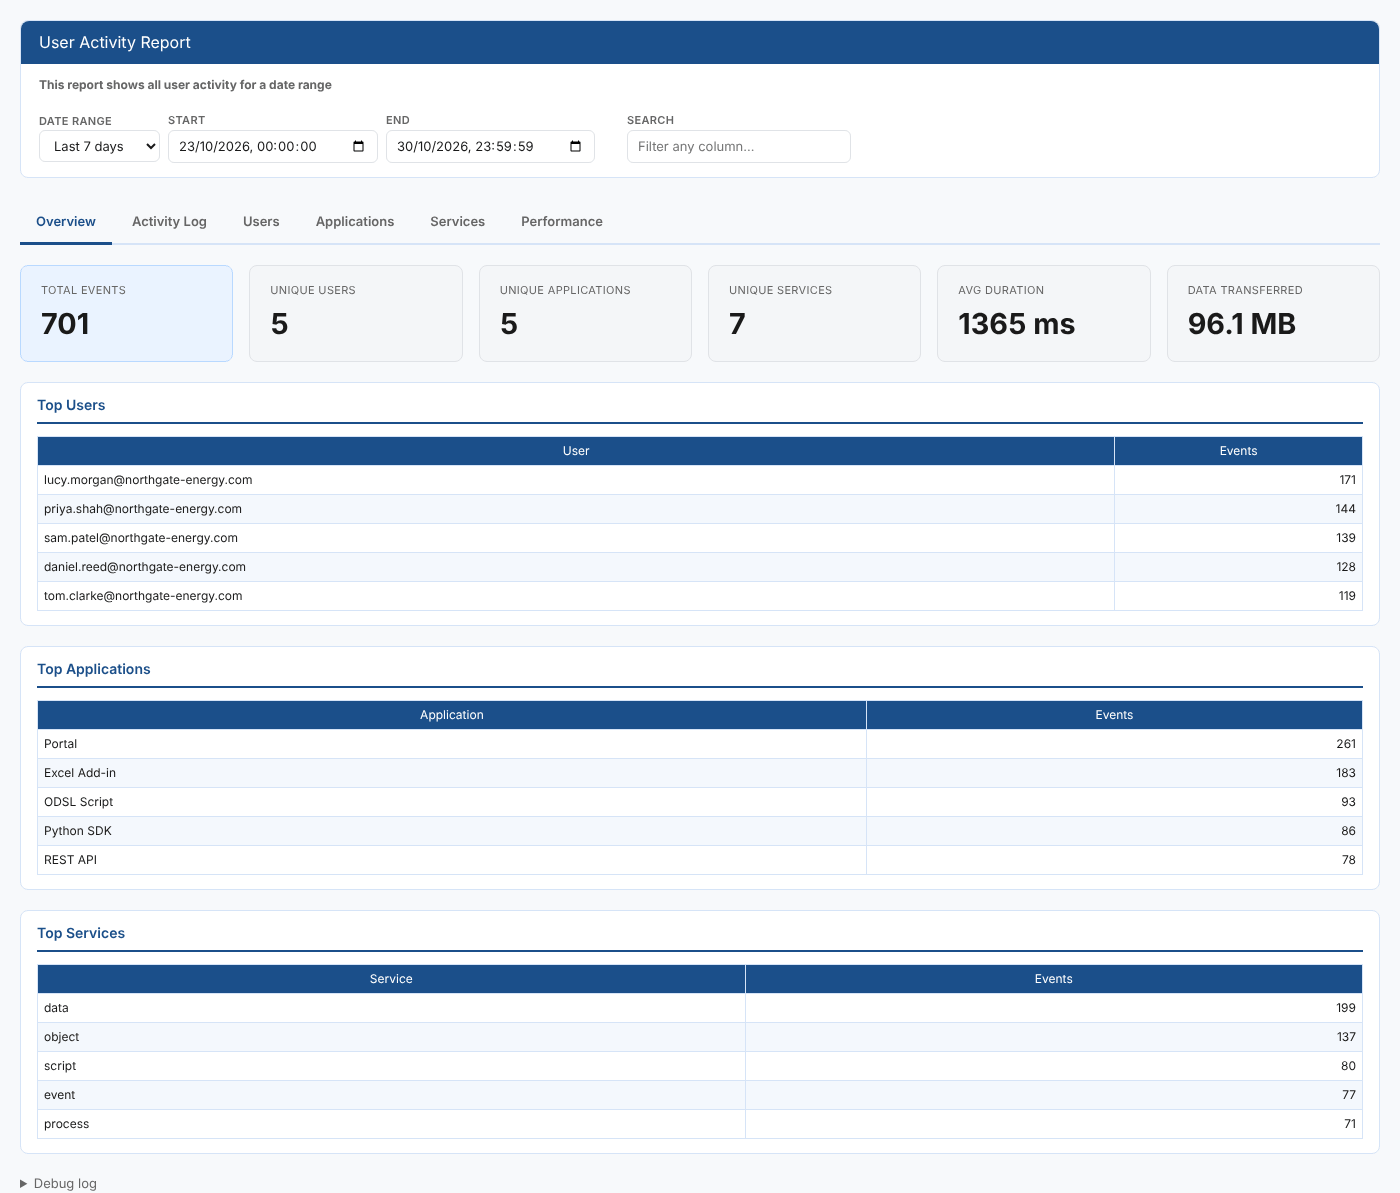
User Activity Report
Who is using the platform, from which application, for which services, and which requests are slow
Read about this report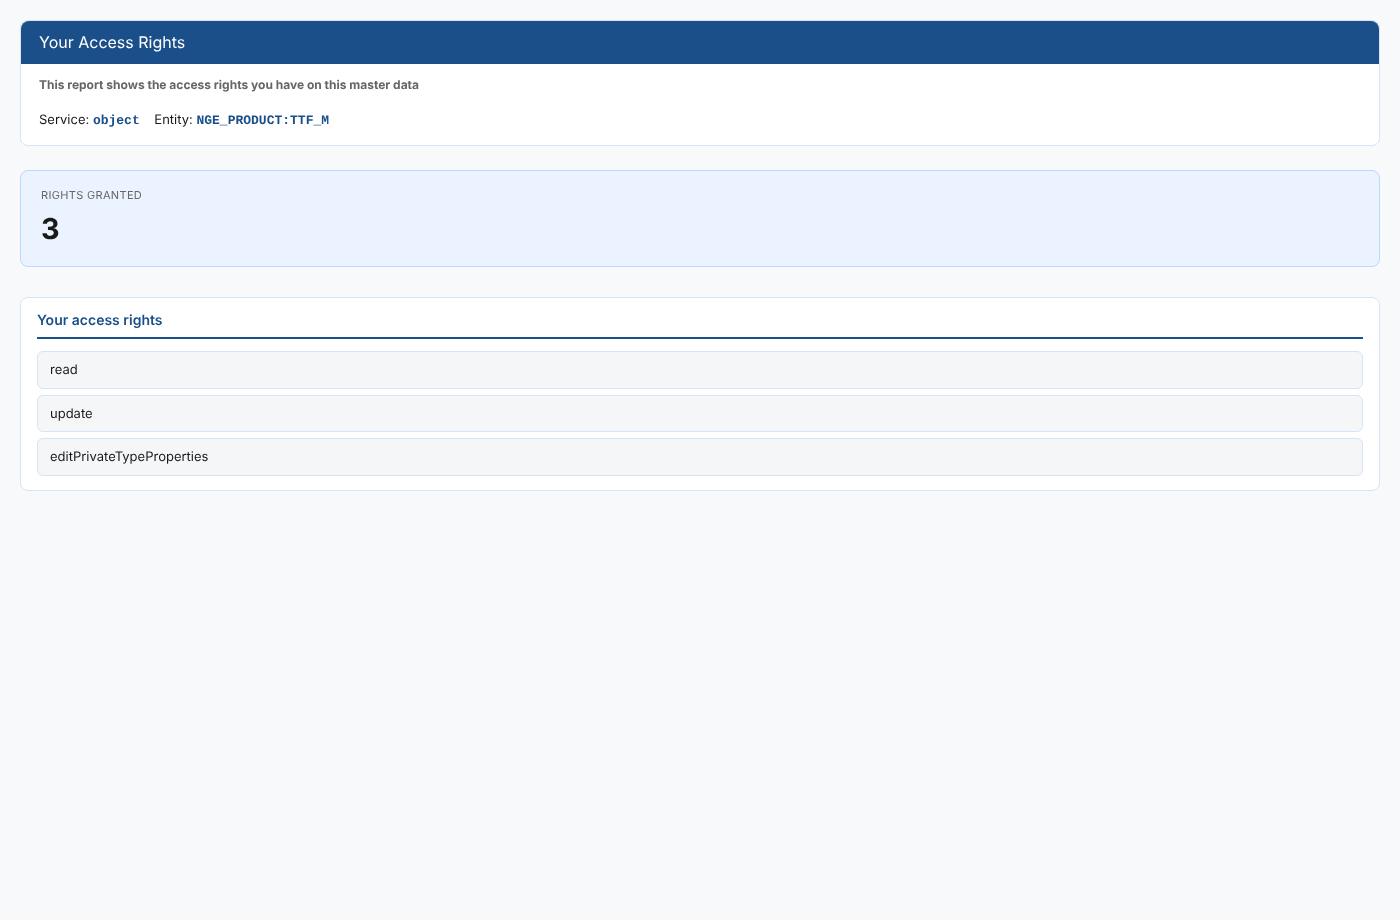
Your Access Rights
Exactly what you are allowed to do on one item, worked out from your security policies
Read about this reportBuild your own
You can create insight reports of your own, shown in the reports menu, on a service or on a single item. See Insights to get started.