Queue Log
Queues deliver data from the platform to other systems. When a system says it did not receive something, you need to see what was sent. The Queue Log lists the messages sent to the selected queue and answers questions like:
- Did yesterday's TTF price go to the ETRM queue?
- Which messages failed, and why?
- What kind of content was sent, and how big was it?
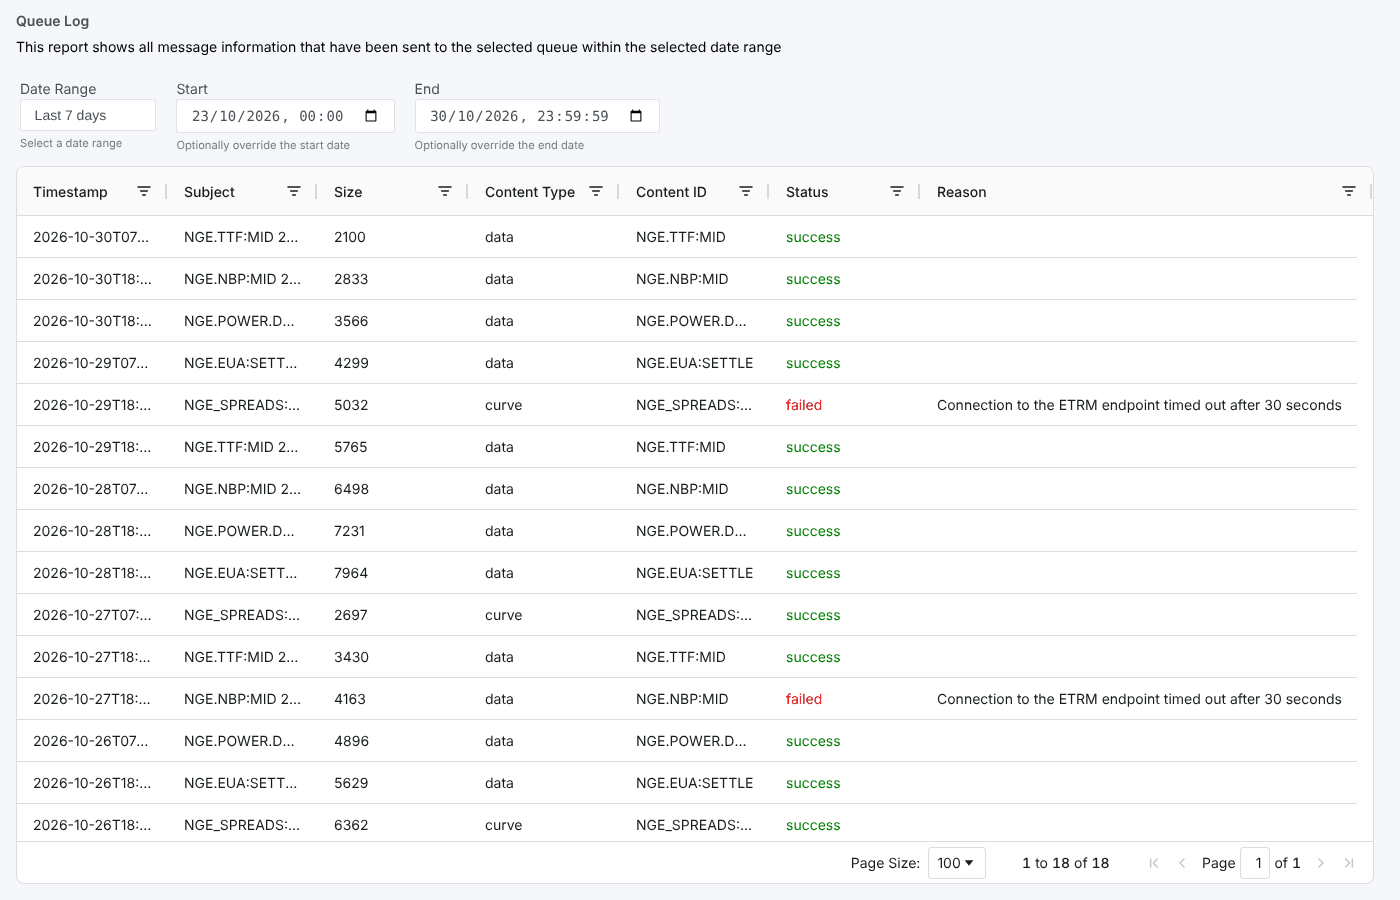
At Northgate Energy, the ETRM team reads prices from the queue NGE_ETRM_PRICES. Priya Shah checks the last week after two prices were reported missing.
Opening the report
On the Queues screen, select a queue and open Queue Log from its insights. It is registered as #QUEUE_LOG in the category Queue Insights, and receives the selected queue's id (ID).
The Queue Log is a configured insight: it has no template of its own and uses the platform's standard single table layout, with the columns set in its registration.
The list loads as soon as the report opens, for Today.
| Control | What it does |
|---|---|
| Date Range | Today, Yesterday, Last 7 days, Last 30 days, Last 60 days, This Month, Last Month or All. Choosing one fills in Start and End and reloads. |
| Start, End | Change either date and time to set your own range |
| Report name | Click the report name at the top to hide or show the header and the date range |
The report
One row per message sent to the queue in the range:
| Column | What it shows |
|---|---|
| Timestamp | When the message was sent |
| Subject | The message subject, usually the item and date it carries |
| Size | The size of the message |
| Content Type | What the message carries, such as data or curve |
| Content ID | The id of the item sent |
| Status | Green for a message that was delivered, red for one whose status starts with fail |
| Reason | Why the message failed |
The table shows 100 rows a page, with the page controls at the bottom. Click a column header to sort on it, and use the filter icon in a header to filter the rows on screen.
Troubleshooting
| Problem | What to do |
|---|---|
| A message you expect is missing | Check the range, then check the automation or process that should send it: use the Tracer on the item or the process run. |
| Many messages show failed | Read the Reason: it usually names the endpoint or the setting that stopped the delivery. |
Related
- Insights: how insight reports work
- Tracer: queue messages together with the automations and changes that caused them
- Automations: the automations that send data to queues