Curve Dependency Report
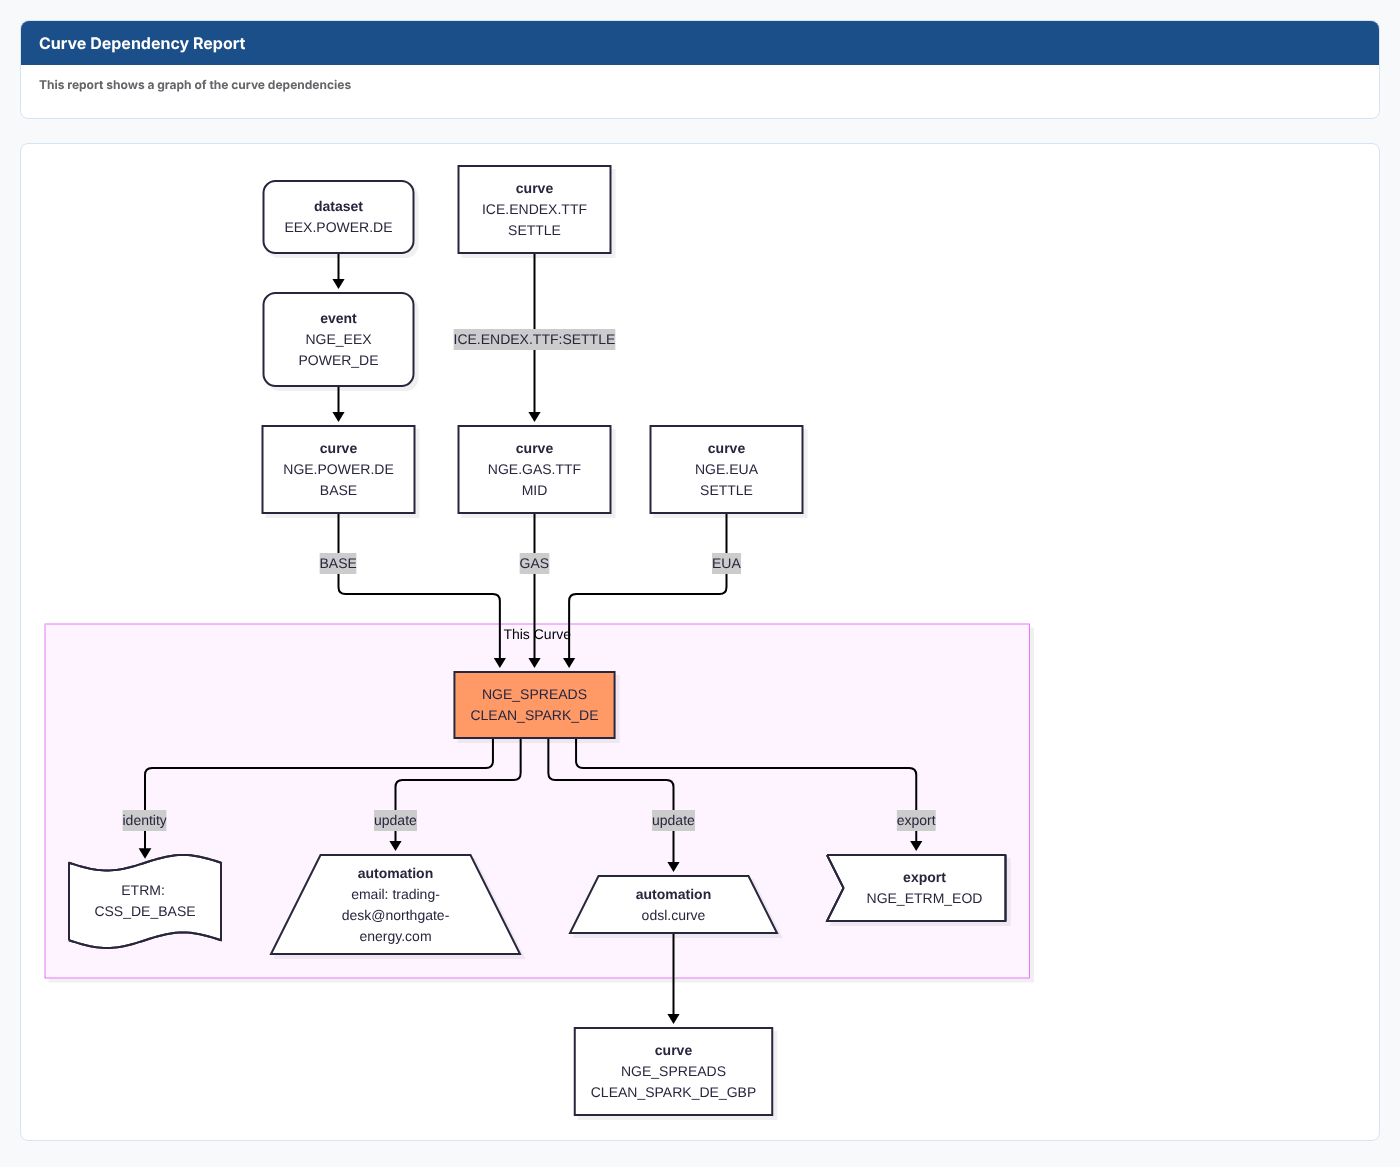
A derived curve can sit at the end of a long chain: a dataset loads trades into an event list, an event curve is built from them, a smart curve combines that with other curves, and automations email it or build further curves from it. The Curve Dependency Report draws that chain for one curve and answers questions like:
- Which curves and inputs does this smart curve depend on, all the way back?
- Which dataset feeds the event curve at the bottom of the chain?
- What happens when this curve is updated: who is emailed, and which curves are built from it?
- Is the curve exported, and does it have an identity in another system?
At Northgate Energy, Tom Clarke opens it on the German clean spark spread NGE_SPREADS:CLEAN_SPARK_DE to see what has to be loaded before the spread can be built, and what runs after it.
Opening the report
The report works on one curve, so you open it from the curve itself. It is registered twice with the same template:
| Report id | Category | Where it appears |
|---|---|---|
#INSIGHT_CM_GRAPH | Curve Management Insights | The insights of a selected curve in Curve Management |
#INSIGHT_DATA_GRAPH | Data Insights | The insights of a selected curve on the Data screen |
The diagram is drawn as soon as the report opens. A large diagram scrolls inside its card.
#INSIGHT_DATA_GRAPH is not hidden from the Reports list, but it needs a selected curve. Open it from a curve, not from the Reports menu.
Reading the diagram
The curve you opened is in orange, inside the This Curve box. What it is built from is above it; what uses it is below it.
| Shape | What it is |
|---|---|
| Rectangle curve | A curve this one depends on, or a curve built from it by an automation |
| Rounded event | The event list an event curve is built from |
| Rounded dataset | The dataset that loads that event list |
| Wavy banner | An identity of the curve in another system, for example ETRM: CSS_DE_BASE |
| Trapezium automation | An automation on the curve. It shows the email address, the queue, or the automation target. |
| Notched export box | An export group the curve belongs to |
The labels on the arrows say how each part is used:
| Label | Meaning |
|---|---|
| BASE | The base curve of a smart curve |
| An input name, such as GAS or EUA | A curve passed into the smart curve's expression under that name |
| A curve id | The base curve of a smart curve further up the chain |
| identity | The curve's identity in another system |
| An action, such as update | The action that triggers an automation |
| export | The curve is in that export group |
The report follows the chain upwards through smart curves and event curves. For an automation that builds another curve (target odsl.curve), it also draws that curve below the automation.
Good to know
- Automations are found when they are set on this curve or on every item (
*) of the curve or data service. - Inputs are found from the smart curve's properties: a reference to a curve, or a
${data:...}expression. - Only the first event of an event list is read to find its dataset, so a list loaded by several datasets shows one of them.
Related
- Curve Script Function Report
- Curve Hierarchy Report
- Data Report
- Insights: how insight reports work