Curve Hierarchy Report
Curve Management records the parent curves of every managed curve. The Curve Hierarchy Report draws all of them as a tree, so you can see at a glance which curves depend on which. It answers questions like:
- Which curves are built from the German power base curve?
- Which curves are at the top of a chain, with no parent?
- How deep does a chain of derived curves go?
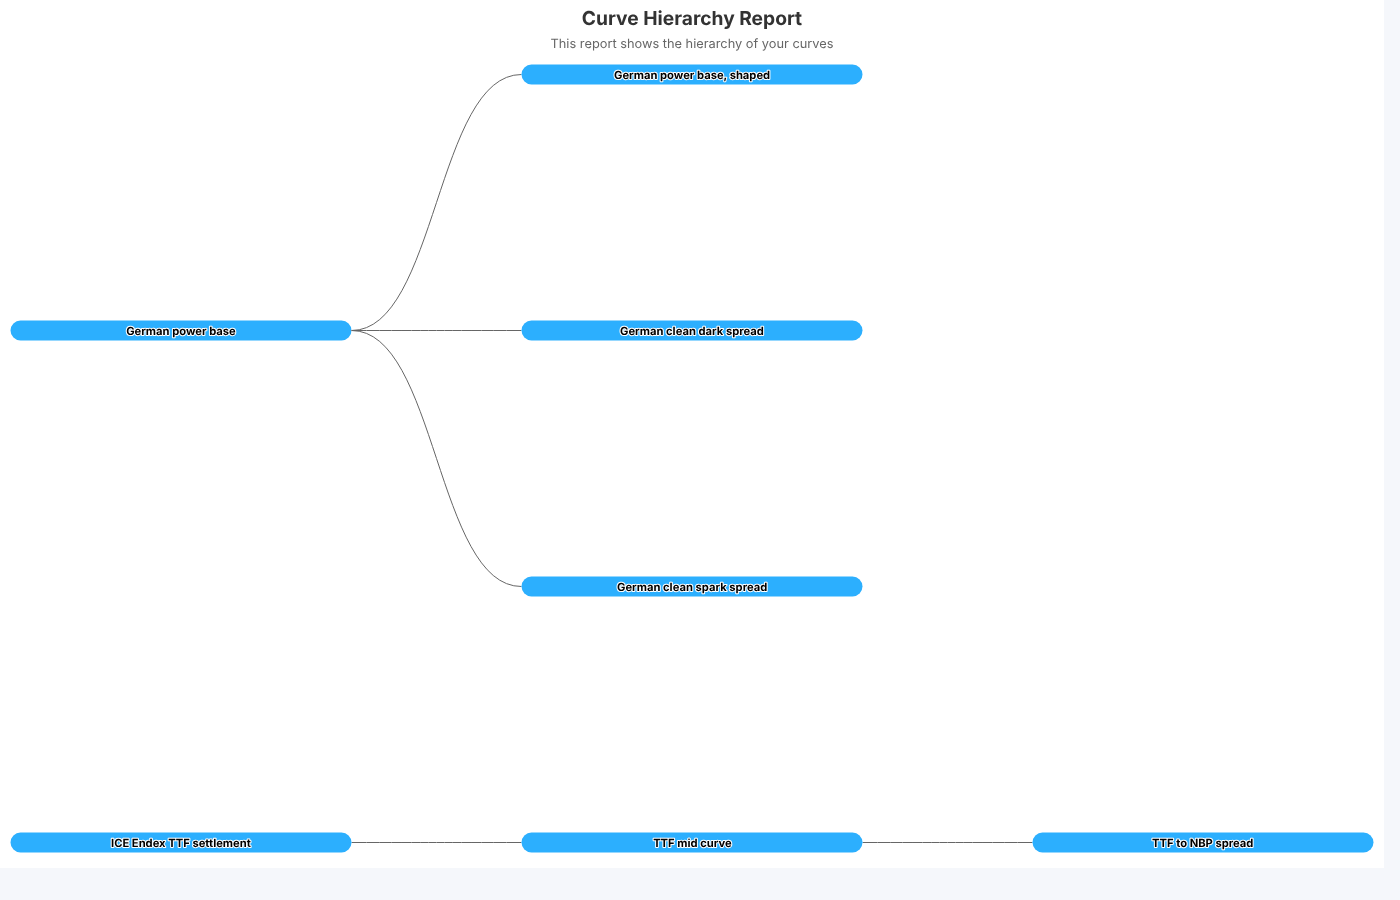
At Northgate Energy the tree shows two families: the German power base curve with the spark spread, dark spread and shaped curve built from it, and the ICE Endex TTF settlement curve with the TTF mid curve and the TTF to NBP spread.
Opening the report
The report is registered as Curve Hierarchy Report (#INSIGHT_CM_HIERARCHY) in the Curve Management category. It is hidden from the Reports list (hideList), so it is opened from Curve Management.
It has no controls: when it opens, it reads every managed curve and draws the tree.
Reading the tree
| Part | What it shows |
|---|---|
| Box on the left | A curve with no parents: the start of a chain |
| Boxes to the right | Curves built from the curve they are connected to |
| Label | The curve name, or its id when it has no name |
The tree fills the window and scrolls in both directions when it is larger.
A curve with more than one parent is placed under its last parent only.
This is an older style report. It uses style, data and chart partials (#report-css, #report-data, #highcharts_lib) that are kept on the platform rather than with the other report scripts.
Related
- Curve Dependency Report: the full chain for one curve, including events, datasets and automations
- Curve Quality Report
- Insights: how insight reports work