Usage
Before you change, replace or stop paying for a dataset, you want to know who relies on it. The Usage report lists the requests made for one dataset's data and answers questions like:
- Who uses this dataset, and from which application: the portal, the Excel add-in, the Python SDK or the REST API?
- Is a system reading it every day, or did use stop last month?
- How long do requests take, and how much data do they return?
- Is the dataset used in production or only in a test environment?
Throughout this page we follow Northgate Energy, a fictional gas and power trader that uses the EEX TTF spot dataset EEX.NG_SPOT.TTF.
Opening the report
Select a dataset on the Dataset Monitoring screen and choose Usage from its insights (category Dataset Monitoring Insights). It is not listed in the Reports menu.
| Registration | Value |
|---|---|
| Report id | #DMI_USAGE |
| Category | Dataset Monitoring Insights |
| Template | #insight-dm-usage |
| Input | The selected dataset, passed as the DSID report property |
The report opens on Today and loads the requests straight away.
| Control | What it does |
|---|---|
| Date Range | Today, Yesterday, Last 7 days, Last 30 days, Last 60 days, Last 90 days, This month, Last month or All |
| Start, End | The range in use. Change either one to set your own range; the list reloads straight away. |
Last month does not work at the moment: it sets no valid dates. Use Start and End to choose last month by hand.
The report
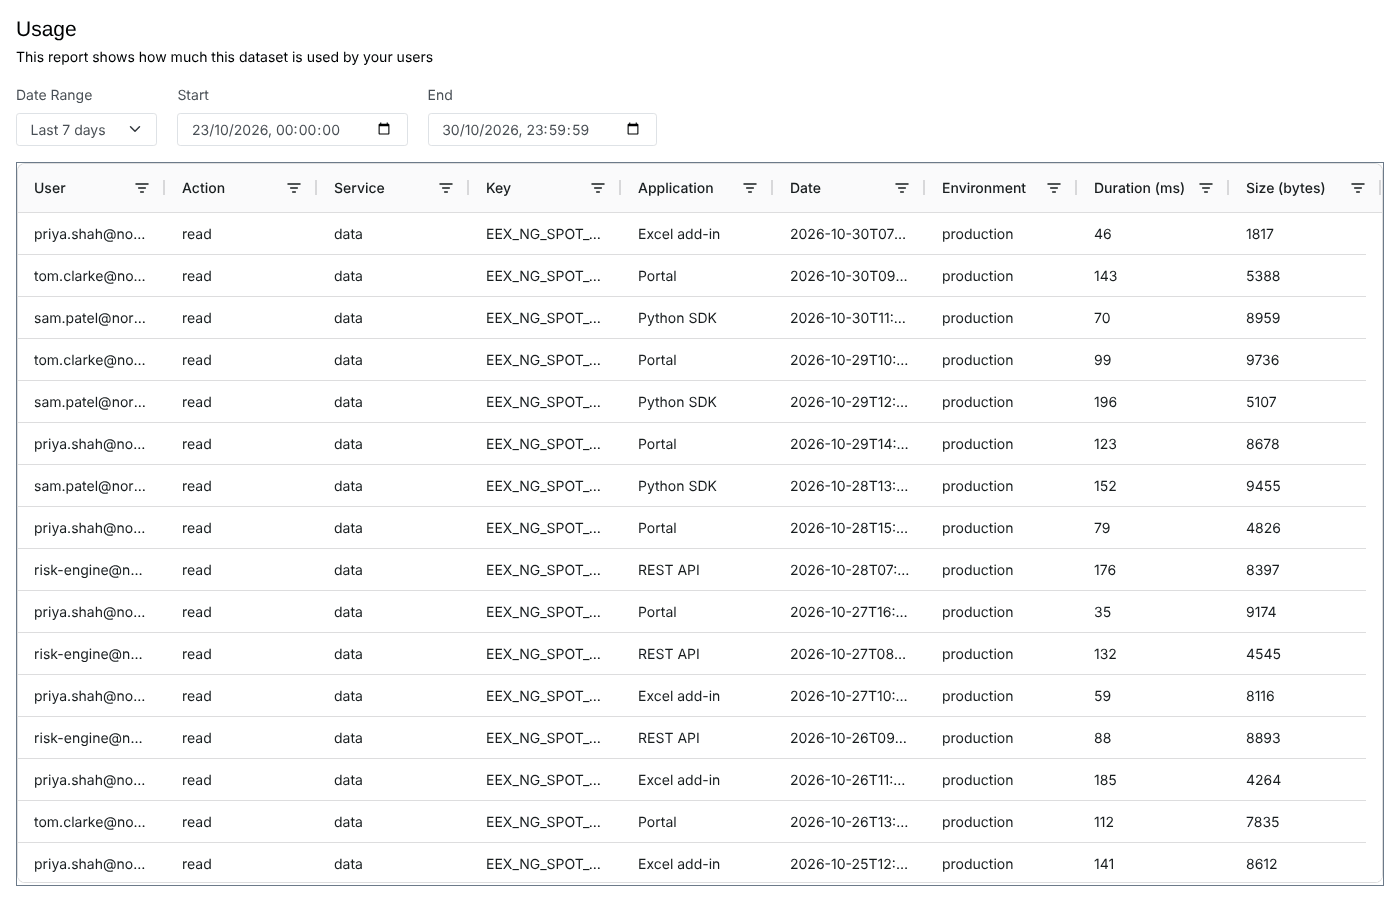
One row per request for the dataset's data in the range.
| Column | What it shows |
|---|---|
| User | The user or application account that made the request |
| Action | What was done, such as read |
| Service | The platform service called, such as data |
| Key | The id that was requested, such as a timeseries or curve of the dataset |
| Application | Where the request came from, such as the portal, the Excel add-in, the Python SDK or the REST API |
| Date | When the request was made |
| Environment | The data environment the request was made in |
| Duration (ms) | How long the platform took to answer |
| Size (bytes) | How much data was returned |
Every column can be filtered from its header and sorted by selecting the header. At Northgate, the last 7 days show the TTF spot prices read by the market data and risk teams in the portal and Excel, by IT from the Python SDK and by the risk engine through the REST API.
Filter the User or Application column to see one consumer at a time, then sort by Date to see whether it still reads the data every day.
Troubleshooting
| Problem | What to do |
|---|---|
| The list is empty | Choose a longer range. The report lists the usage records stored against this dataset id. |
| Last month shows nothing or the dates look wrong | See the note above: set Start and End by hand. |
Related
- Insights: how insight reports work
- Data Usage: where the dataset is used in events, timeseries and curves
- Usage: the same kind of report for any item