Activity Report
For a dataset you rely on every day, the useful questions span several services: who uses it, whether its prices were corrected, whether it loaded on time, and whether the curves built from it succeeded. The Activity Report brings those together on one page for a single dataset object and answers questions like:
- Who has been using this dataset, and from which application?
- On which days did the provider correct prices, and by how much?
- Did the data load on time every day this month?
- Did the curves built from it build and pass their quality checks?
At Northgate Energy, Priya Shah opens it on the ICE Endex dataset ICE.NDEX.NLB to review its last 30 days.
Opening the report
The Activity Report is attached to a master data object as a report reference, so it appears with that object. Each registration names the dataset (DSID) and object (OBJID) it reads, in the Objects report scripts:
| Registration | Object |
|---|---|
ICE.NDEX.NLB:Activity on object ICE.NDEX.NLB | ICE Endex NLB |
ICE.IFEU.B:Activity on object ICE.IFEU.B | ICE Futures Europe Brent |
#INSIGHT_ICE.NDEX.NLB | A saved copy for testing |
All use category Insights, are hidden from the Reports list and open on the last 30 days.
| Control | What it does |
|---|---|
| Date Range | Last 30 days, Last 7 days, Yesterday, Today, Last month, This month, All or Custom. Custom shows Start and End dates. |
| The five charts | Click a chart to show its list below. Click a slice, column or point in a chart to narrow the list to that user or date. Click the date range area to clear the selection. |
The list under the charts is paged, with a summary such as Results: 1-100 (102) at the bottom.
The views
User Activity
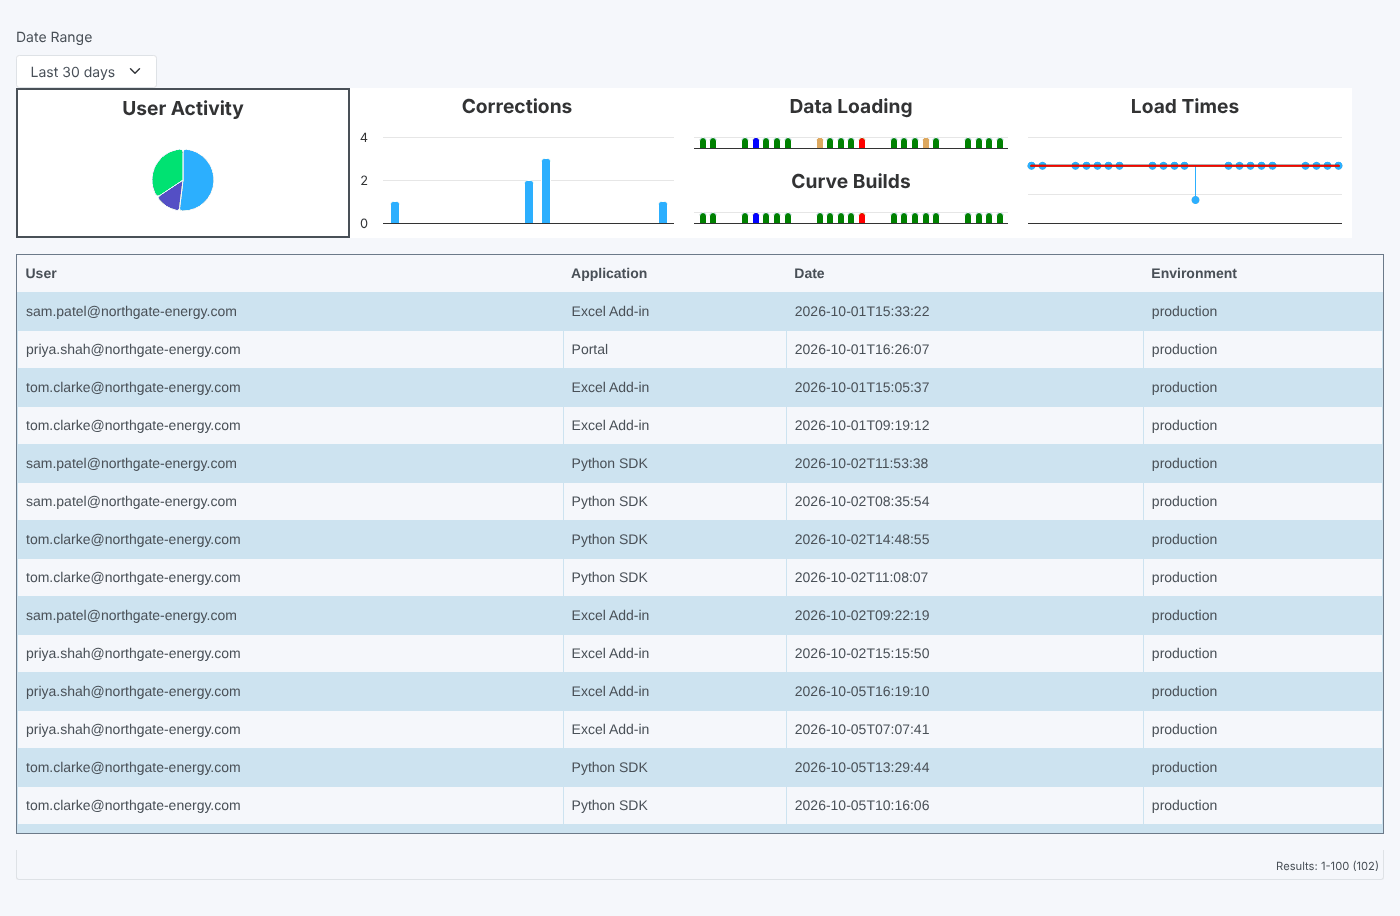
Selected when the report opens. The pie chart shows requests for the object by user. The list shows each request: User, Application (for example Portal, Excel Add-in or Python SDK), Date and Environment. Click a slice to list one user's requests.
Corrections
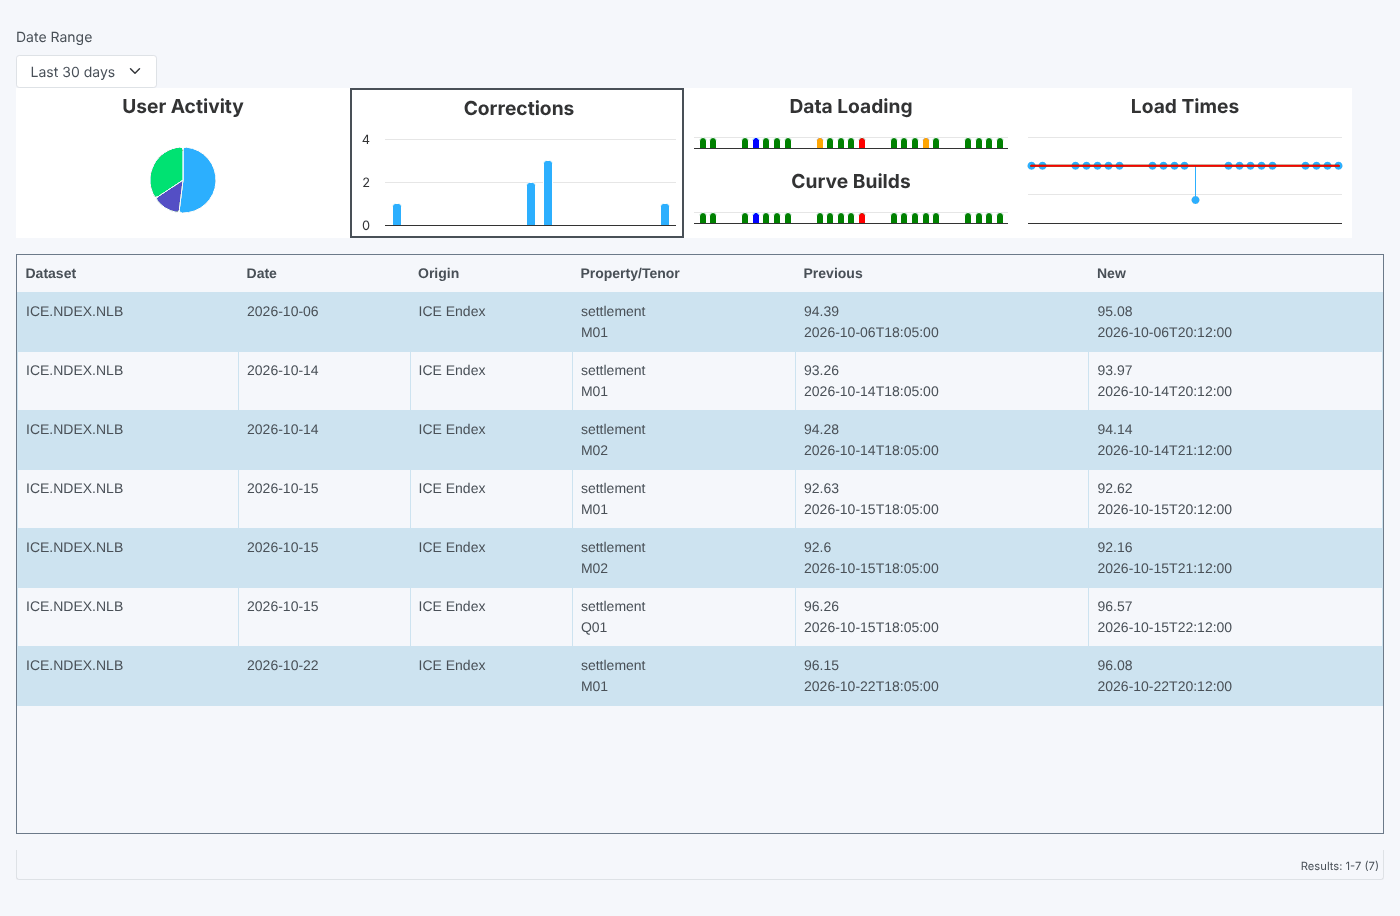
The column chart shows how many corrections the provider made per curve date. The list shows each correction: Dataset, Date (the curve date), Origin, Property/Tenor, Previous (with when it was last loaded) and New (with when it was corrected). Click a column to list that date's corrections.
Data Loading
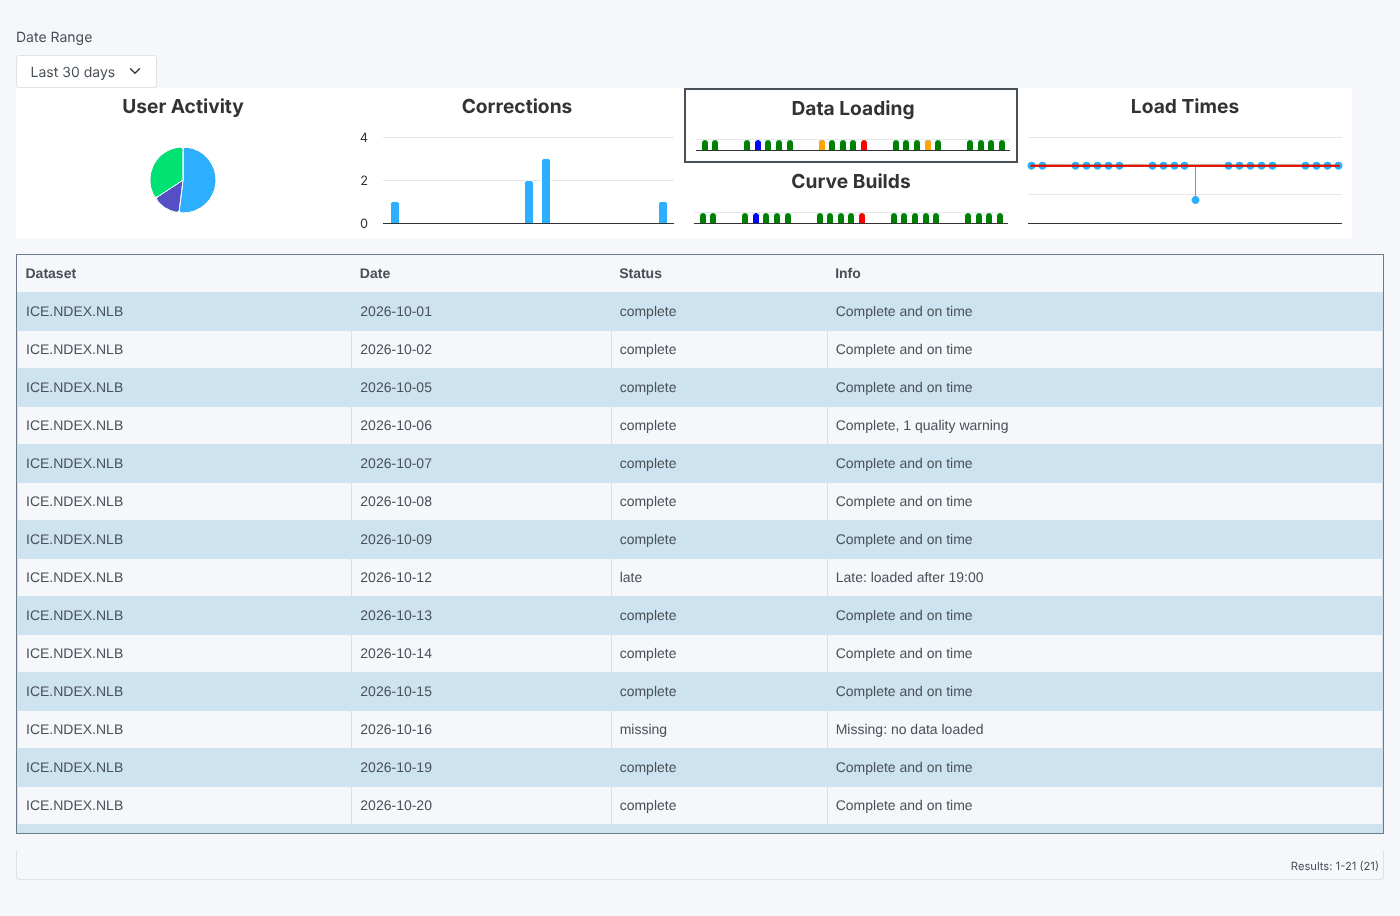
One mark per day, coloured by the day's delivery score: green for 4, blue for 3, orange for 2 and red for anything lower. The list shows Dataset, Date, Status and Info (the score explanation, for example Late: loaded after 19:00). Click a mark to list that day.
Curve Builds
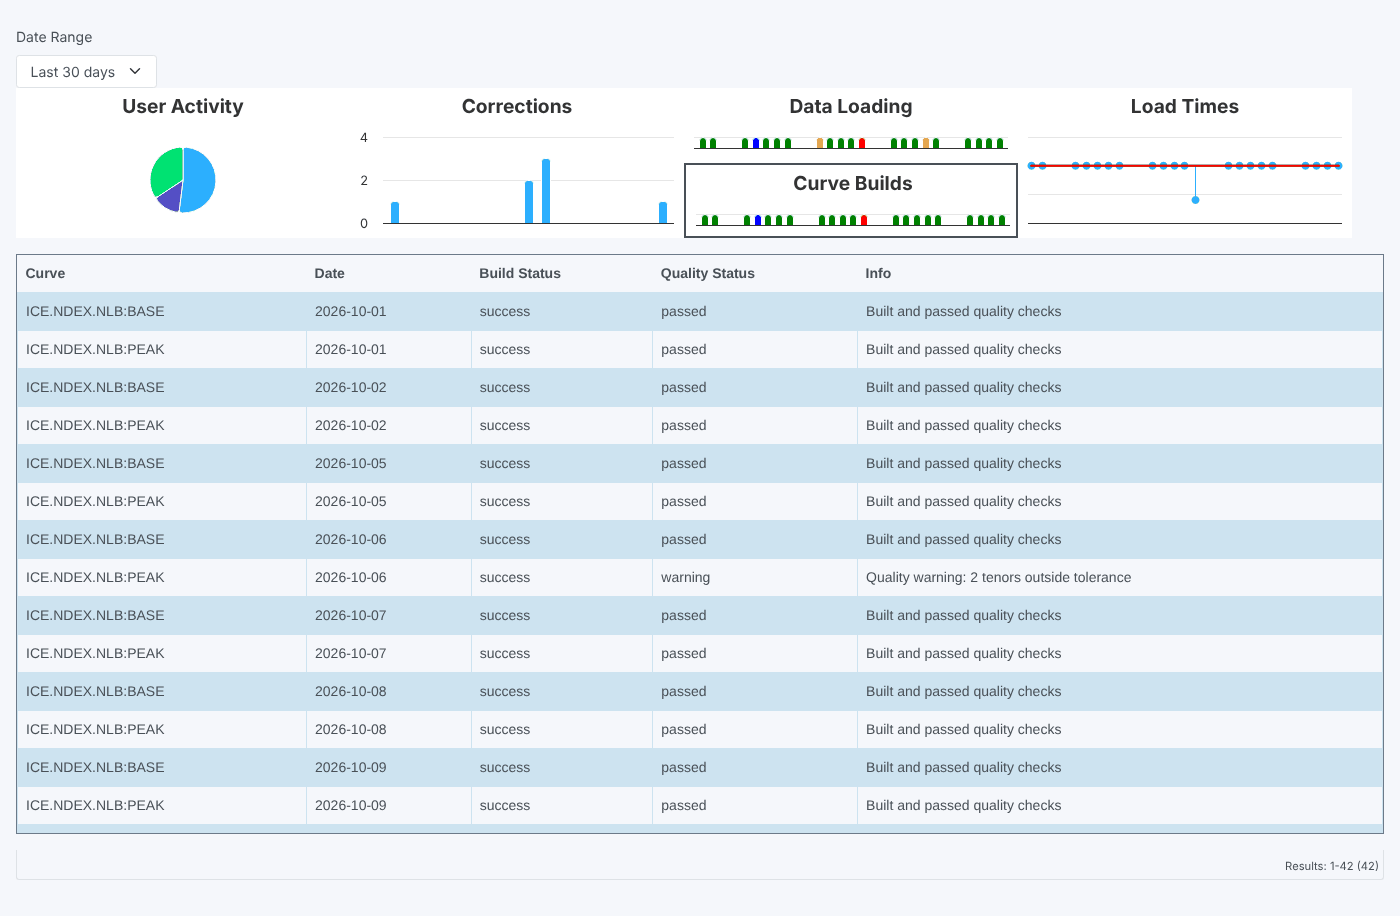
The same colours for the curves built from the object (every curve whose id starts with the object id). The list shows Curve, Date, Build Status, Quality Status and Info.
Load Times
A chart of each day's load time against the expected time (the zero line) and the late time. The list shows Dataset, Date, Status, Expected, Late, Loaded and Delta (how late it was).
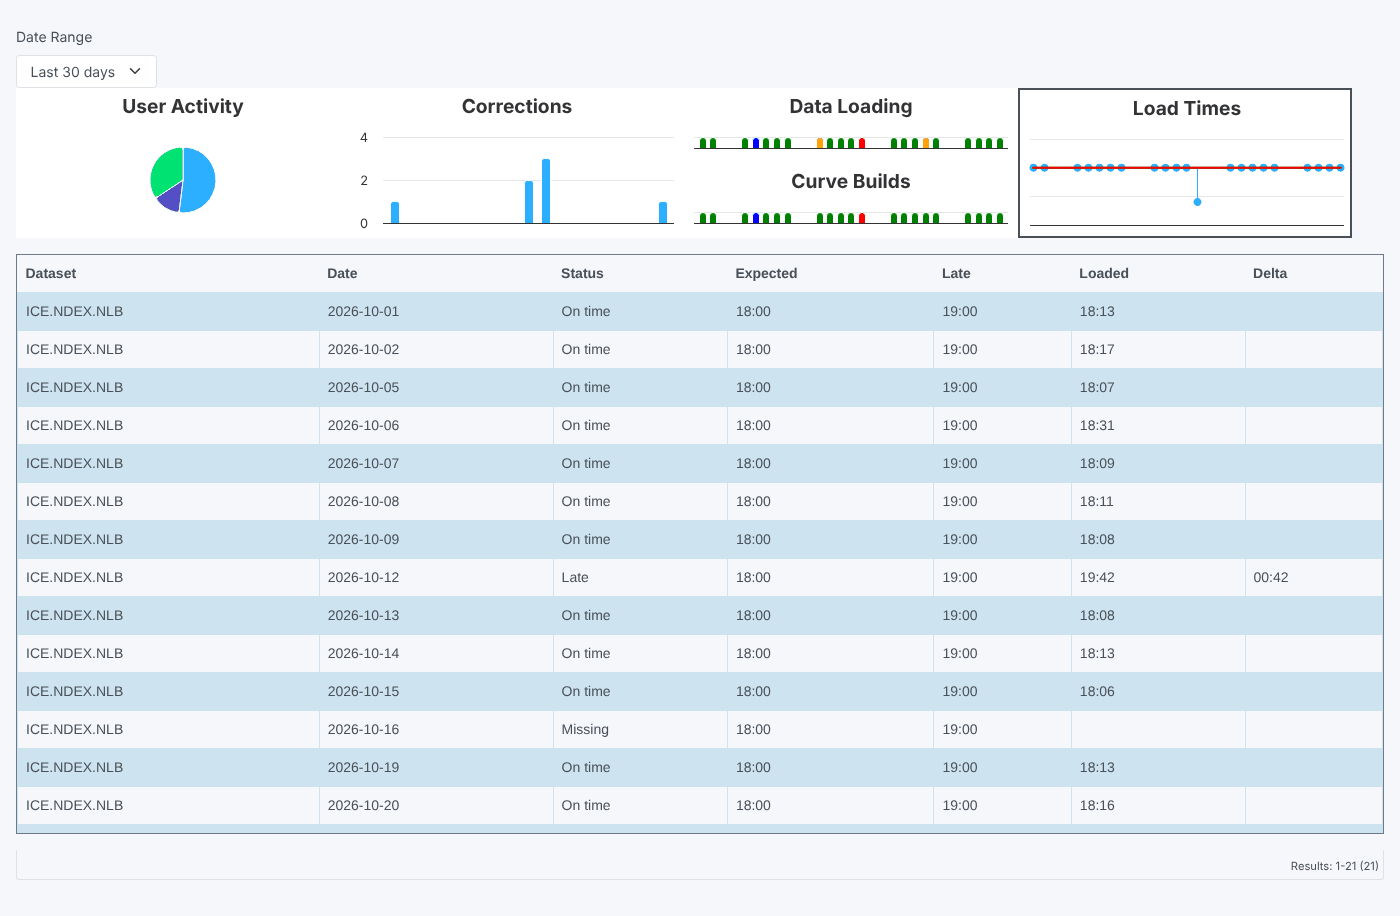
A day with no load time (missing data) is plotted far below the others, which squashes the rest of the chart. Use the list to read the times.
Where the data comes from
| View | Service and source |
|---|---|
| User Activity | metric (requests for the object) |
| Corrections | correction, common |
| Data Loading, Load Times | dataset_delivery, common |
| Curve Builds | curve, build |
This is an older style report, built with the earlier chart and style partials rather than the current house style.
Related
- Data Report
- Insights: how insight reports work