Seasonality Chart
Energy prices move with the seasons: gas rises into winter and falls in spring, power follows demand and weather. The Seasonality Chart turns a price history into a heatmap of percentage changes so the pattern stands out. It answers questions like:
- In which months does German day-ahead power usually rise or fall?
- Was this March unusual compared with other years?
- How did the front month TTF contract change over each whole year?
At Northgate Energy, Tom Clarke opens it on the German day-ahead base price NGE.POWER.DE:DA_BASE to check whether the autumn rise this year looks like other years.
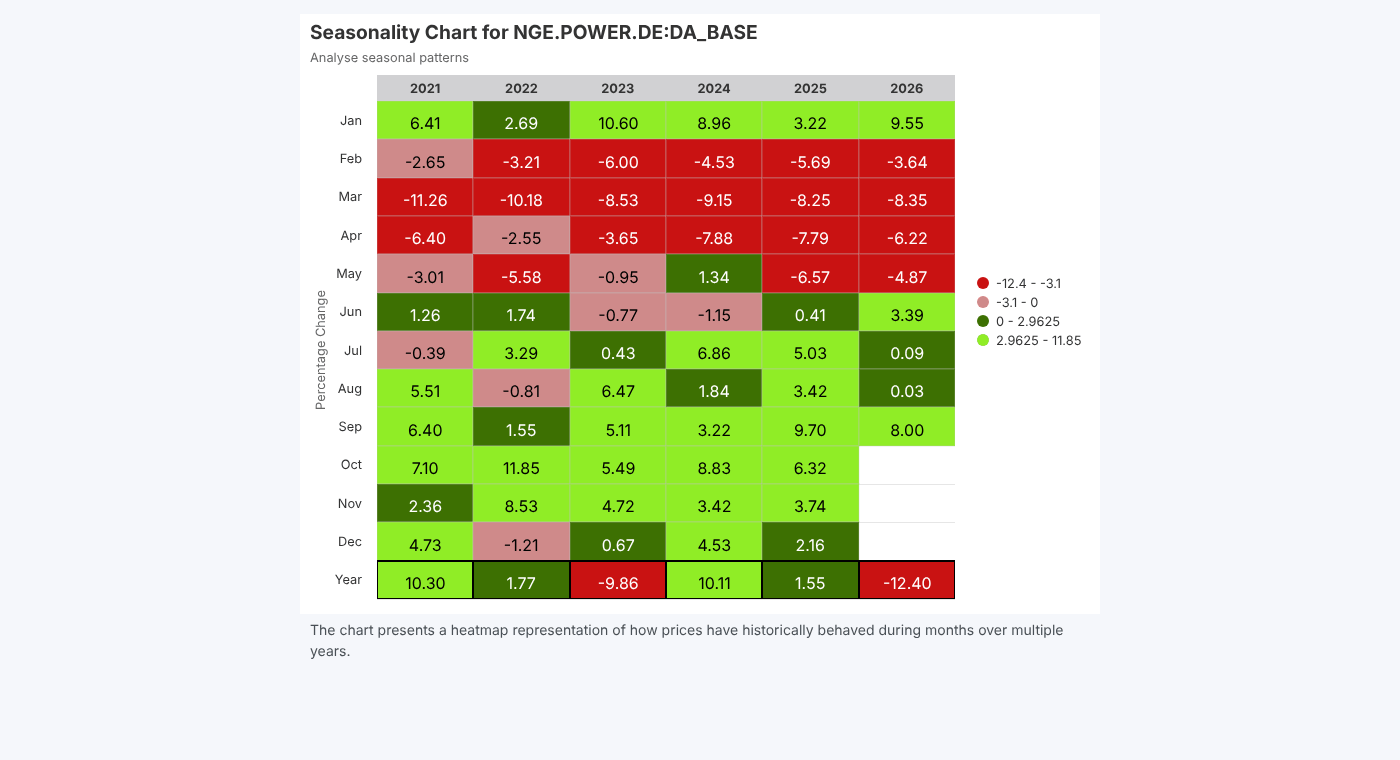
Opening the report
The report works on one item, so you open it from the item's insights on the Data screen. It is registered as Seasonality Chart (#SEASONALITY) in the Data Insights category and is hidden from the Reports list.
| Item type | What happens |
|---|---|
| Timeseries, smart timeseries, event timeseries | The chart is drawn straight away |
| Curve, smart curve, event curve | A Select a tenor list appears with the curve's tenors. The first tenor is charted; choose another to chart that one. |
| Anything else | Nothing is drawn |
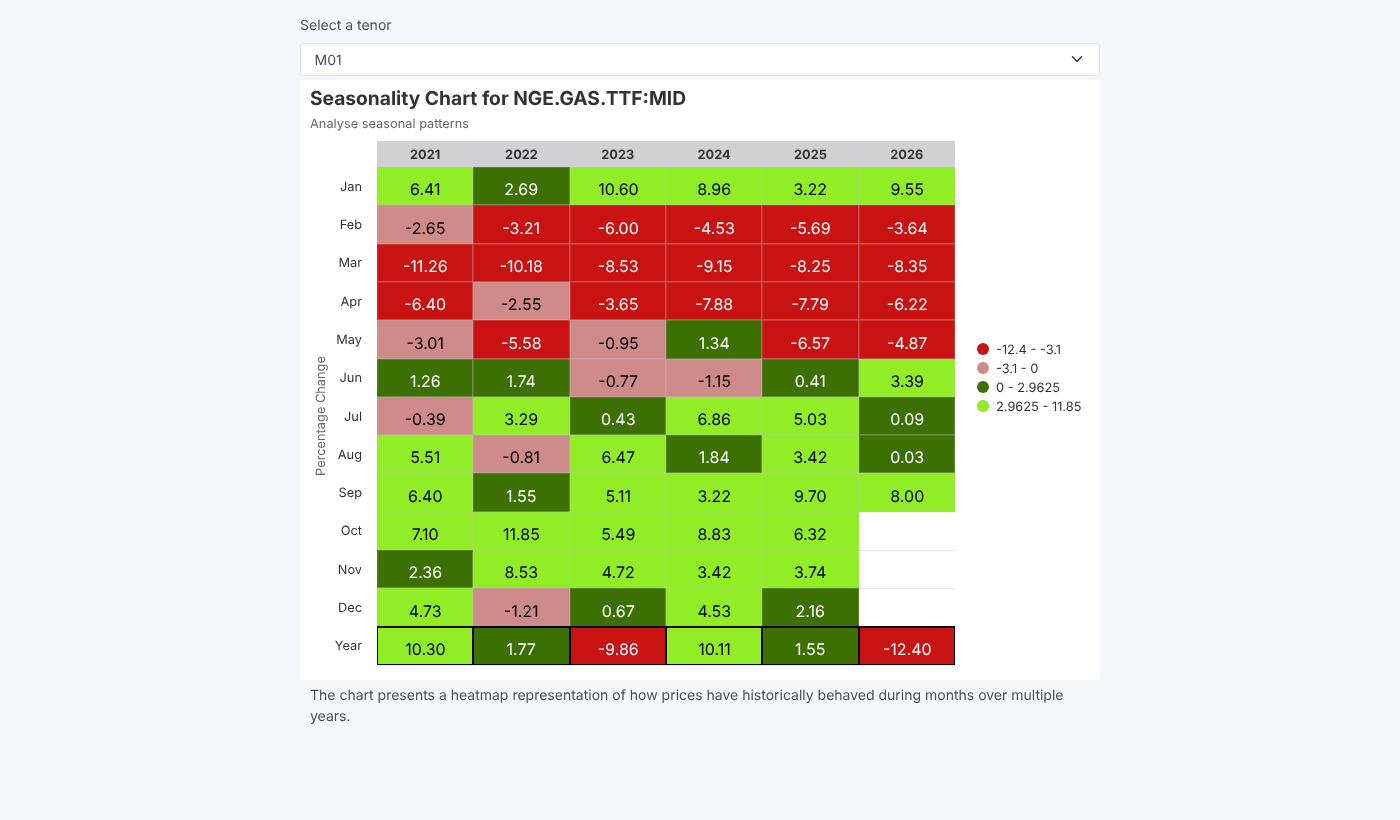
Reading the chart
| Part | What it shows |
|---|---|
| Columns | One per year, from the first year of data |
| Rows Jan to Dec | The percentage change over that month: the value at the end of the month compared with the end of the previous month |
| Row Year (outlined) | The percentage change over the whole year, from year end to year end |
| Colours | Dark red for the biggest falls, pink for small falls, dark green for small rises and light green for the biggest rises. The legend on the right shows the ranges. |
The values are calculated on the platform from the item's data with the expressions pct(scale(BASE,'MONTHLY','end'))*100 and pct(scale(BASE,'YEARLY','end'))*100, rounded to 2 decimal places. The current year shows the months so far.
The colour bands are set from the largest fall and the largest rise in the chart, split at a quarter of each. One extreme month can make every other change look small, so read the numbers as well as the colours.
Related
- Data Report
- Curve Dependency Report
- Insights: how insight reports work