Integration Send Times
Downstream systems need their data by a time: the morning valuation, the risk run, the settlement batch. Integration Send Times shows when each group actually finished, day by day, against the cutoff. It answers questions like:
- When does each group usually finish, and how late has it been?
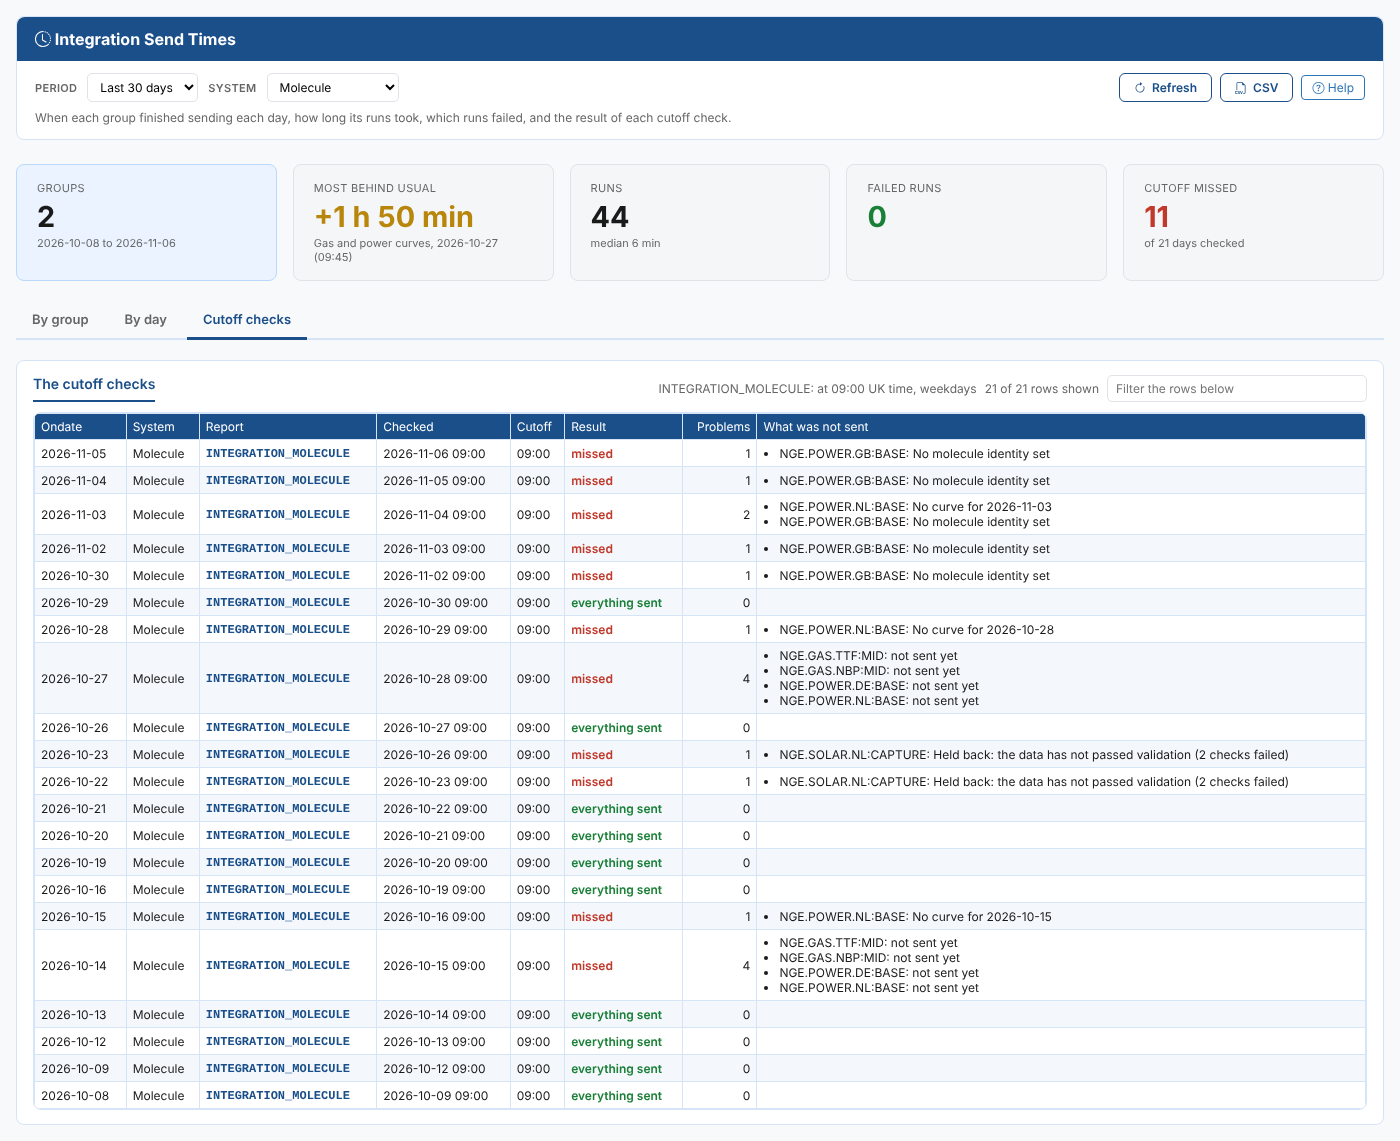
- Which days missed the cutoff, and what was not sent by then?
- How long do the runs take, and which runs failed?
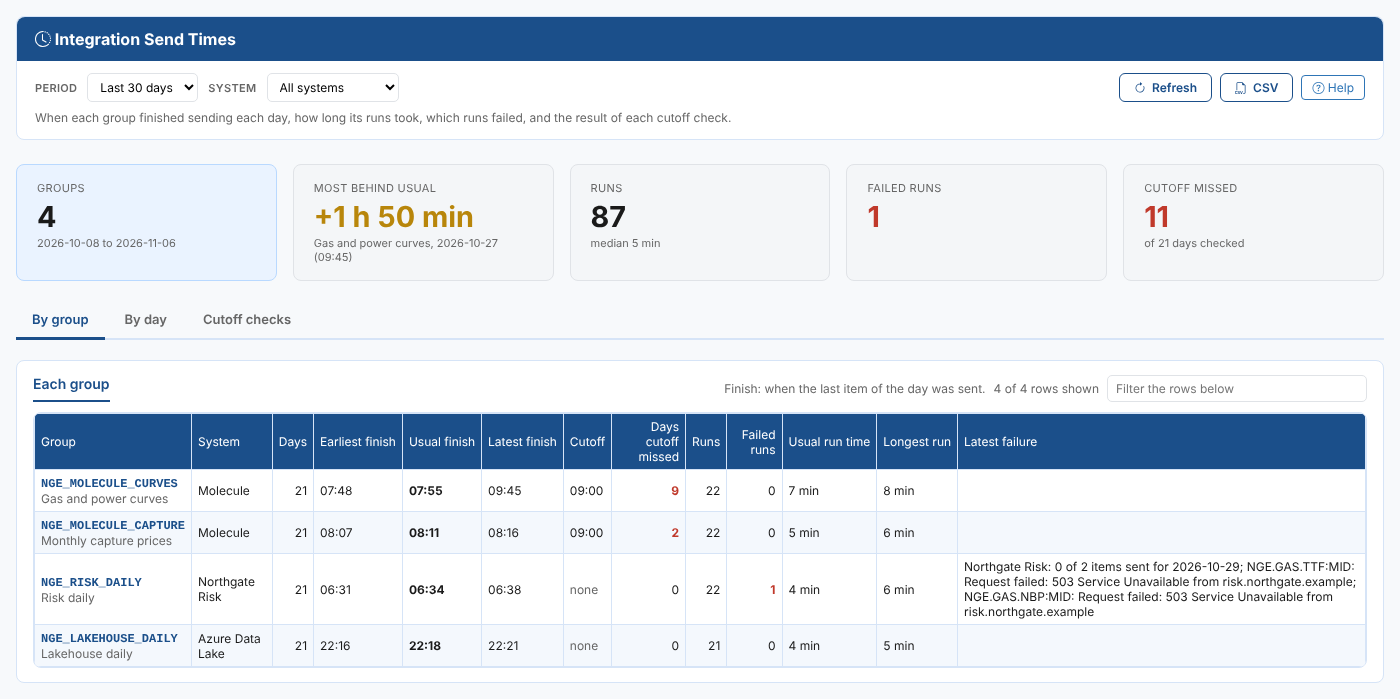
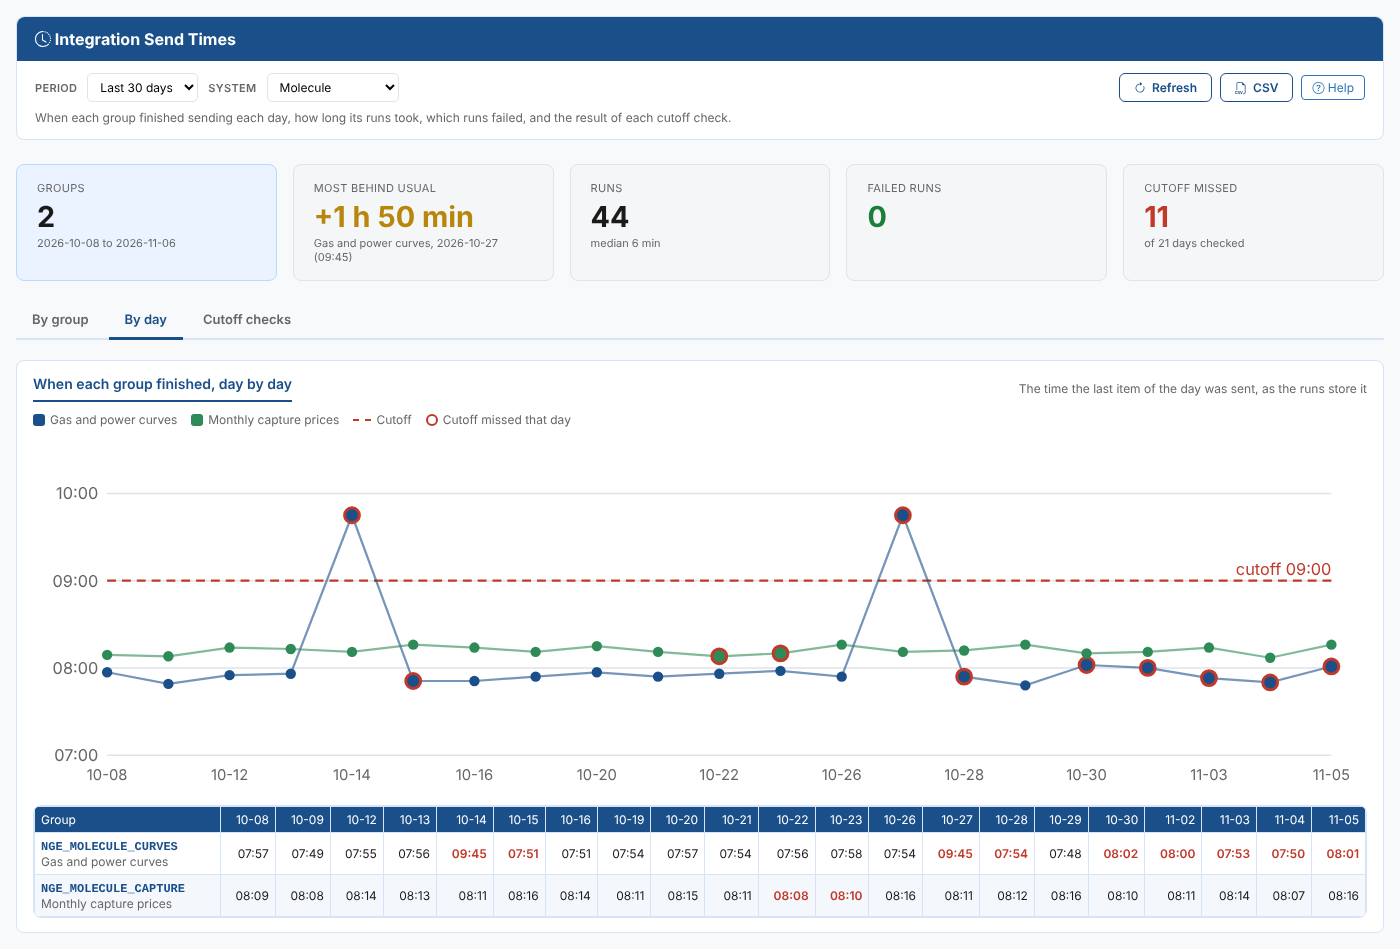
At Northgate Energy, the report shows the gas and power curves usually reach Molecule by 07:55, an hour before the 09:00 cutoff, but twice in October the run finished at 09:45 because the curves were built late.
Opening the report
The report is on the Insights tab of Operations, Integrations (the Integration extension), as Integration Send Times (odsl.integration.times).
It opens with the last 30 days of every system that has groups.
| Control | What it does |
|---|---|
| Period | The ondates to show: the last 7, 30 or 90 days, this month, last month, or Custom (at most 400 days) |
| System | All systems, or one. Choose one to see its groups on a closer time scale on the By day tab |
| Refresh, CSV, Help | Read the data again, download the table of the tab, open this page |
Key ideas
| Idea | What it means |
|---|---|
| Finish | When the last item of a group was sent for an ondate, as the run stores it in the daily report |
| Usual finish | The middle (median) finish over the period |
| Run | A run of the group's schedule, the process INTEGRATION_<GROUP>, started in the period or on the day after its last day |
| Cutoff missed | The report's cutoff check found one of the group's items not sent. A cutoff belongs to a report, so a group only counts the days when one of its own items was a problem. |
Summary cards
| Card | What it shows |
|---|---|
| Groups | Groups that sent something in the period |
| Most behind usual | The finish furthest after its group's usual finish, with the group, the day and the time |
| Runs | The runs of the groups' schedules, with the usual run time |
| Failed runs | Runs that ended with an error |
| Cutoff missed | Days on which a cutoff check found something not sent, of the days checked |
The tabs
By group
A row per group: its system, the days it sent, its earliest, usual and latest finish, the report's cutoff time, the days it missed the cutoff, its runs and failed runs, the usual and longest run time, and the message of its latest failed run.
By day
A chart of each group's finish time per day, with the cutoff time as a dashed red line and a red ring on the days a group missed the cutoff. Below it, a table of the finish time of each group on each day, red on the days it missed the cutoff. Hover over a time sent on another day than the ondate to see when.
Cutoff checks
A row per day a report was checked: when the check ran, the cutoff time, the result, the number of problems and what was not sent by then. Above the table, each report's cutoff setting.
Where the data comes from
| Data | From |
|---|---|
| Finish times | The time of each item in the stored daily reports INTEGRATION_<KEY>:<ondate> |
| Runs | The executions of the processes INTEGRATION_<GROUP>, the latest 2,000 |
| Cutoff | The report configuration (its cutoff time) and the result the cutoff check stored in each day's report |
Times are shown as the runs store them.