Relationships
Data on the platform is linked: a product record points to its hub and exchange, a smart curve is built from other curves and a script, and a type has subtypes and records. The Relationships report draws those links for the selected item and answers questions like:
- Which curves, scripts and calendars does this smart curve depend on?
- Which records does this master data record point to?
- Which records and subtypes use this type?
- Which curves use this expiry calendar?
At Northgate Energy, Tom Clarke opens Relationships on the smart curve NGE_SPREADS:CLEAN_SPARK_DE to see everything a change to the German power or TTF curves would affect.
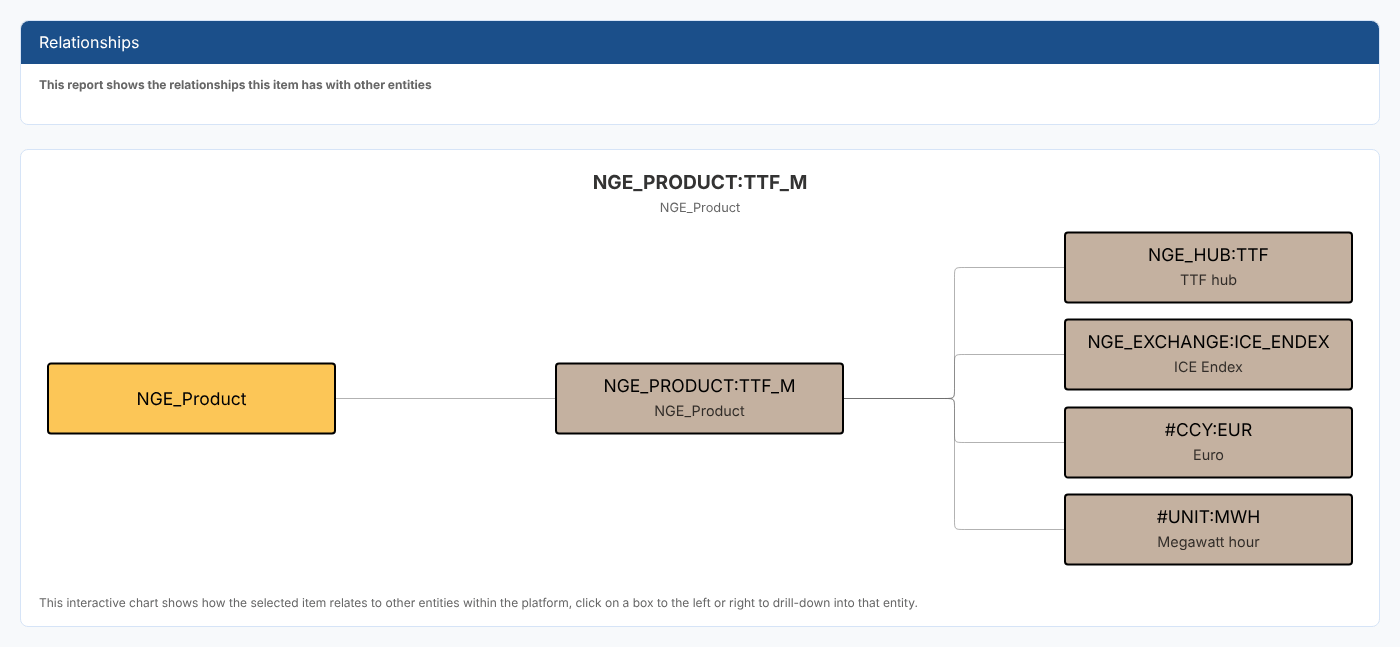
Opening the report
Relationships is an item insight: select an item, then open Relationships from its insights. It is registered as #INSIGHT_ITEM_RELATIONSHIP in the category *Item Insights*.
The portal passes the item's service (SERVICE), source (SOURCE) and id (ID). The chart is drawn as soon as the report opens. There are no filters.
Reading the chart
The selected item is in the middle, with its id as the chart title and its type underneath.
| Position | What it shows |
|---|---|
| Left | What the item belongs to or is based on (its parents) |
| Middle | The selected item |
| Right | What the item points to, or what uses it (its children) |
Each box shows an id and, underneath, a name or label where there is one. The colour tells you what kind of entity a box is:
| Colour | Entity |
|---|---|
| Grey | Data: curves and timeseries |
| Tan | Master data records |
| Pale grey | Event lists |
| Yellow | Types, scripts and calendars |
Click any box to redraw the chart around that entity, and keep clicking to follow a chain of dependencies. Hover over a box to see its service. The chart grows taller as more boxes are added and scrolls inside its own frame.
Long ids are cut off at the edge of a box. Hover over the box or click it to see the full id as the chart title.
What is shown for each kind of item
| Selected item | Left (parents) | Right (children) |
|---|---|---|
| Master data record | Its type (#Object if it has none) | Every property that is a reference to another entity, labelled with the reference name |
| Smart curve | Its master data record | The base curve (labelled BASE), every curve in its properties (labelled with the property name), the script and expression, the expiry calendar, the holiday calendar, and any smart curves built on it |
| Event curve | Its master data record | The event list, the expiry calendar and the holiday calendar, and any smart curves built on it |
| Other curve or timeseries | Its master data record | Any smart curves built on it |
| Type | The type it extends (#Object if none) | Its subtypes, then the records of that type, or the event lists of that type for an event type |
| Expiry calendar | The event curves, smart curves and curves that use it | Its holiday calendar |
| Event list | Its event type and the event curves and timeseries built from it |
Other kinds of item are not supported yet: the chart title says, for example, script - not supported yet.
A smart curve
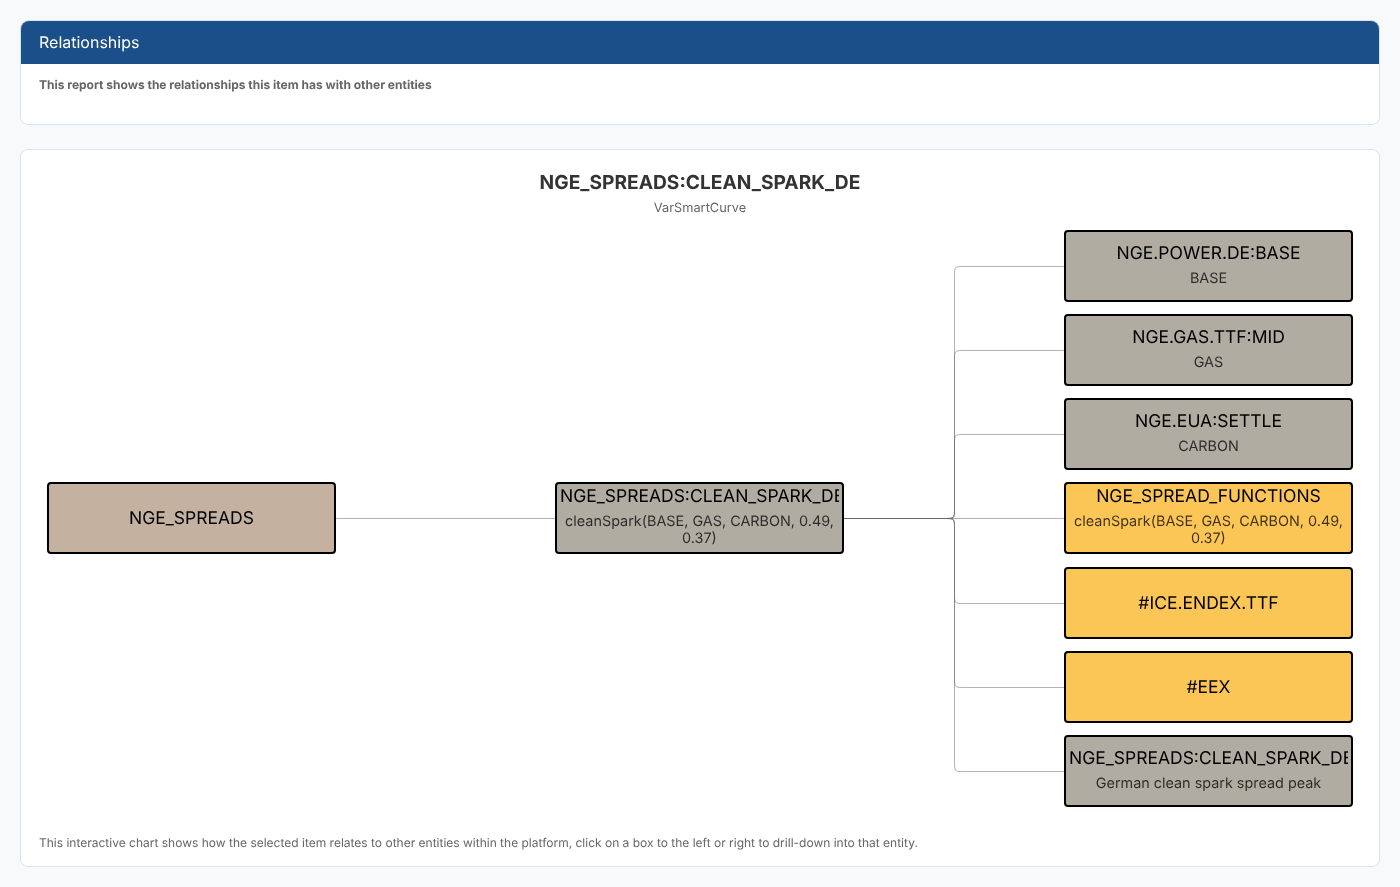
The clean spark spread is built from German power base (BASE), TTF gas (GAS) and EU carbon (CARBON) with the script NGE_SPREAD_FUNCTIONS, on the expiry calendar #ICE.ENDEX.TTF and the holiday calendar #EEX. The peak spread at the bottom is another smart curve that uses it as its base.
A type
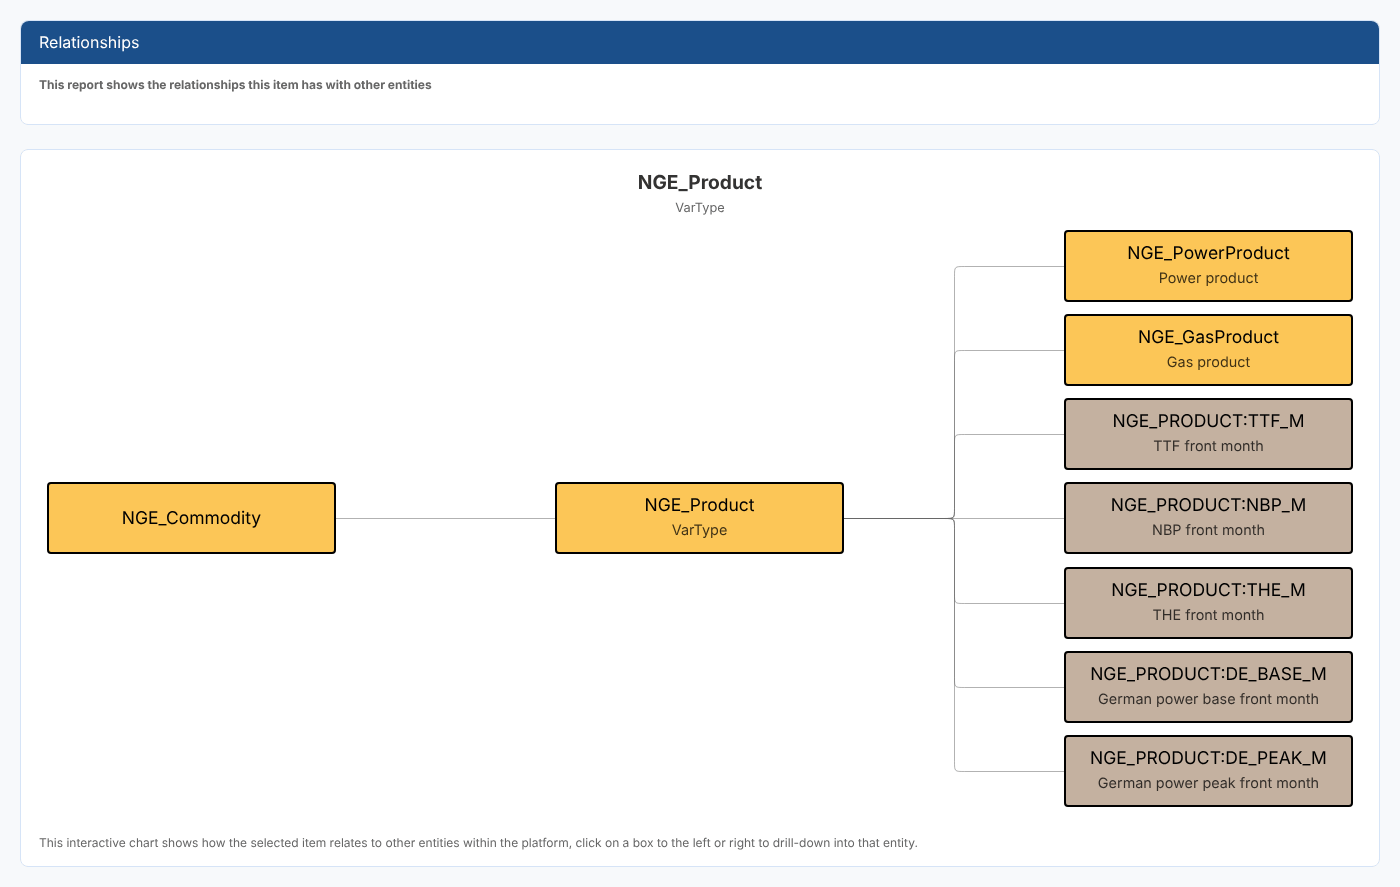
NGE_Product extends NGE_Commodity, has two subtypes, and is used by five product records.
Troubleshooting
| Problem | What to do |
|---|---|
| The chart is empty or shows only the item | The item has no links the report knows about, or you have no read access to the linked items. |
| The title says not supported yet | The report does not draw relationships for that service. |
Related
- Insights: how insight reports work
- Curve Dependency Report: the full build chain of a curve
- Master Data Usage Report: every record of a type, as a table
- Usage