Tracer
When something goes wrong, the evidence is spread over several logs: who changed the item, which automations ran, which queue messages were sent and who read it. The Tracer report gathers all of that for the selected item into one timeline and answers questions like:
- What happened to this curve this morning, and in what order?
- Which automations did this process run trigger, and did its queue messages get through?
- Who changed this item recently, and what did they change?
- Who read the item after it was updated?
- What did one run start, from the data it loaded to the exports that failed because of it?
At Northgate Energy, Tom Clarke traces last night's run of the process NGE_EOD_CURVES after the risk system missed a TTF price.
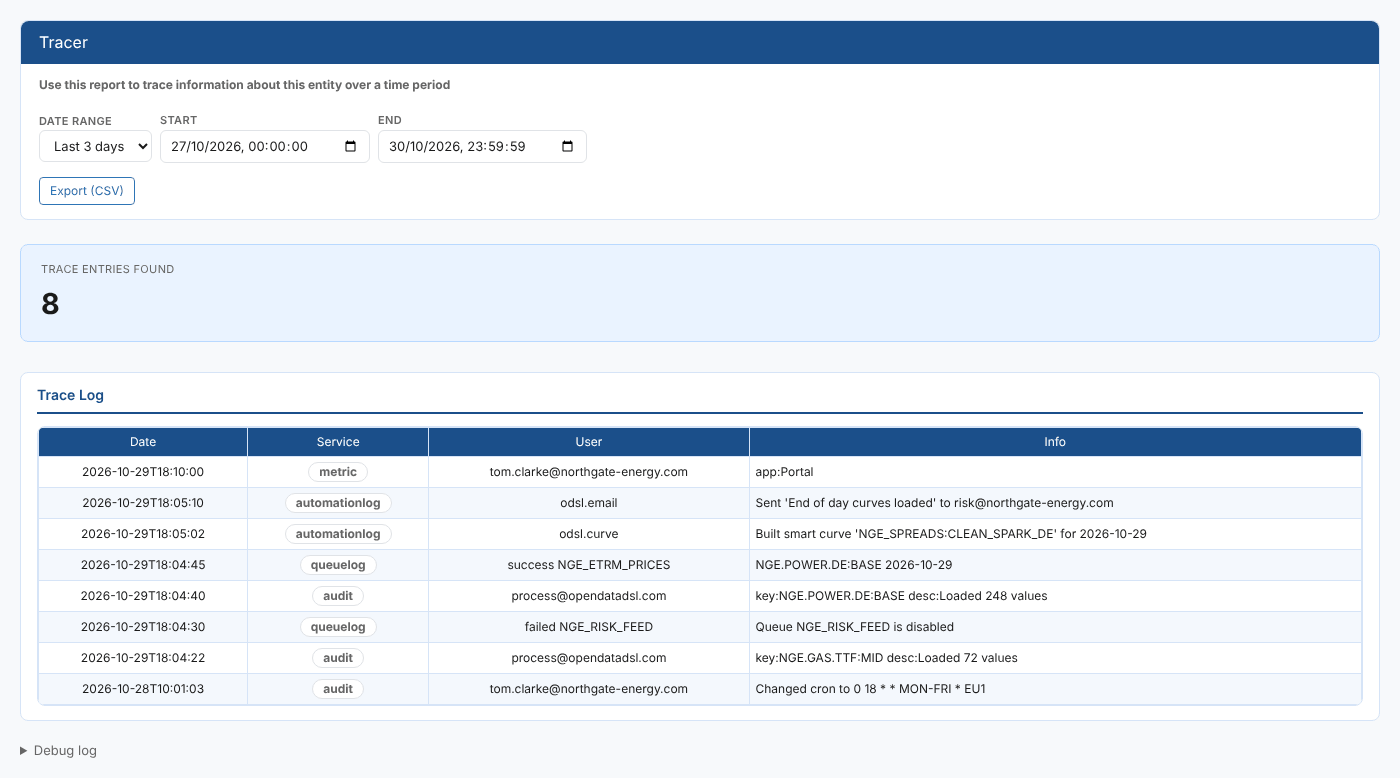
Opening the report
Tracer is an item insight: select an item, then open Tracer from its insights. It is registered as #INSIGHT_ITEM_TRACER in the category *Item Insights*.
The portal passes the item's service (SERVICE) and id (ID), or the dataset id (DSID) for a dataset, plus the selected execution (EXECID) for a process run or the selected ondate (ONDATE) for a curve or dataset. What the report looks for depends on the service, as described under What is traced.
The trace runs as soon as the report opens, for Today, and rows appear as each log is read.
| Control | What it does |
|---|---|
| Date range | Today, Yesterday, Last 3 days or Last 7 days. Choosing one fills in Start and End and runs the trace again. |
| Start, End | Change either date and time to set your own range |
| Trace id | A run's trace id, such as the one on a root cause. The report then follows that run instead of the item (see Following a run). Clear it to go back to the item. A TRACE report property fills it in when the report opens |
| Export (CSV) | Downloads the trace log as shown, as trace-log.csv |
| Debug log | At the bottom of the page: each step of the trace and how many entries were found |
The report
The Trace entries found card counts the rows. The Trace Log table lists them newest first:
| Column | What it shows |
|---|---|
| Date | When it happened |
| Service | Which log the row comes from: audit, metric, automationlog, queuelog or group |
| User | For audit and usage rows, the user. For automation rows, the automation target, such as odsl.email. For queue rows, the status and the queue, such as failed NGE_RISK_FEED. |
| Info | For audit rows, the first change (Changed properties.source to ICE Endex settlement) or the key and description. For usage rows, the application (app:Excel Add-in). For automation rows, the message. For queue rows, the failure reason or the message subject. |
Tracing a data item
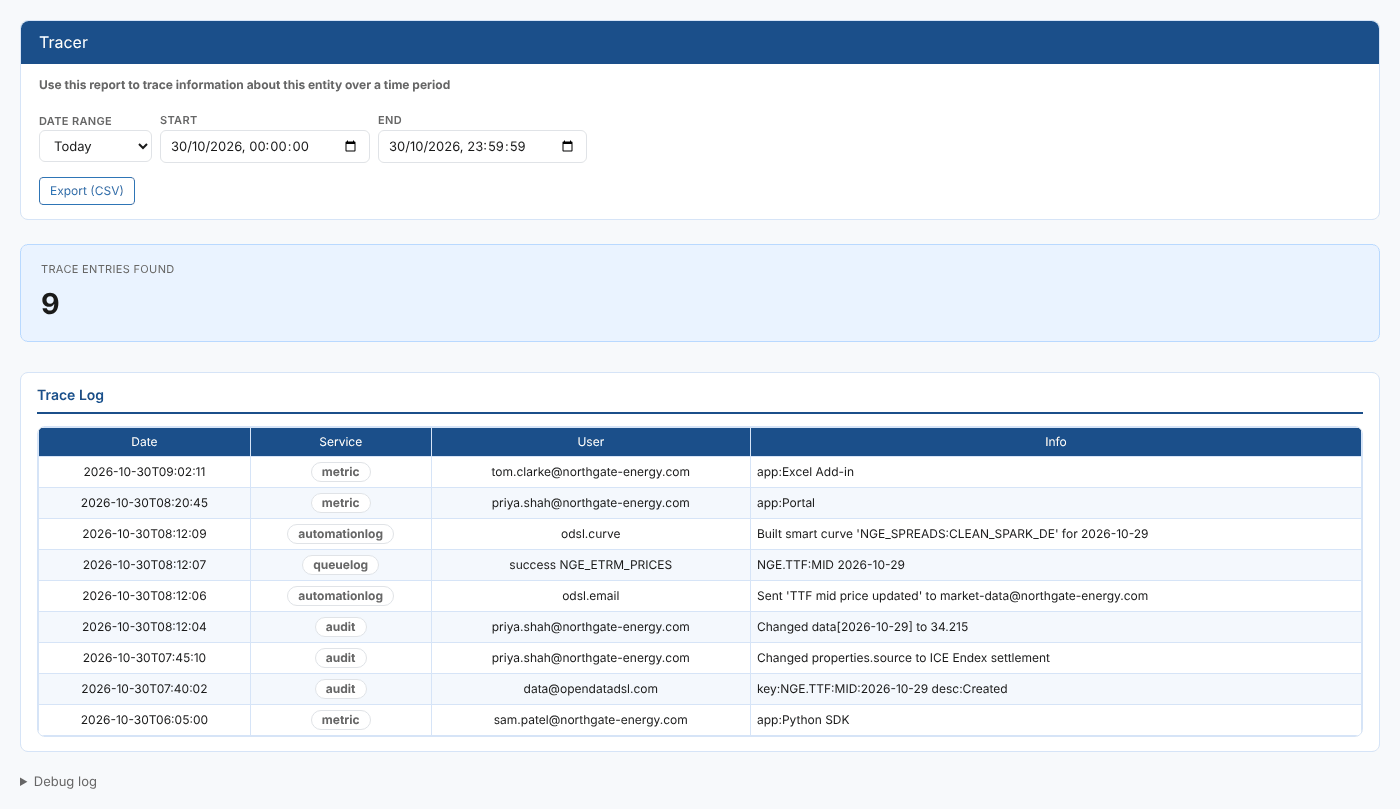
For the TTF mid price, the trace shows the load at 07:40, the property change and new value, the email and smart curve build automations it triggered, the message sent to the ETRM queue, and the people who read it afterwards.
Following a run
Every piece of work a process run starts carries the run's trace id, however many steps later: the data it saves, the automations those saves trigger, the curves they build and the exports that follow. Give the trace id in Trace id to see all of it in one log, oldest first.
| Service | What is read |
|---|---|
process | The run that started the trace, and every process run started from it |
delivery | Each dataset delivery the run made (private and common), with the loader and reason |
curve build, export | Each curve build and export that ran in the trace, with its status or error |
automationlog | The automations that ran in the trace |
queuelog | The queue messages sent in the trace |
alert | The alerts raised in the trace; a root cause is marked |
alert impact | The problems folded into root causes in the trace, and whether they recovered |
The date range is not used while a trace id is given. Each part is read on its own: one you cannot read is noted in the debug log and the rest is shown.
What is traced
For every item, the trace starts with two logs, both limited to the date range:
| Log | What is read |
|---|---|
| Audit trail | Changes to any key starting with the item's id (so a curve's stored ondates are included), from the private audit trail, or the public one for an id starting with # |
| Usage | Requests for the item (service and id) |
It then adds the logs that fit the kind of item:
| Selected item | Also read |
|---|---|
Process run (EXECID) | Automation log entries, queue messages and audit records of that run and anything it started |
Dataset (ONDATE) | The dataset's delivery for the ondate, and the automation log entries of each delivery run |
Curve (ONDATE) | The curve's builds for the ondate, and for each build its automation log entries, queue messages and audit records |
| Data item | Automation log entries for the item, and queue messages whose content is the item |
| Report | Automation log entries and queue messages for the report. For a curve group report, the group and the audit trail of each curve in it. |
| Queue | Queue messages sent to the queue in the range. For a report message, the report's automation log entries and the audit records of those runs. |
Only the audit trail, usage and queue messages for a queue are limited to the date range. The run, build and delivery logs of a process, curve or dataset are read in full, because they belong to the selected run or ondate.
Troubleshooting
| Problem | What to do |
|---|---|
| No trace entries found for the selected range. | Choose a longer range. For a process, open the report from the run on the executions list, so that the run is passed to it. |
| A process trace shows only audit and usage rows | The report was opened without a run (EXECID). Open it from the selected execution. |
| Nothing found for trace ... | Check the trace id. Runs before the platform started recording traces have none. |
Related
- Insights: how insight reports work
- Usage
- Item Audit Report
- Automation Logs
- Queue Log
- Root causes: alerts that follow a run