Event Analysis
Event lists hold things that happen at a point in time: trades, outages, nominations, weather observations. The Event Analysis report lets you explore one event list without writing a query, and answers questions like:
- How many trades were booked this month, and on which days?
- What is the total volume per book and tenor?
- What are the average, lowest and highest prices, and how are they spread?
- Which fields does the event list have, and how often is each one filled in?
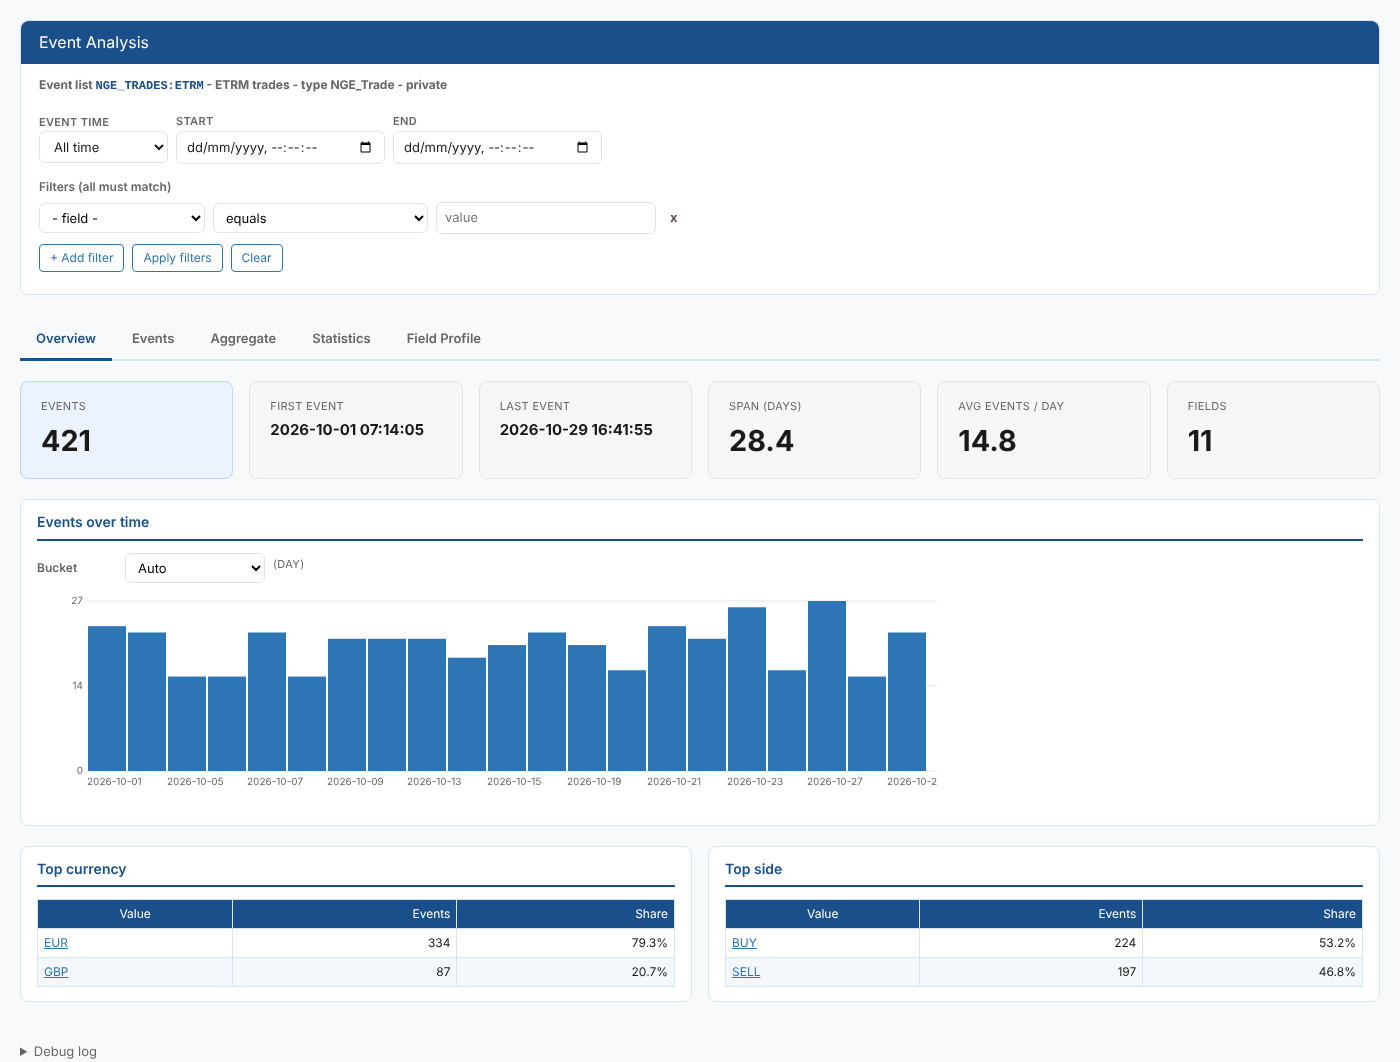
At Northgate Energy, Tom Clarke opens it on NGE_TRADES:ETRM, the trades loaded from the ETRM, to check October's TTF trading and the volume by book.
Opening the report
The report works on one item, so you open it from the item's insights on the Data screen. It is registered as Event Analysis (#EVENTI_ANALYSIS) in the Data Insights category and is hidden from the Reports list.
| Opened on | What is analysed |
|---|---|
| An event list | The events in that list |
| An event curve or event timeseries | The events in the list it is built from, with the item's own filter applied |
| Any other type | A Not applicable message instead of the tabs |
The header shows what you opened, its name, the event type and where the events are stored. Every count and statistic is calculated on the platform, so the report works on large event lists.
Filters
The filters at the top apply to every tab.
| Control | What it does |
|---|---|
| Event time | All time, Today, Yesterday, Last 7 days, Last 30 days, Last 90 days, Last 365 days, This month, Last month or Custom |
| Start, End | The event time range. Changing them switches to Custom. |
| Filters (all must match) | Rows of field, condition and value. Conditions: equals, not equal to, greater than, at least, less than, at most, contains, starts with, is one of (comma separated), has a value, has no value. |
| + Add filter, Apply filters, Clear | Add a row, apply the rows, or remove every filter. The applied filters are shown as chips under the buttons. |
Click a value in a Top values table, an aggregate result or a categorical breakdown to add it as a filter straight away.
The tabs
Overview
| Part | What it shows |
|---|---|
| Events | The number of events matching the filters |
| First event, Last event | The earliest and latest event time |
| Span (days), Avg events / day | The time between them, and events per day over that span |
| Fields | How many fields were found |
| Events over time | A column chart of events per bucket. Bucket chooses Hour, Day, Month or Year; Auto picks one from the span. |
| Two Top tables | The five most common values of the two text fields that best split the events, with their count and share |
Events
The events themselves, 50 to a page by default, newest first. Click a row to see every property of that event in Event Details below.
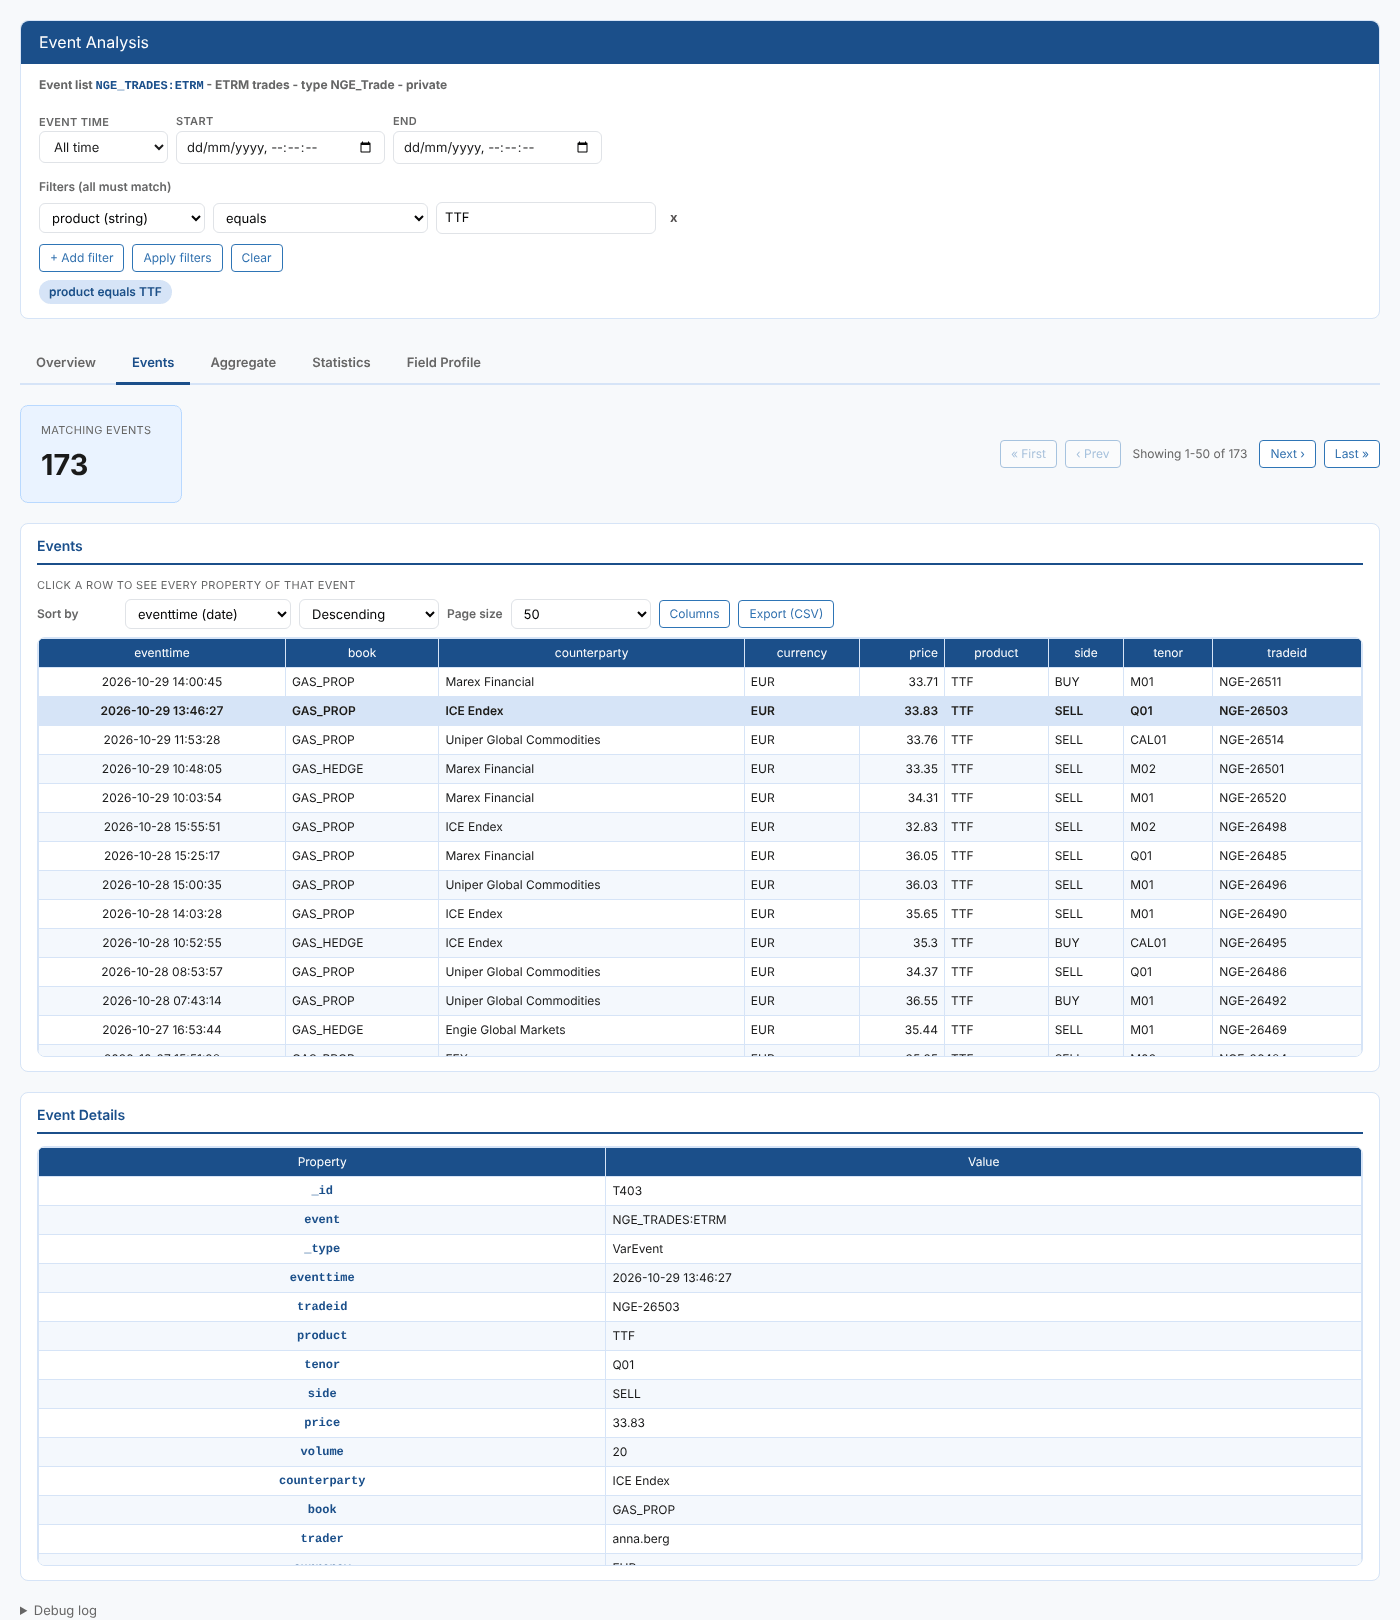
| Control | What it does |
|---|---|
| Sort by and the direction | Sorts on any field, on the platform |
| Page size | 25, 50, 100 or 250 events per page |
| Columns | Choose the columns. The event time and the first eight other fields (alphabetically) are shown at first. |
| Export (CSV) | Downloads every matching event, not just the page, with the columns shown |
| First, Prev, Next, Last | Move between pages |
Aggregate
Build a group-by without writing a query.
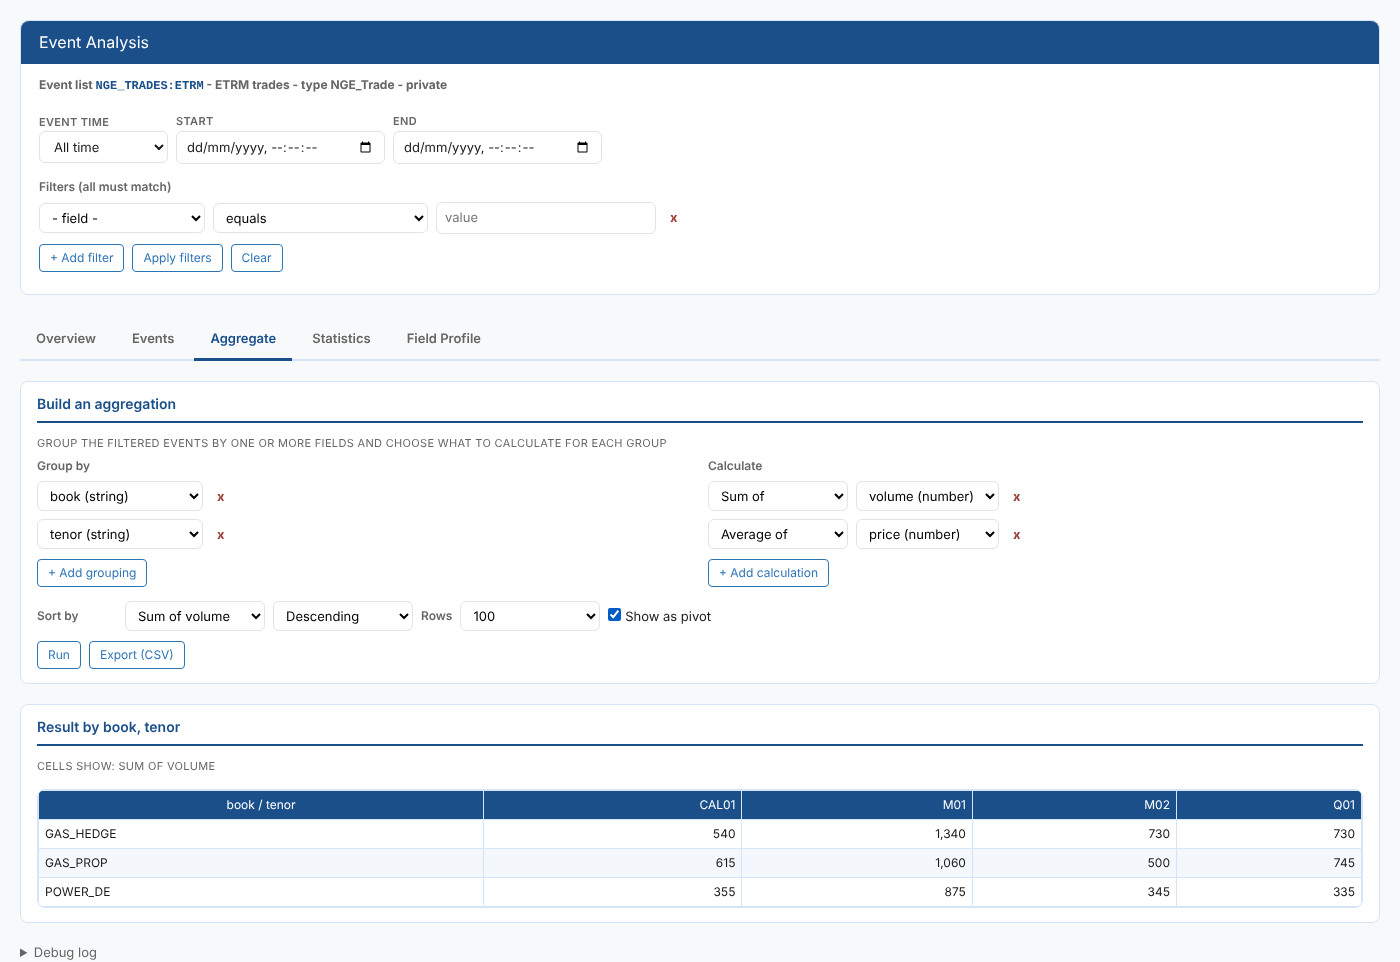
| Control | What it does |
|---|---|
| Group by | One or more fields. A date field can be grouped as the exact value, by year, by month, by day or by hour. |
| Calculate | One or more calculations: Count of events, Sum of, Average of, Minimum of, Maximum of, Std dev of, Distinct count of |
| Sort by, Rows | The order of the result and how many groups to show (25 to 1000) |
| Show as pivot | With exactly two groupings, shows the first calculation as a grid: first grouping down, second across |
| Run, Export (CSV) | Runs the aggregation, or downloads the result table |
With one grouping, a bar chart of the first calculation is shown above the table.
Statistics
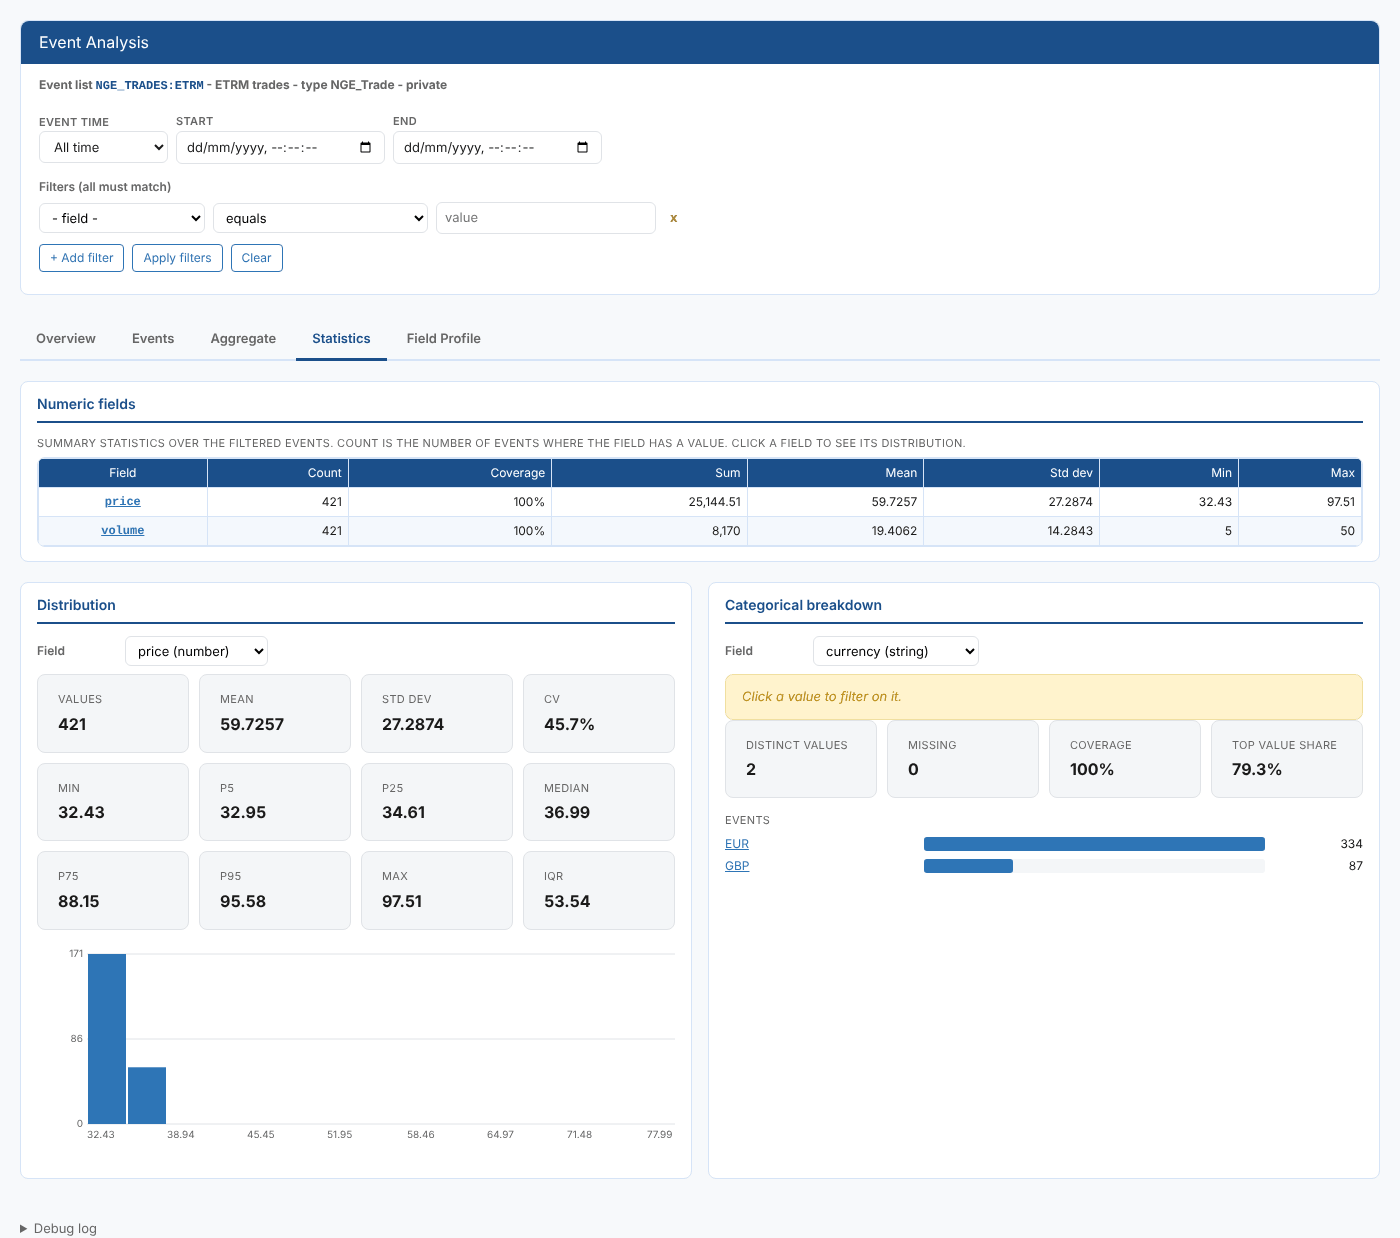
| Part | What it shows |
|---|---|
| Numeric fields | For each number field: Count (events with a value), Coverage, Sum, Mean, Std dev, Min, Max. Click a field to see its distribution. |
| Distribution | For the chosen number field: values, mean, standard deviation, coefficient of variation, minimum, 5th, 25th, 50th, 75th and 95th percentiles, maximum and interquartile range, and a 20-bar histogram. Scroll the histogram sideways to see all of it. |
| Categorical breakdown | For the chosen field: distinct values, missing values, coverage, the top value's share, and bars for the 20 most common values |
Field Profile
Every field found in the event list, so you know what you can filter and group on.
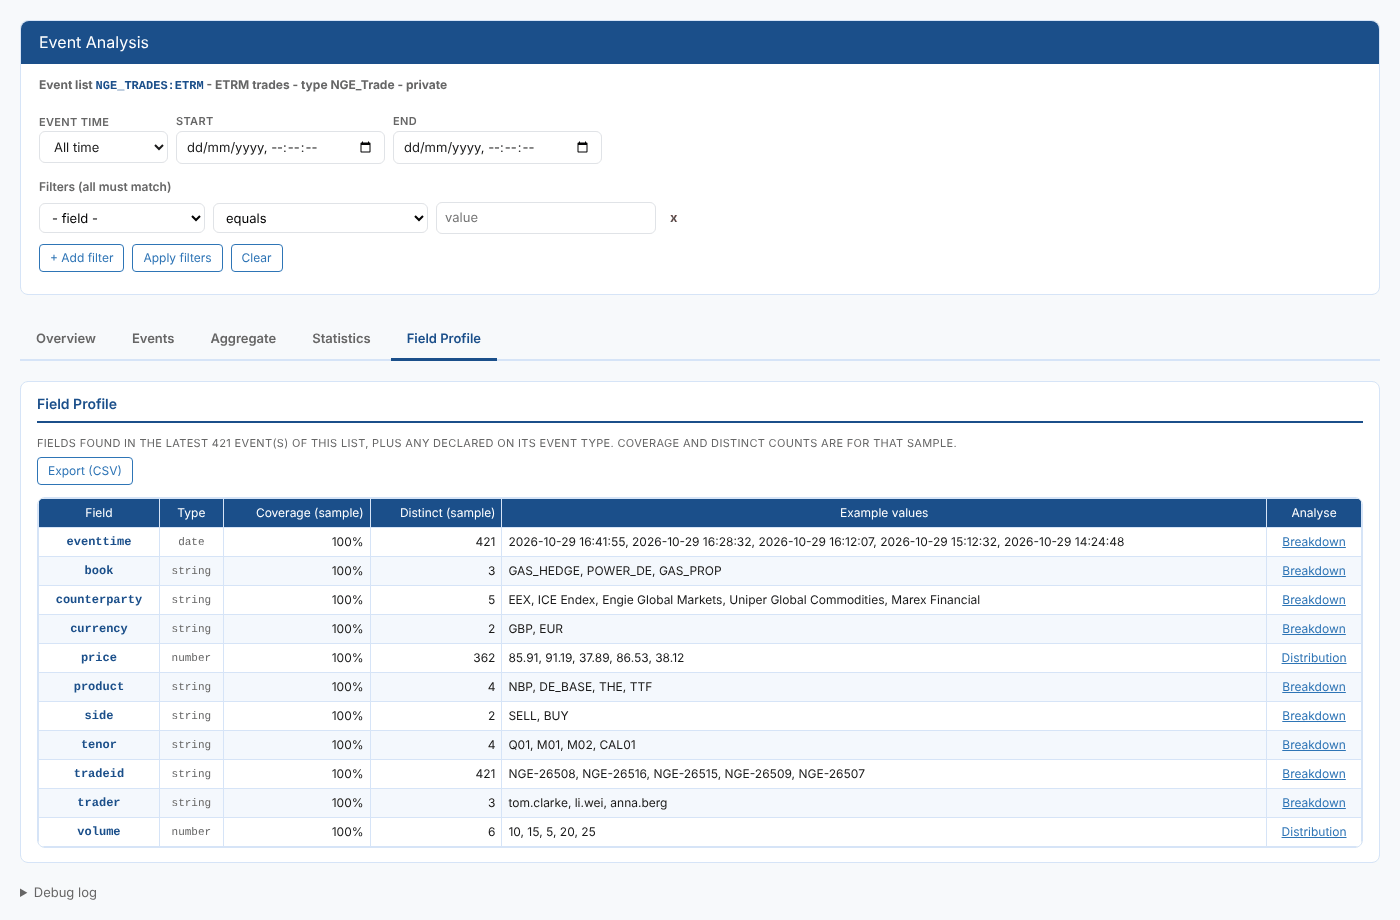
| Column | What it shows |
|---|---|
| Field | The field name. Nested fields are shown with dots, for example delivery.start. |
| Type | date, number, string, boolean, array or object. Fields declared on the event type but not found in the sample are marked (declared, not seen). |
| Coverage (sample), Distinct (sample) | How often the field is filled in, and how many different values it has |
| Example values | Up to five values |
| Analyse | Distribution for numbers or Breakdown for other fields: opens the Statistics tab on that field |
Fields are found from the latest 500 events, plus the properties declared on the event type, so coverage and distinct counts here are for that sample. The other tabs use every matching event.
Related
- Data Report
- Insights: how insight reports work