User Activity Report
Every request to the platform is recorded with who made it, from which application, how long it took and how much data it returned. The User Activity Report turns those records into a picture of how the platform is being used:
- Who uses the platform most, and from where: the portal, Excel, Python or scripts?
- Which services are used most, and how much data do they return?
- Which requests are slow, and is it always the same report or curve?
- What did one user do this morning?
- Is anyone still working in the UAT or test environments?
At Northgate Energy, Sam Patel in IT runs the report weekly to see how the Excel add-in is being adopted and to catch slow reports before traders complain about them.
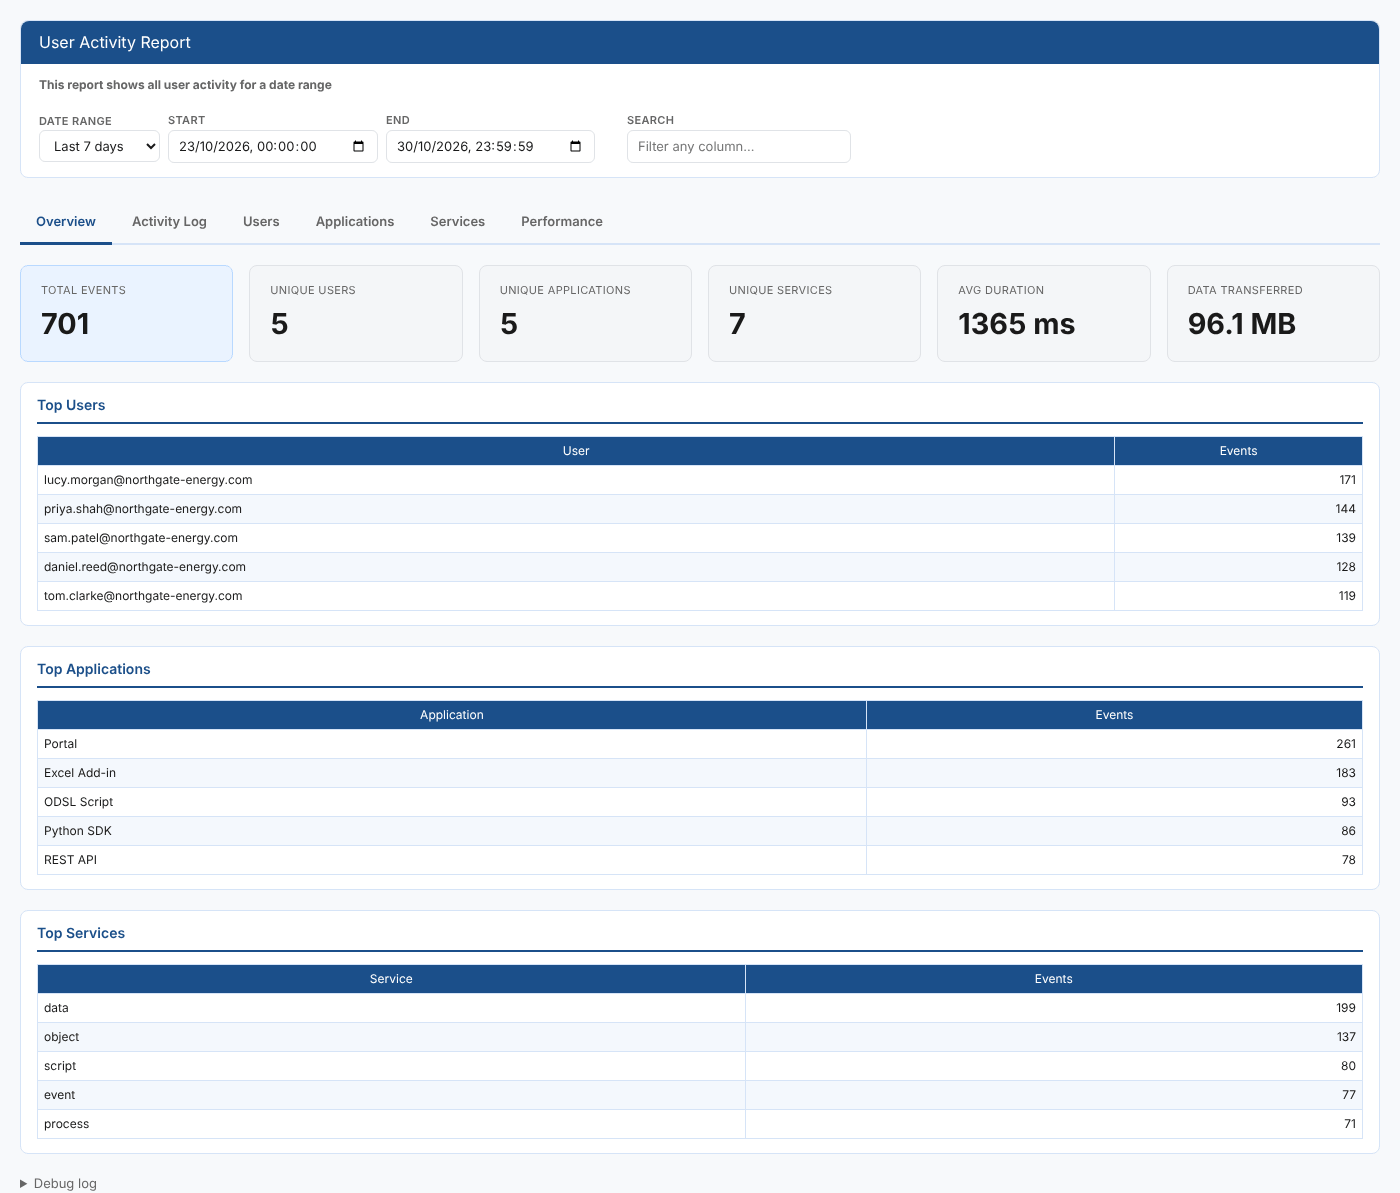
Opening the report
The report is in the Reports menu, in the Users category, as User Activity Report (report id #INSIGHT_USER_ACTIVITY). It opens on Today and loads straight away. Every tab uses the same date range and search.
| Control | What it does |
|---|---|
| Date range | Today, Yesterday, Last 7 days, Last 30 days, Last month or This month. Choosing one fills in Start and End. |
| Start, End | Change the start or end date and time yourself. The range starts at Start and ends just before End. |
| Search | Shows only requests where the user, action, application, service, key, date or environment contains the text (any case). It applies to every tab. |
| Debug log | At the bottom of the page: the requests the report made and how many records came back |
The presets work in UTC. Today starts at midnight UTC.
Key ideas
| Idea | What it means |
|---|---|
| Event | One request to the platform by one user |
| Application | Where the request came from, such as the portal, the Excel add-in, the Python SDK, an ODSL script or the REST API |
| Service | The platform service called, such as data, object or report |
| Key | The item requested, where there is one |
| Environment | The data environment the request was made in |
| Duration | How long the platform took to answer, in milliseconds |
| Size | How much data the answer contained, in bytes |
The tabs
Overview
| Card | What it shows |
|---|---|
| Total events | Requests in the range |
| Unique users | Different users |
| Unique applications | Different applications |
| Unique services | Different services |
| Avg duration | Average time to answer a request |
| Data transferred | Total size of all answers |
Below the cards, Top Users, Top Applications and Top Services show the five with the most requests.
Activity Log
The requests themselves, 50 to a page, with First, Prev, Next and Last to move between pages. Columns: User, Action, Application, Service, Key, Date, Environment, Duration (ms) and Size (bytes).
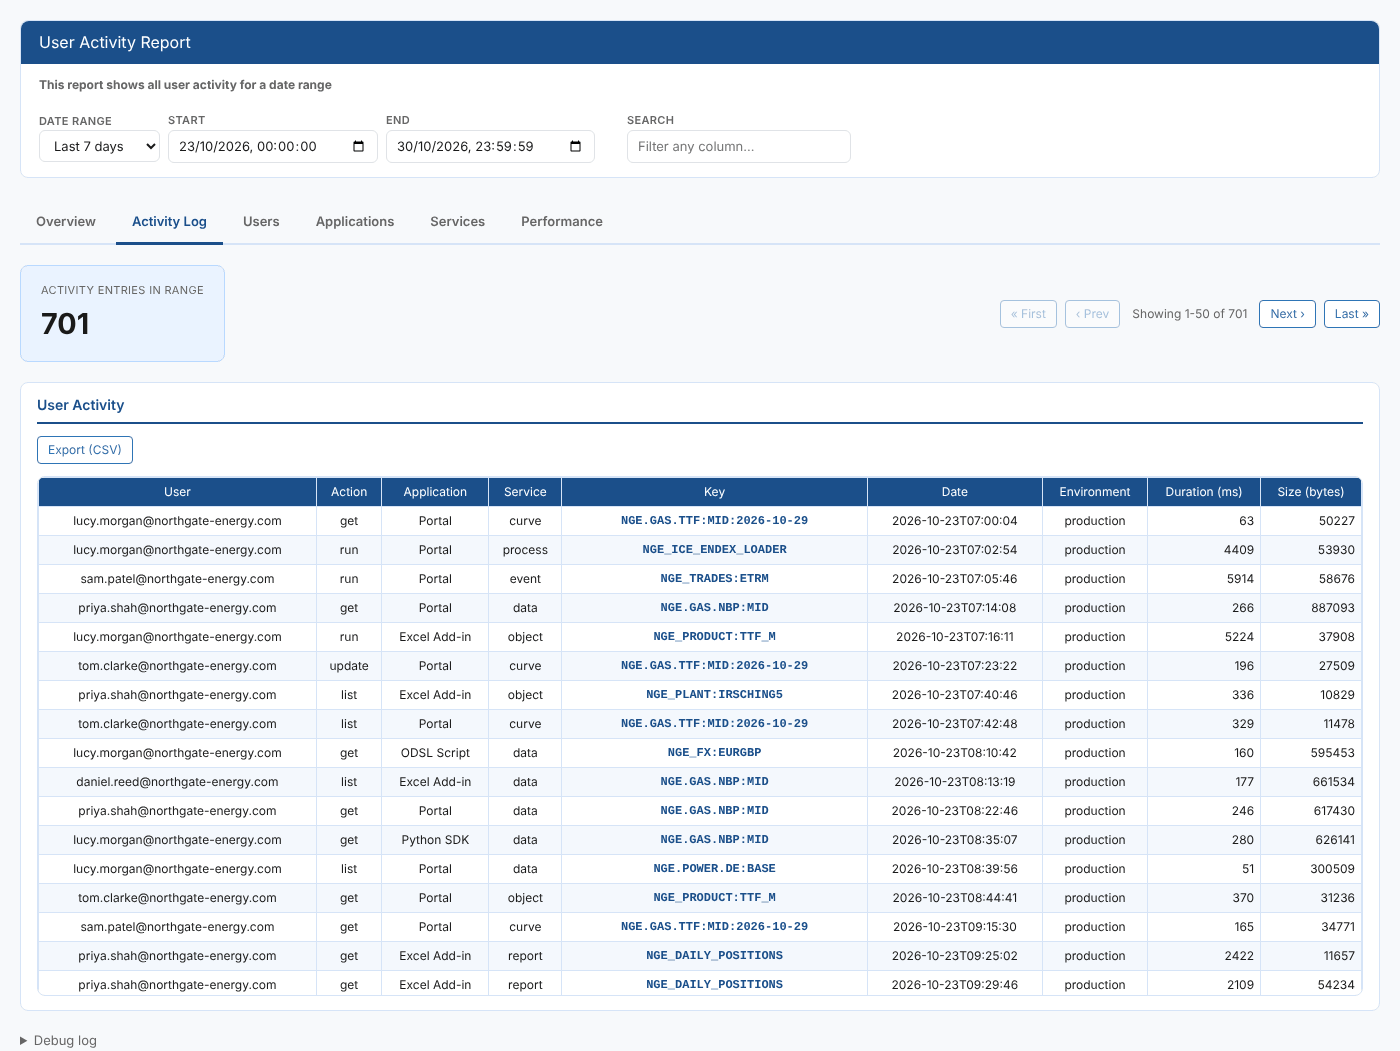
Select Export (CSV) to download every request that matches the date range and search, not just the page on screen.
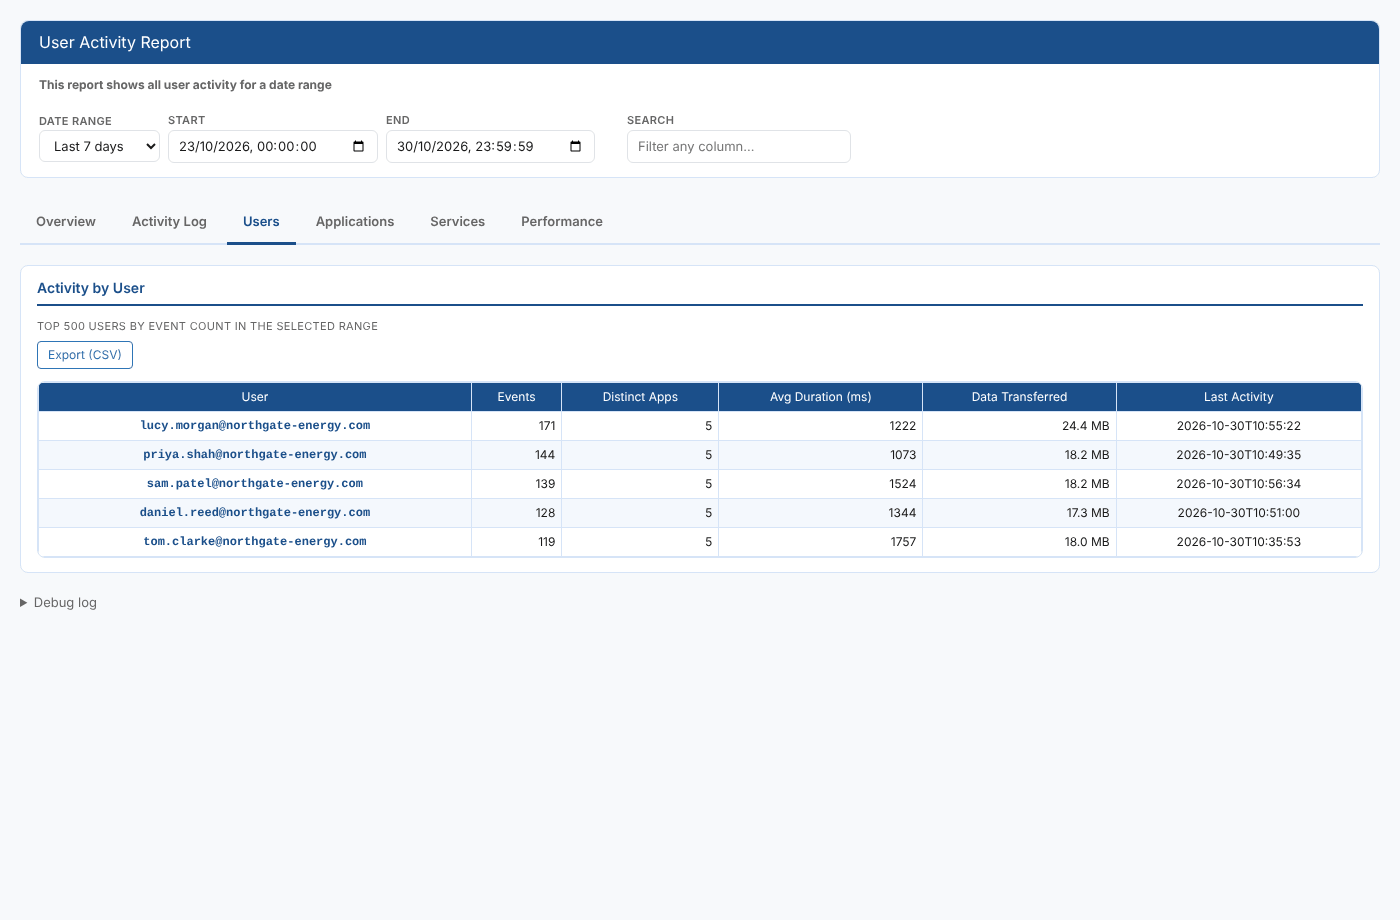
Users
One row per user, most active first (up to 500): Events, Distinct Apps, Avg Duration (ms), Data Transferred and Last Activity.
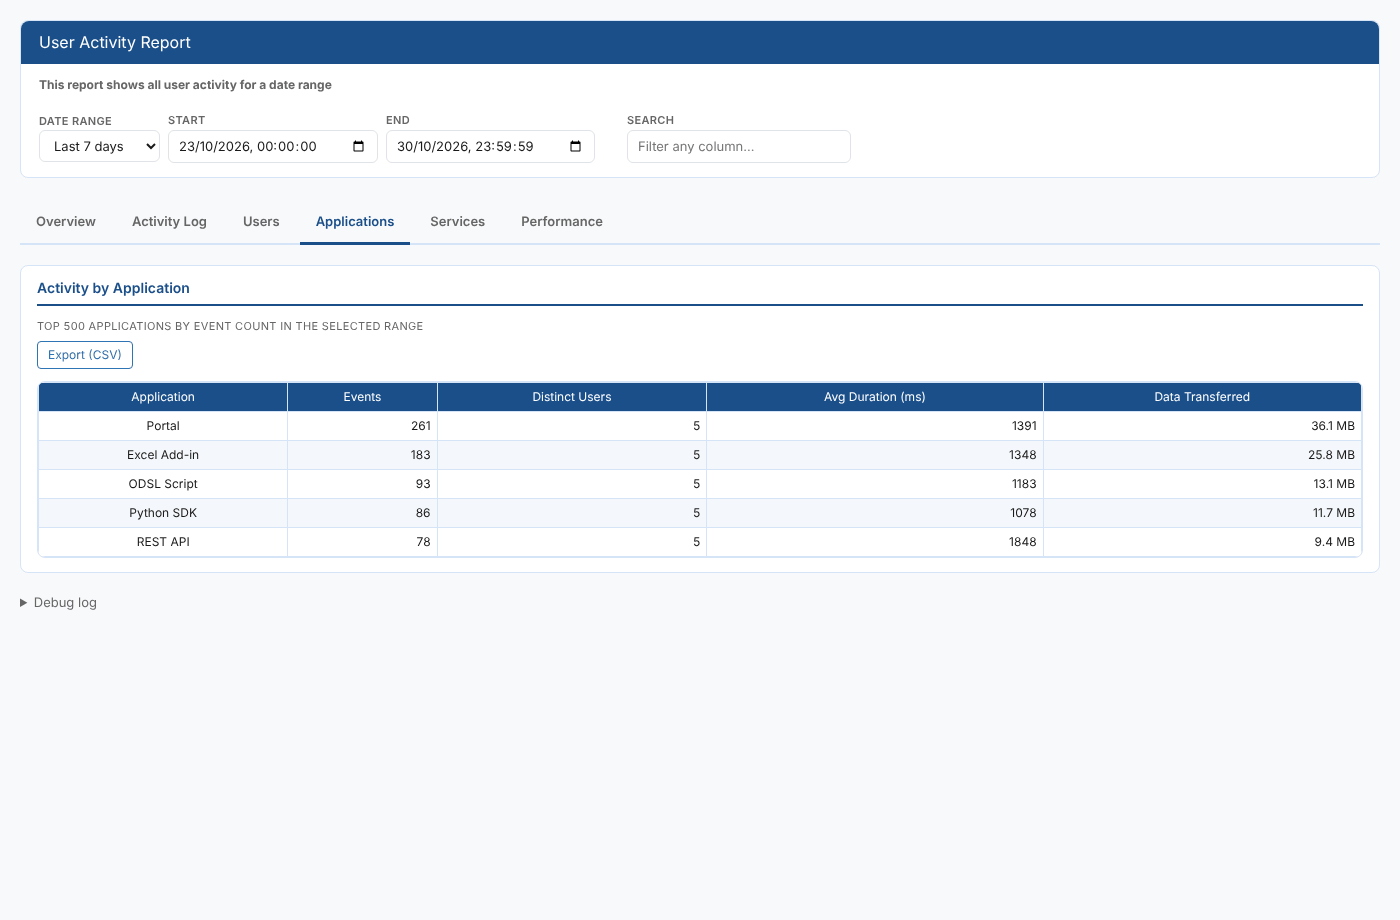
Applications
One row per application (up to 500): Events, Distinct Users, Avg Duration (ms) and Data Transferred.
Services
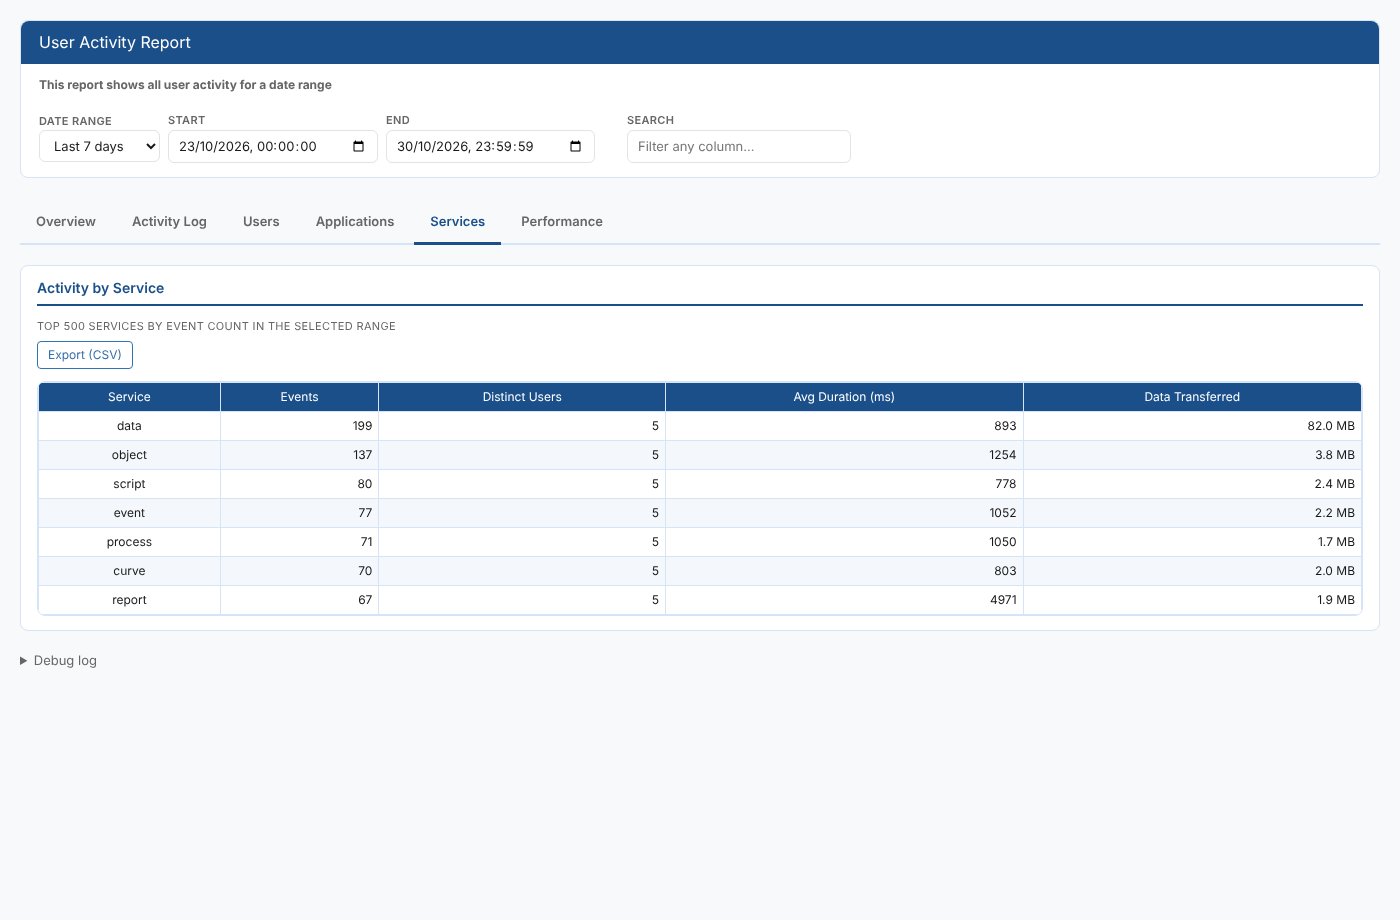
One row per service (up to 500): Events, Distinct Users, Avg Duration (ms) and Data Transferred.
Performance
Slowest Individual Events lists the 25 slowest requests in the range, with who made them and what they asked for. Average Duration by Action lists each action with its number of requests, average and longest duration, slowest first.
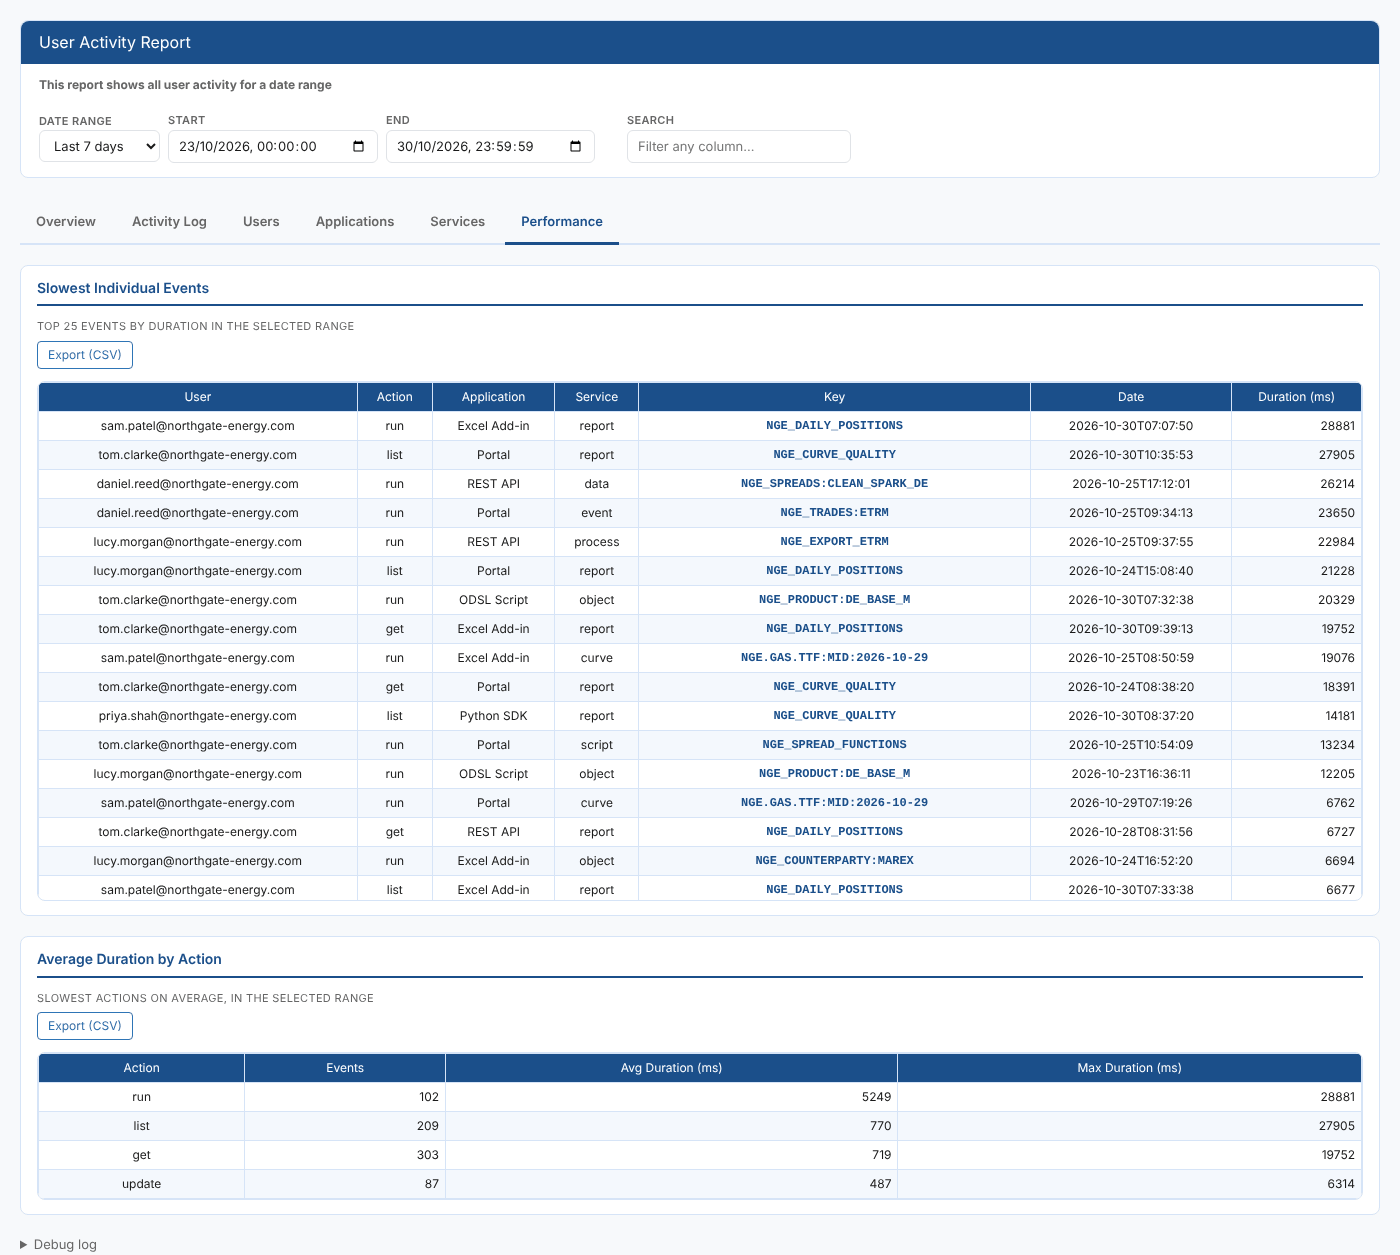
At Northgate the slowest requests are runs of the NGE_DAILY_POSITIONS report from Excel. That points to the report itself rather than the network or one user's machine.
Every summary table has its own Export (CSV) button, which downloads the table as shown.
Where the data comes from
| What | Where |
|---|---|
| Requests | The platform's request metrics (the metric service) |
| Summaries | Worked out on the server, so the tabs stay quick over long date ranges |
Troubleshooting
| Problem | What to do |
|---|---|
| The report is empty | Widen the date range, and check you have read access to the metric service. |
| A user is missing | Check the search box is empty, and that the user made requests in the date range. |
| The Activity Log is not in date order | The list is shown in the order the platform returns it. Use Export (CSV) and sort the file, or narrow the date range. |
Related
- Audit Report: the changes made, rather than every request
- Security & Access Insights: who can do what
- Insights: how insight reports work