Curve Ondate History
A forward curve is built again every business day. Curve Ondate History reads a curve's recent ondates and shows how each one looked, so you can spot a short curve, a jump or a missing day at a glance. It answers questions like:
- Was a curve built on every business day?
- Did any ondate have fewer tenors than usual, or empty values?
- How did the front tenor and the curve's average move from day to day?
- Which tenors came onto the curve, or left it, and when?
At Northgate Energy, Priya Shah opens it on the TTF forward curve NGE.GAS.TTF:FORWARD after the curve team reports that a build failed last week.
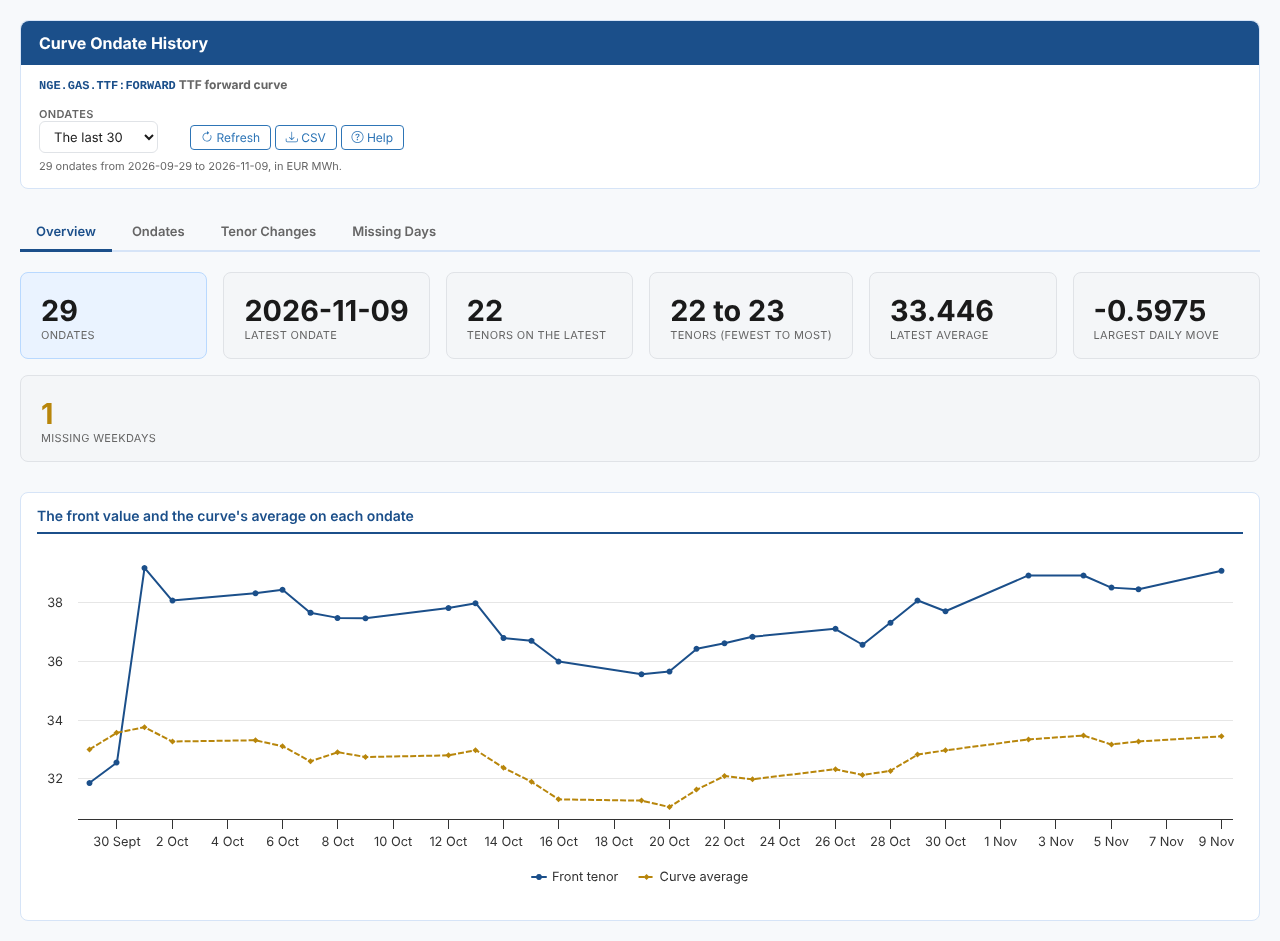
Opening the report
The report works on one item. Open it from the Insights tab of a curve in the Data Explorer, or from the item's insights on the Data screen. It ships with the Data Explorer extension and is registered as Curve Ondate History (odsl.data_explorer.curvehistory) in the Data Insights category. It is hidden from the Reports list.
It works on stored, smart, event and composed curves, and on curve series. A curve series is a curve whose ondates hold values at delivery times instead of tenors. On a timeseries, or any other item, it explains that it shows the history of a curve and draws nothing.
| Control | What it does |
|---|---|
| Ondates | The last 10, 30 (the default), 60, 120 or 250 ondates |
| Refresh | Reads the curves again |
| CSV | Downloads the summary of each ondate |
| Help | Opens this page |
The line under the controls says how many ondates were read, from when to when, and the currency and units. If some curves could not be read, it says how many.
Key ideas
| Idea | What it means |
|---|---|
| Ondate | The date a curve was built for |
| Front tenor | The first tenor of the curve, for example M01. For a curve series, the first delivery time |
| Average | The average of the curve's values on one ondate |
| Change | How the average moved from the ondate before |
| Came and went | Tenors on this ondate that were not on the one before, and the other way round |
| Missing weekday | A Monday to Friday between the first and last ondate with no curve |
The tabs
Overview
| Card | What it shows |
|---|---|
| Ondates | How many ondates were read |
| Latest ondate | The last ondate: amber when it is more than 4 days ago (hover to see how many days) |
| Tenors on the latest | How many tenors the latest curve has (Values for a curve series) |
| Tenors (fewest to most) | The smallest and largest number of tenors in the period |
| Latest average | The average of the latest curve |
| Largest daily move | The largest change of the average from one ondate to the next |
| Missing weekdays | Weekdays with no curve: green when there are none |
The chart below the cards shows the front tenor's value (solid) and the curve's average (dashed) on each ondate.
Ondates
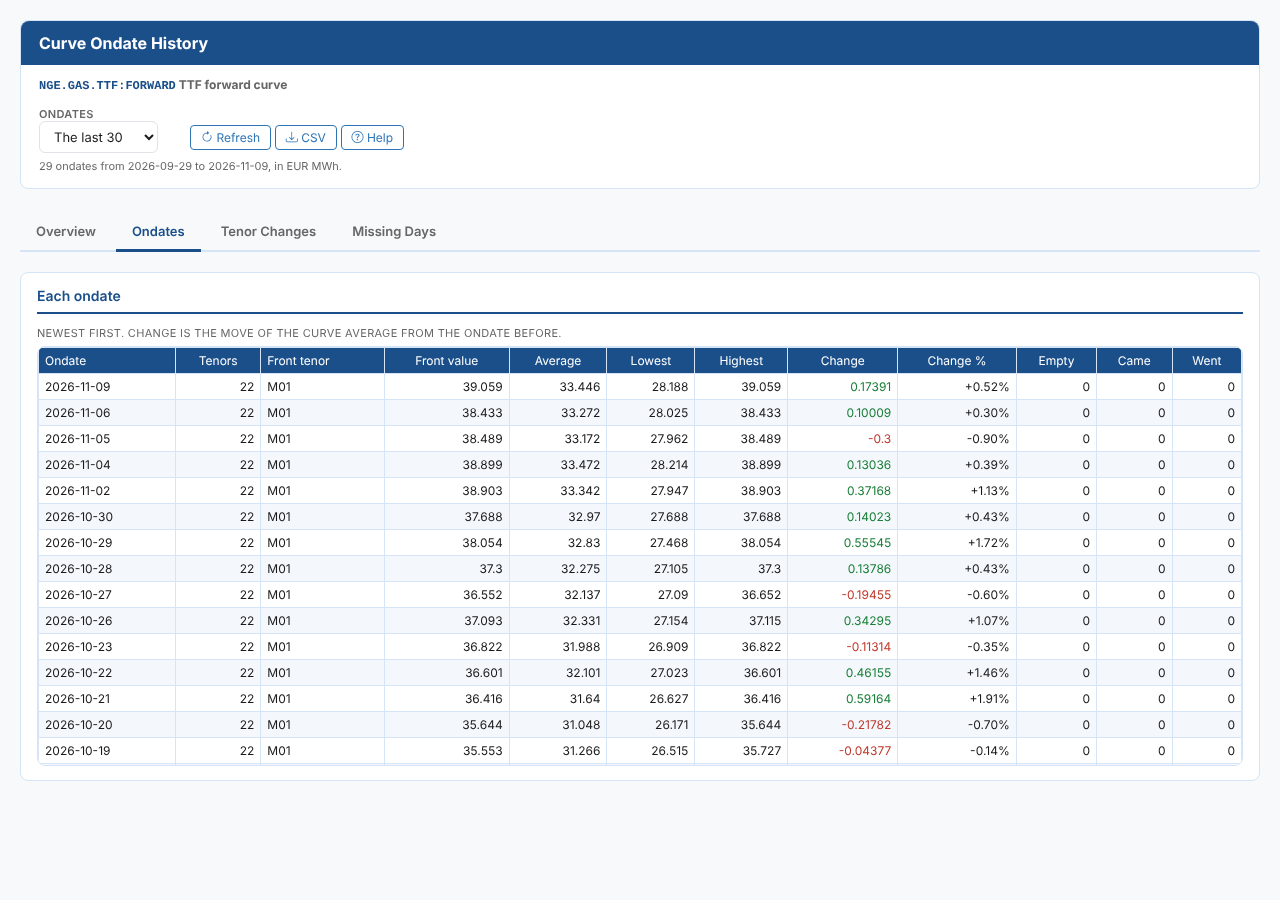
A table has one row per ondate, newest first. The columns are Ondate, Tenors, Front tenor, Front value, Average, Lowest, Highest, Change, Change %, Empty (tenors with no value, in red), Came and Went. For a curve series, the columns are Values, From and To (the first and last delivery times) and First value, with no Came and Went.
Tenor Changes
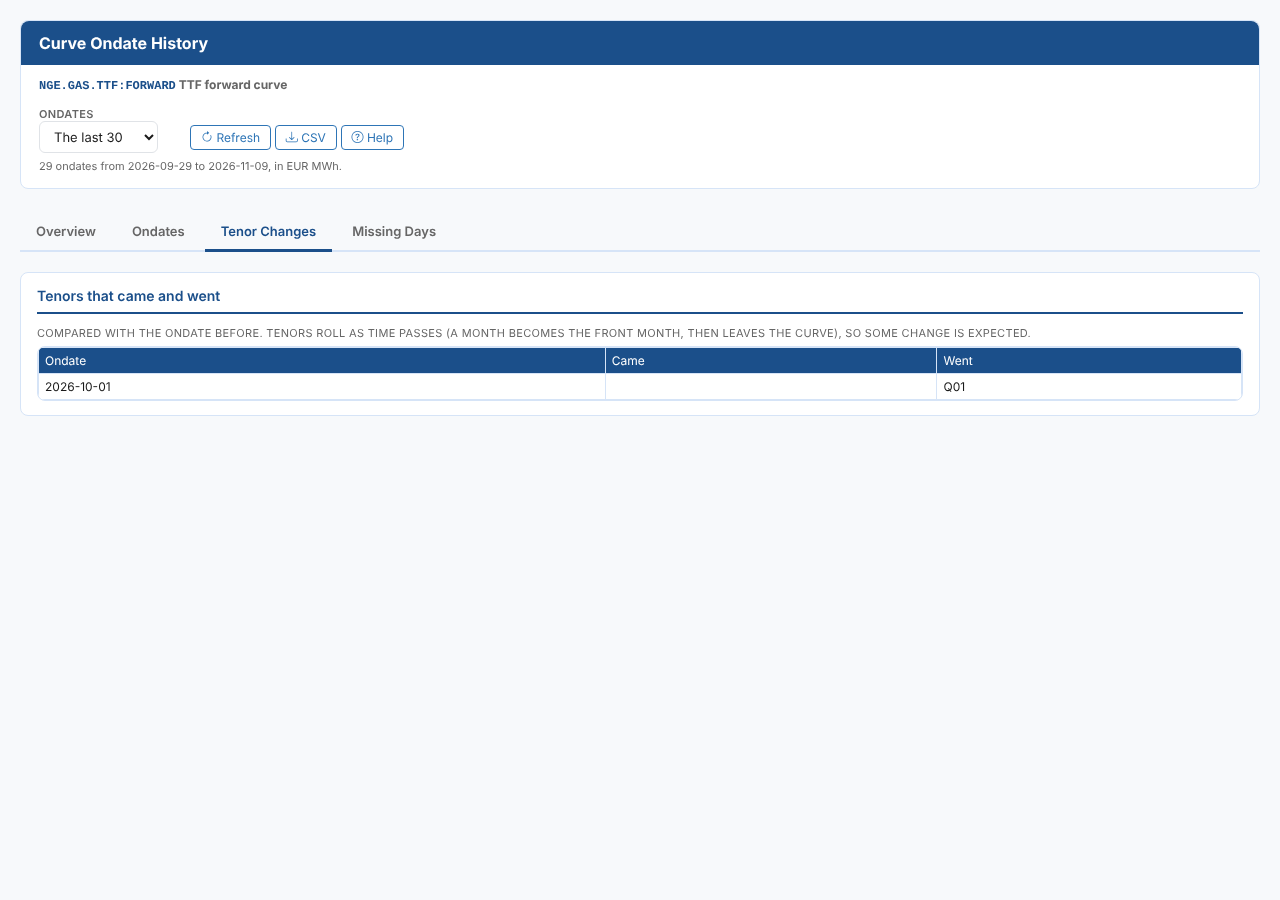
The ondates whose tenors changed from the ondate before, with the tenors that came and went. Relative tenors such as M01 stay the same from day to day. Absolute tenors such as 2026M12 roll off the curve as they expire, so some change is expected at the start of each month.
Missing Days
The weekdays between the first and the last ondate with no curve, newest first.
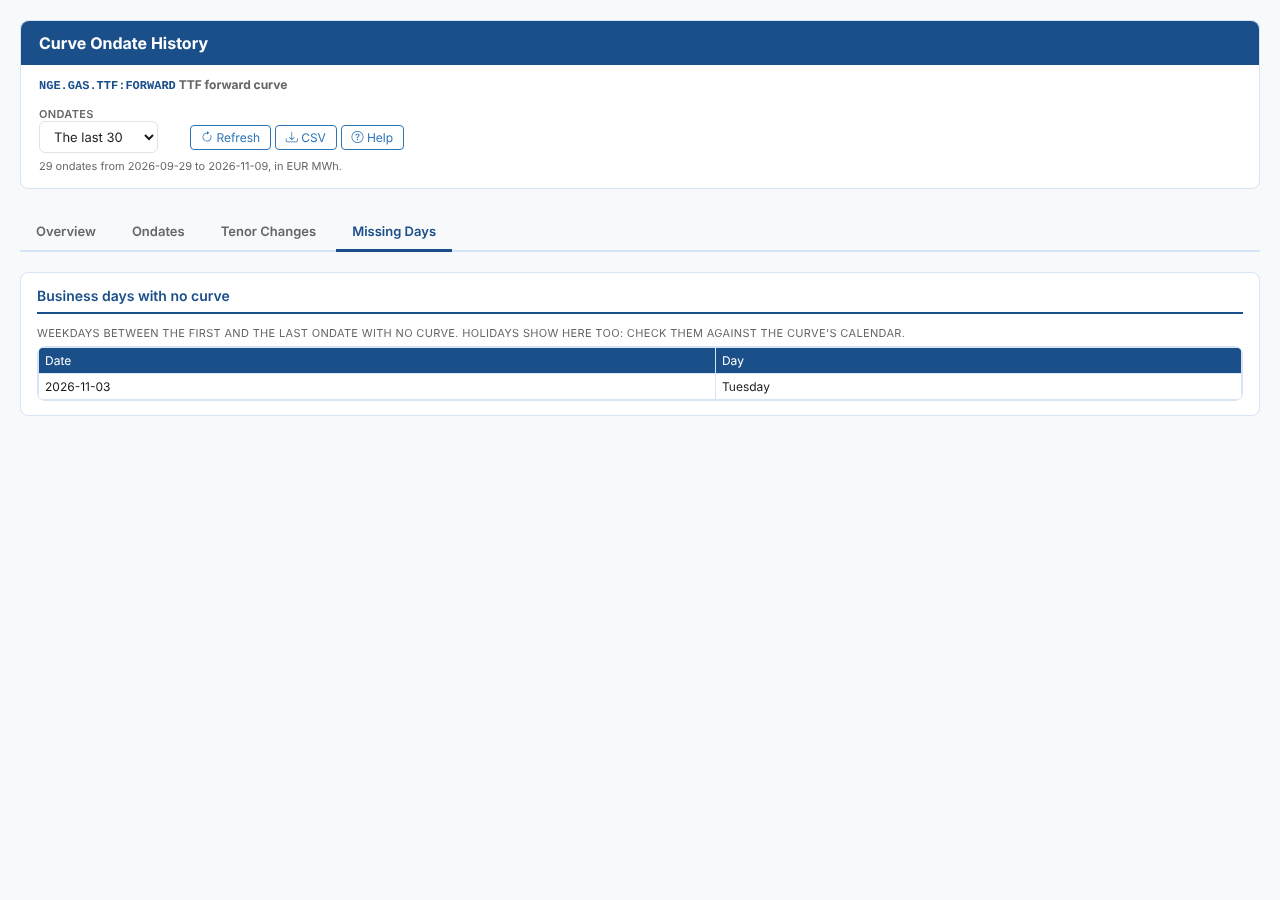
The report does not know the curve's holiday calendar, so public holidays show as missing weekdays too. Check them against the calendar.
Where the data comes from
The ondates come from the curve's dates, GET data/v1/{source}/ID?_range=last(N). Each curve is then read as GET data/v1/{source}/ID:ONDATE, four at a time. A smart curve is built on the platform each time it is read, so 120 or 250 ondates of a smart curve can take a while. All the figures are worked out in your browser.
Troubleshooting
| What you see | Why, and what to do |
|---|---|
| This report shows the history of a curve | The item is a timeseries or another kind of data. For a timeseries, use Timeseries Profile |
| There are no curves yet | The curve has no ondates |
| N could not be read | Those ondates are left out. Open them on the curve's Curve tab to see why |
Related
- Timeseries Profile
- Curve Dependency Report
- Data Explorer: Insights
- Insights: how insight reports work