Execution History
When a process misbehaves you want to see its recent runs side by side: when each one started and finished, whether it worked, and what it reported. The Execution History insight lists the runs of one process in a date range, and answers questions like:
- Did the ICE Endex loader run every evening this week?
- When did it start failing, and with what message?
- Was yesterday's run scheduled or started by hand?
At Northgate Energy, Priya Shah opens it on NGE_ICE_ENDEX_LOADER after the last two evening runs failed.
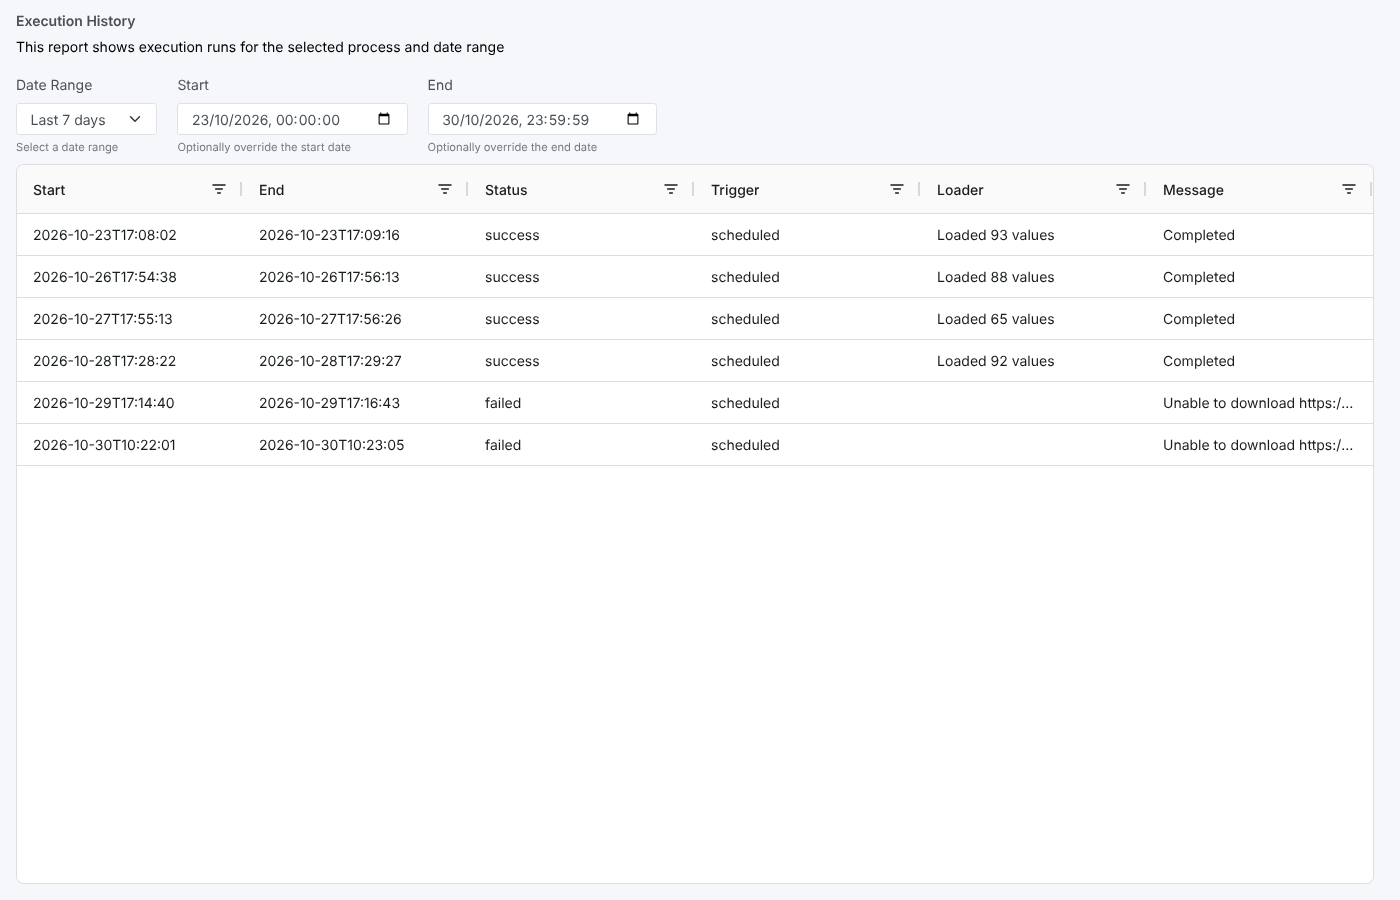
Opening the report
Execution History (report id #PROCESSI_EXEC_HISTORY, category Process Insights) is an item insight: it does not appear in the Reports menu. Select a process, then open Execution History from its insights menu. The report shows the runs of that process (matched on the process name) started Today when it opens.
| Control | What it does |
|---|---|
| Report name | Click the report name at the top to hide or show the description and date controls, to give the table more room |
| Date Range | Today, Yesterday, Last 7 days, Last 30 days, Last 60 days, This month, Last month or All. Choosing one fills in Start and End and reloads the table. |
| Start, End | The range of run start times shown |
The report
One row per run whose start time is in the range:
| Column | What it shows |
|---|---|
| Start | When the run started (UTC) |
| End | When the run finished (UTC); empty while it is still running |
| Status | The run's status, such as success, warning, failed or running |
| Trigger | What started the run, such as scheduled or manual |
| Loader | The loader's summary, for example how many values were loaded |
| Message | The run's final message, or the error when it failed |
Each column heading has a filter menu to narrow the rows on screen, and you can click a heading to sort by that column. Up to 10,000 runs are loaded.
For phases, logs, failure details and the automations a run triggered, open Process Execution Insights, select the process and click the run on the Executions tab.
Troubleshooting
| Problem | What to do |
|---|---|
| The table is empty | The process did not start in the range. Choose a longer range, and check the schedule with the Process Cron Audit Report. |
| Changing Start or End by hand does not reload the table | Choose a range from Date Range instead. In the current version of the shared date selector, typing your own dates does not refresh the report. |
Related
- Process Execution Insights: runs and statistics for all processes, with run details
- Process Cron Audit Report: changes to process schedules
- Insights: how insight reports work