Timeseries Profile
Before you use a timeseries in a model or a report, you want to know what it looks like. Its usual level, its range and its biggest jumps all matter, and so do any holes in it. Timeseries Profile reads the values of one timeseries over a period and answers questions like:
- What are the usual level and spread of this price, and what are its extremes?
- How did the average change from month to month, and from year to year?
- When were the biggest daily rises and falls?
- Are there gaps in the history, longer than the usual step between values?
At Northgate Energy, Priya Shah opens it on the TTF day ahead index NGE.SPOT.TTF:INDEX before she adds the index to a new risk model.
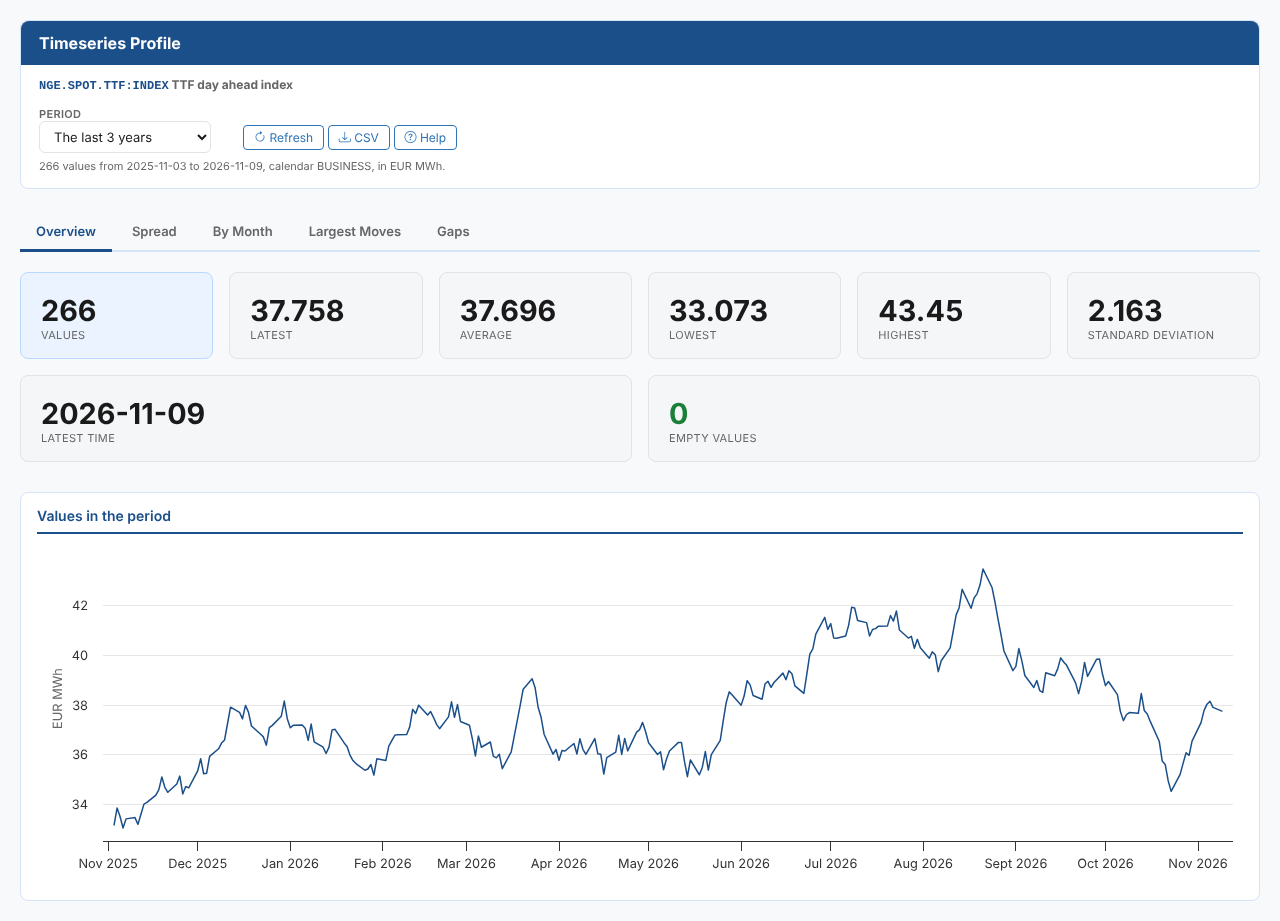
Opening the report
The report works on one item. Open it from the Insights tab of a timeseries in the Data Explorer, or from the item's insights on the Data screen. It ships with the Data Explorer extension and is registered as Timeseries Profile (odsl.data_explorer.tsprofile) in the Data Insights category. It is hidden from the Reports list.
It works on any timeseries: plain, smart, event, metric and composed timeseries. It also works on a curve's tenor, such as NGE.GAS.TTF:FORWARD:M01. On a curve, or any other item, it explains that it profiles a timeseries and draws nothing.
| Control | What it does |
|---|---|
| Period | The last 100 values, The last 1,000 values, The last year, 3 years (the default), 5 years, 10 years or Everything |
| Refresh | Reads the values again |
| CSV | Downloads the values in the period: time and value |
| Help | Opens this page |
The line under the controls says how many values were read, from when to when, the calendar, and the currency and units.
Key ideas
| Idea | What it means |
|---|---|
| Value | One time and value of the timeseries in the period |
| Empty value | A time with no value (null). Empty values are left out of every figure |
| Move | The change from one value to the next |
| Usual step | The median time between two values: a day for a daily series, an hour for an hourly one |
| Gap | A time between two values longer than the usual step |
The tabs
Overview
| Card | What it shows |
|---|---|
| Values | How many values were read |
| Latest | The last value (hover to see its time) |
| Average, Lowest, Highest | Over the period |
| Standard deviation | How far the values usually are from the average |
| Latest time | The time of the last value |
| Empty values | Times with no value: green when there are none |
Below the cards, a line chart shows the values over the period.
Spread
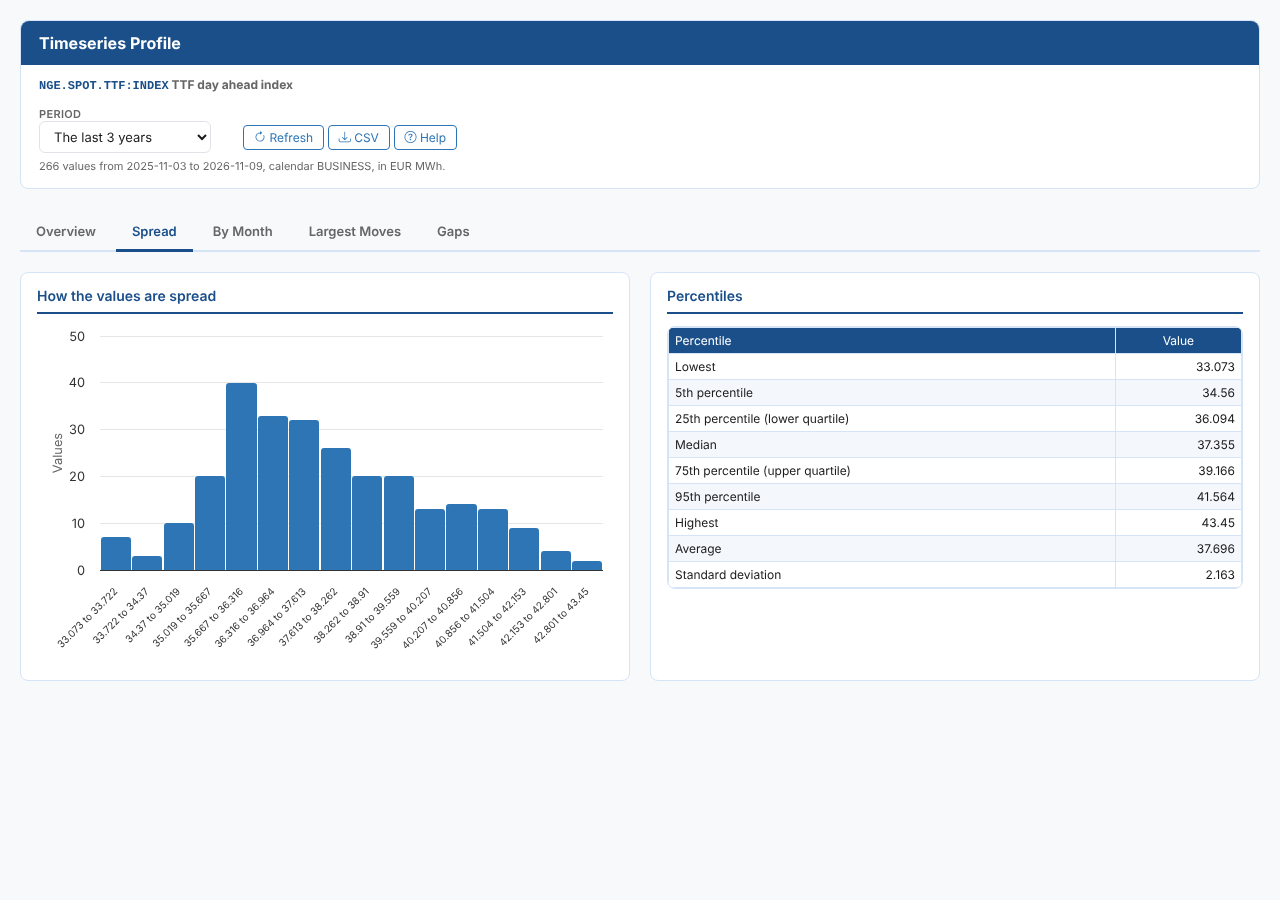
A histogram shows how many values fall in each band, from the lowest to the highest. Next to it, a table gives the lowest value, the 5th, 25th, 50th (median), 75th and 95th percentiles, the highest value, the average and the standard deviation.
By Month
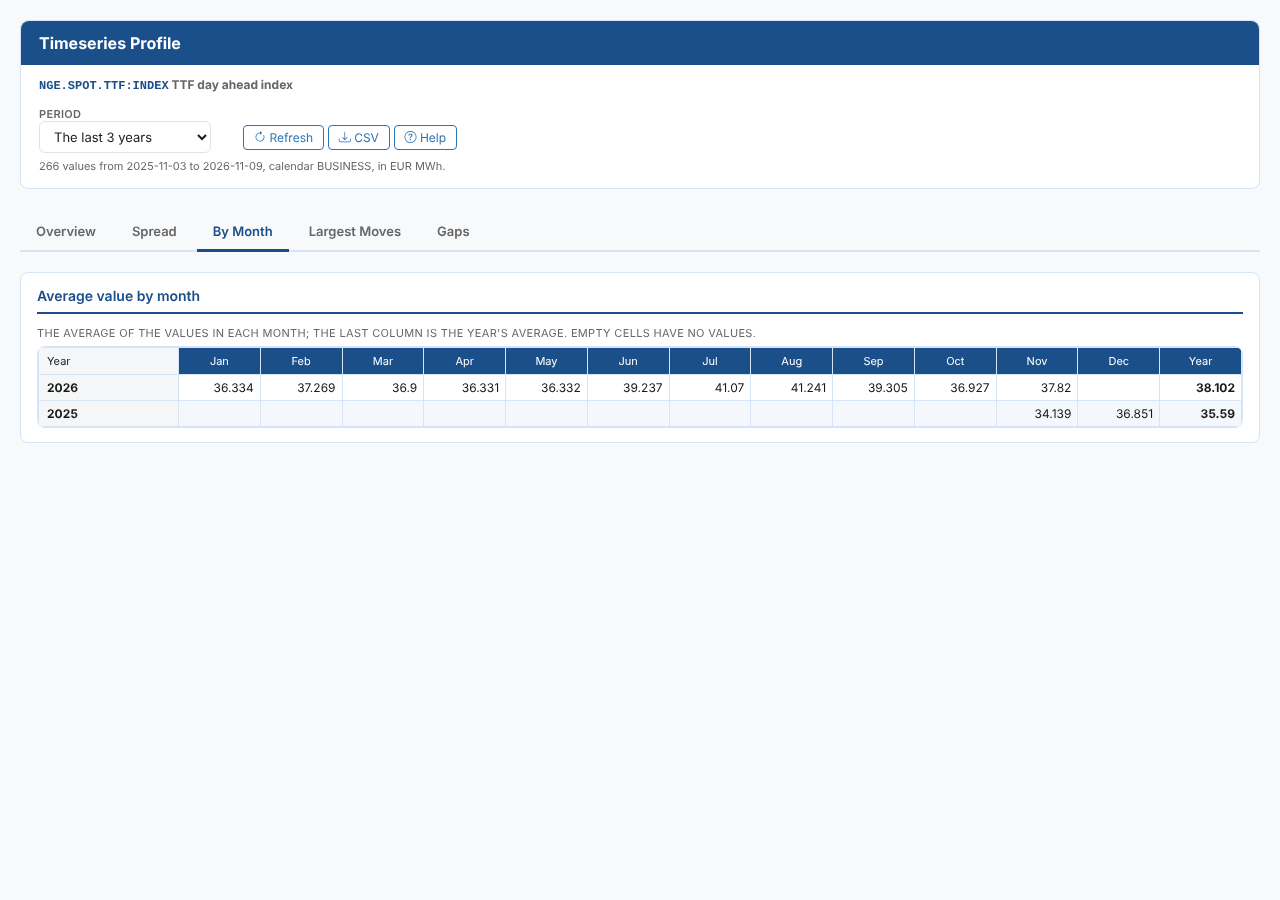
A table has a row per year, newest first, and a column per month. Each cell is the average of the values in that month. The last column is the average for the year. A month with no values is empty.
Largest Moves
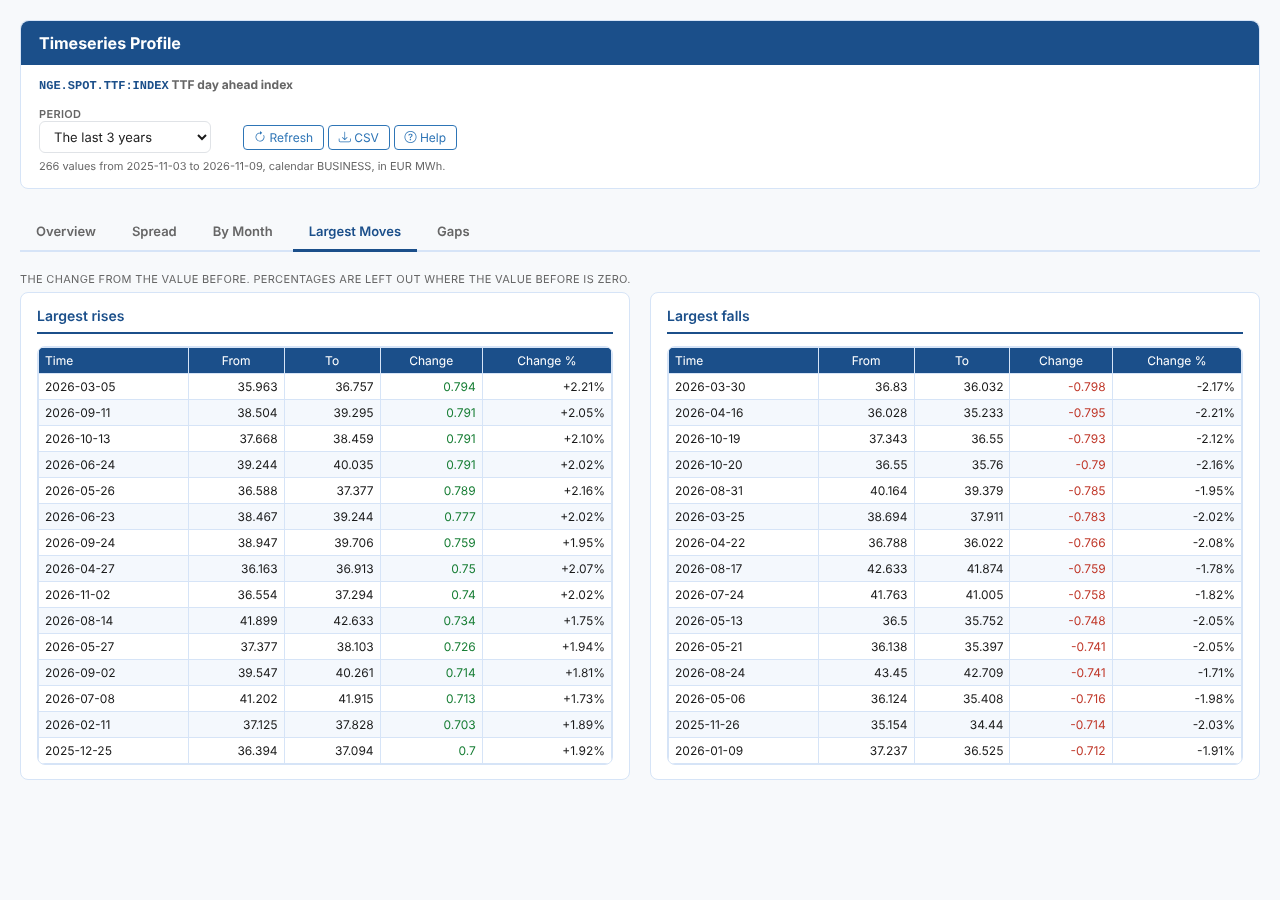
Two tables list the 15 largest rises and the 15 largest falls from one value to the next, with columns Time, From, To, Change and Change %. The percentage is left out when the value before is zero.
Gaps
The note gives the usual step between values. The table lists up to 15 of the longest gaps that are longer than that step: the time of the value before the gap, the time of the next value, the length of the gap, and how many usual steps it covers.
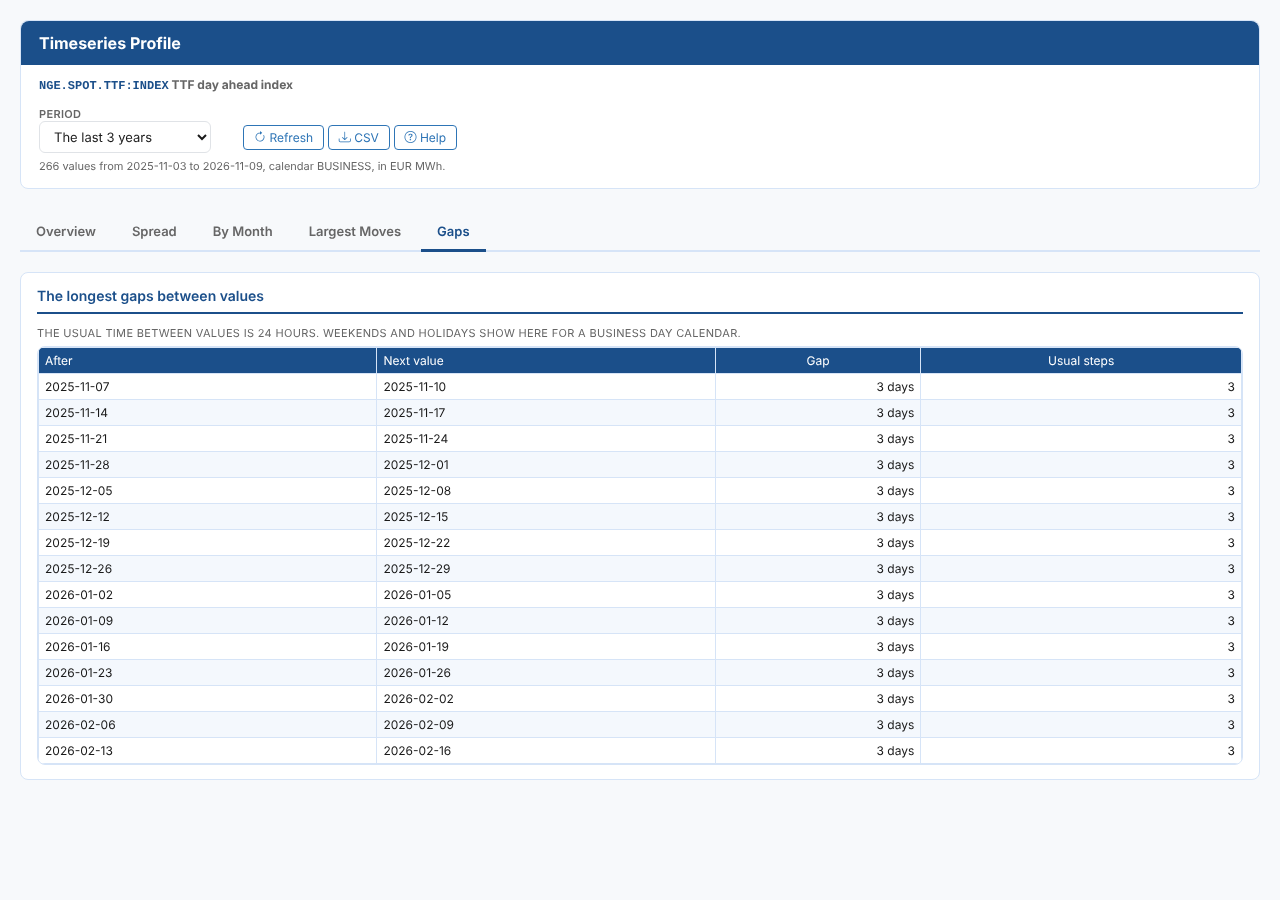
For a business day series, weekends are three day gaps and holidays are four day gaps, so they show here. A gap of a week or more usually means missing data.
Where the data comes from
The values are read once from the data service, as GET data/v1/{source}/ID?_range=.... The period's range is last(100), last(1000) or from(date). All the figures are worked out in your browser from those values. Times are shown in UTC.
Troubleshooting
| What you see | Why, and what to do |
|---|---|
| This report profiles a timeseries | The item is a curve or another kind of data. For a curve, use Curve Ondate History, or open one of its tenors |
| There are no values in this period | Choose a longer period, or Everything |
| The values could not be read | The message from the platform follows. Check that you can read the item |
Related
- Curve Ondate History
- Seasonality Chart
- Data Explorer: Insights
- Insights: how insight reports work