Dataset Dependency Report
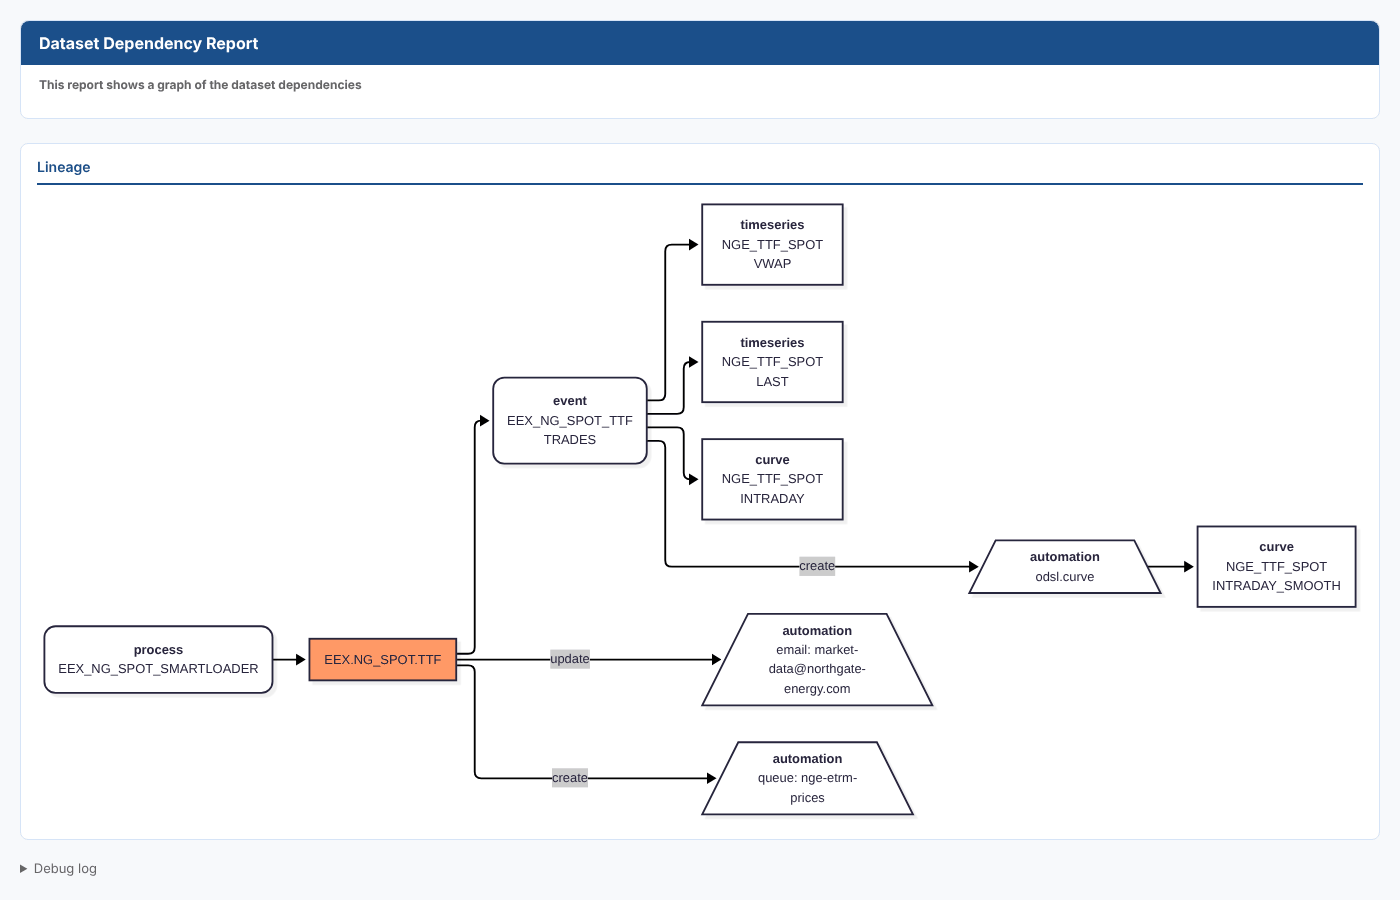
When a dataset is late or wrong, the damage spreads: the events it loads feed curves and timeseries, and automations send it on to other systems and people. The Dataset Dependency Report draws all of that as one diagram and answers questions like:
- Which process delivered this dataset on this date?
- Which event lists, event curves and event timeseries depend on it?
- Which automations fire when it is updated, and where do they send the data?
- Who needs to know if this dataset is late?
Throughout this page we follow Northgate Energy, a fictional gas and power trader that loads the EEX TTF spot dataset EEX.NG_SPOT.TTF with the process EEX_NG_SPOT_SMARTLOADER.
Opening the report
Select a dataset on the Dataset Monitoring screen and choose Dataset Dependency Report from its insights (category Dataset Monitoring Insights). It is not listed in the Reports menu.
| Registration | Value |
|---|---|
| Report id | #DM_GRAPH |
| Category | Dataset Monitoring Insights |
| Template | #insight-dm-graph |
| Inputs | The selected dataset (DSID report property) and the delivery date you are looking at (ONDATE) |
The report has no controls: it builds the diagram as soon as it opens. Debug log, at the bottom of the page, lists each step and how many items it found.
Reading the diagram
The diagram reads from left to right. The dataset itself is the orange box.
| Shape | Label | What it is |
|---|---|---|
| Rounded box, left of the dataset | process | The process that delivered the dataset on the date, from the dataset's delivery record |
| Orange box | The dataset id | The dataset |
| Rounded box | event | An event list the dataset loads events into, shown as object and event list on two lines |
| Box | timeseries or curve | An event timeseries or event curve built on that event list, or a curve built by an automation |
| Slanted box | automation | An automation on the dataset or the event list. It shows where it sends the data: email: and the address, queue: and the queue, or the automation target. |
| Label on an arrow | create, update and so on | The action that fires the automation |
At Northgate, the diagram shows EEX_NG_SPOT_SMARTLOADER delivering the TTF spot dataset, the trades event list EEX_NG_SPOT_TTF:TRADES with two event timeseries and an intraday curve built on it, an automation on the event list that builds a smoothed curve, and two automations on the dataset: an email to the market data team and a message to the ETRM queue.
How the diagram is built
- The report reads the dataset, then its delivery record for the date.
- From the delivery record it adds the process that delivered the dataset, then every event list the dataset loads into, with the automations on each event list and the event curves and timeseries built on it.
- It adds the automations on the dataset itself.
Events, curves, timeseries and their automations are only added when the dataset has a delivery record for the date. Without one, the diagram is not drawn at the moment and the page stays on Building lineage diagram. Open the report from a date the dataset was delivered.
Troubleshooting
| Problem | What to do |
|---|---|
| The page stays on Building lineage diagram | The dataset has no delivery record for the date. Open the report from a delivered date, and check Debug log. |
| A curve you expected is missing | Only event curves and event timeseries built on the dataset's event lists, and curves built by automations on them, are drawn. Smart curves that read those curves are not. |
Related
- Insights: how insight reports work
- Data Usage: the same event lists, curves and timeseries as a table
- Curve Dependency Report: the same kind of diagram for a curve