Integration Problem Items
A curve that fails one day is a nuisance; a curve that fails every day is a problem to fix at its source. Integration Problem Items collects the problems of every daily report in a period and ranks the items by how often they had one. It answers questions like:
- Which curves fail most often, and are they still failing?
- What are the reasons, and how many items does each one affect?
- What exactly went wrong on each day?
At Northgate Energy, the report shows that the GB power curve has failed every day since it was added to the curves group, always with No molecule identity set, and that the German power curve fails in Northgate Risk for the same kind of reason. Both are fixed by giving the items their codes (see Integration Codes by System).
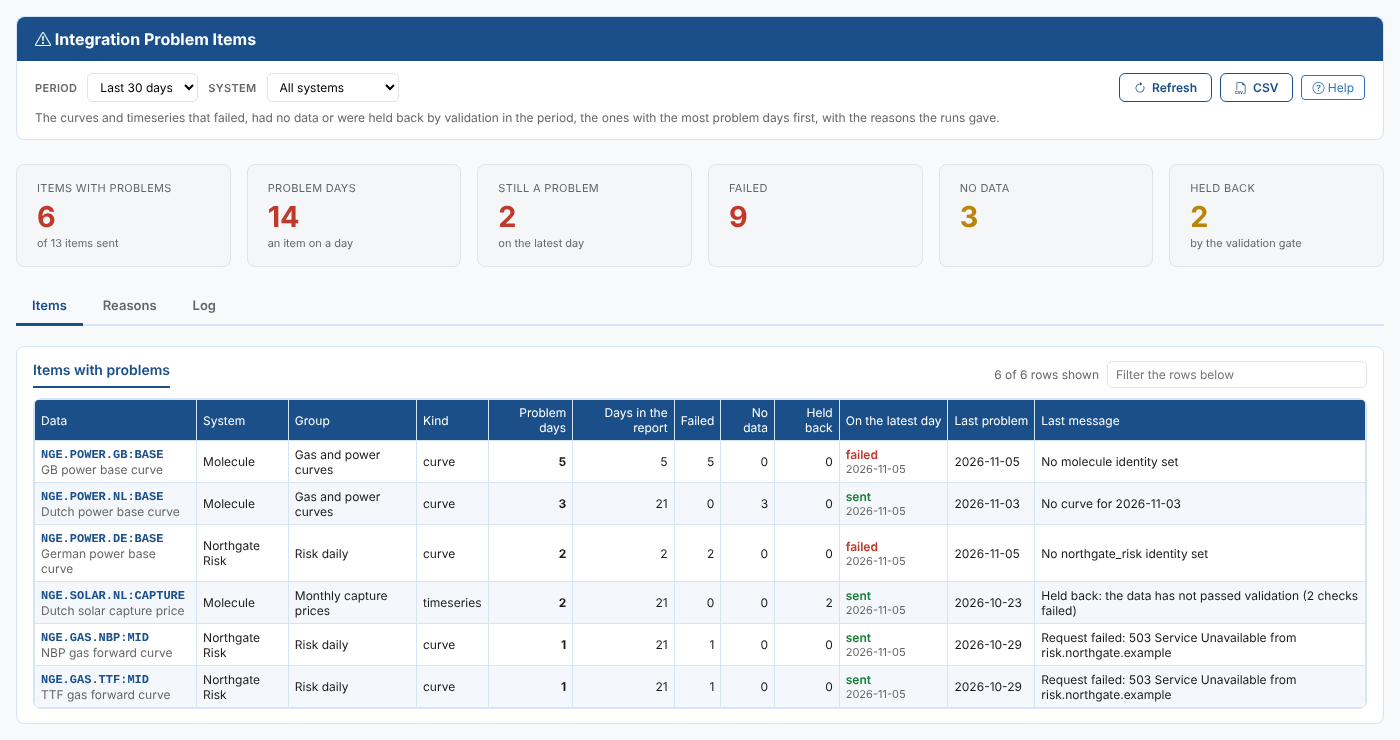
Opening the report
The report is on the Insights tab of Operations, Integrations (the Integration extension), as Integration Problem Items (odsl.integration.problems).
It opens with the last 30 days of every system that has groups.
| Control | What it does |
|---|---|
| Period | The ondates to show: the last 7, 30 or 90 days, this month, last month, or Custom (at most 400 days) |
| System | All systems, or one |
| Refresh, CSV, Help | Read the reports again, download the table of the tab, open this page |
| Filter the rows below | Shows only the rows that have every word you type |
Key ideas
| Idea | What it means |
|---|---|
| Problem | An item on a day that failed (the run could not send it), had no data for the ondate, or was held back by the validation gate |
| Problem day | One item with a problem on one day |
| Not problems | Items waiting for the system to confirm, items skipped, and items not available that day |
An item sent by two groups is counted for each group.
Summary cards
| Card | What it shows |
|---|---|
| Items with problems | Items with at least one problem day, of all the items in the reports |
| Problem days | All the problem days |
| Still a problem | Items whose latest day in the period had a problem |
| Failed, No data, Held back | The problem days of each kind |
The tabs
Items
A row per item with problems, the most problem days first: its system, group and kind, its problem days against the days it was in the report, the days of each kind, its status on the latest day, the last day it had a problem and the message of that day.
Reasons
The messages of the problems, grouped: dates and numbers in a message are shown as [date] and [n], so No curve for 2026-11-03 and No curve for 2026-10-28 are one reason. For each reason: its status, the problem days, the items and systems it affects, the first and last day it was seen, and the latest message in full.
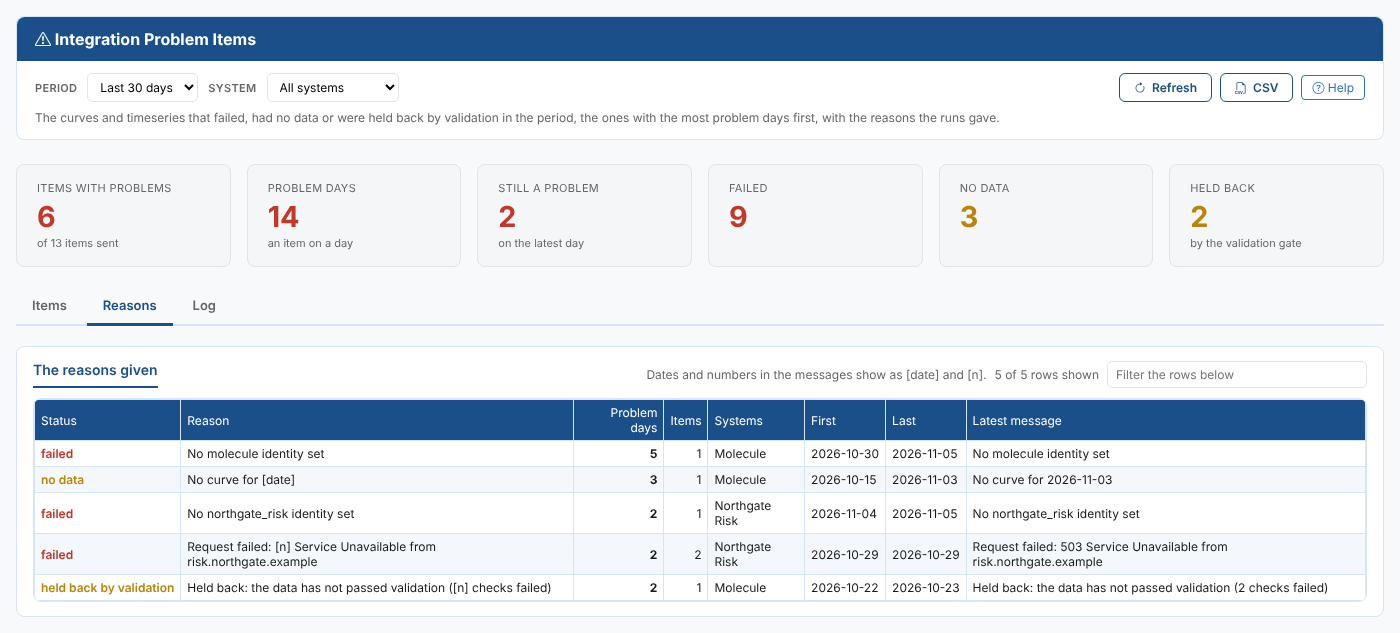
Log
Every problem day, newest first: the ondate, system, group, item, kind, status, validation status and message.
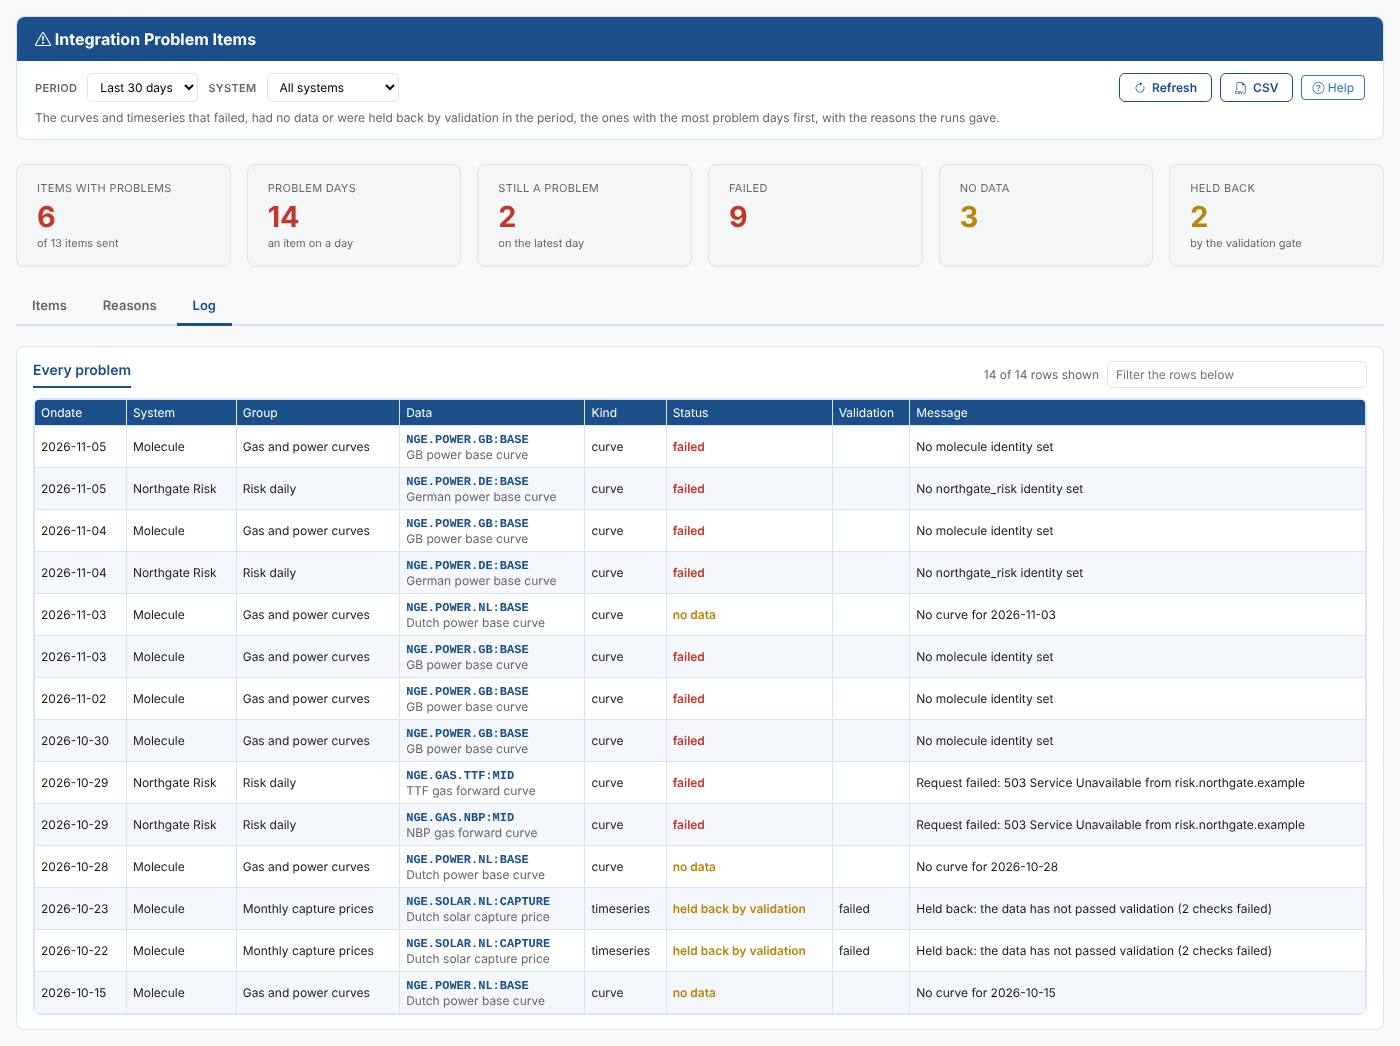
Fixing the problems
| Reason | What to do |
|---|---|
No ... identity set | Give the item the system's code on the group's Items tab |
No curve for ..., no data | The data did not arrive for the ondate: check the dataset or curve build. A curve that is built late can use the curve mode The curve for the ondate, or the latest one before it in the group settings |
| Held back | The data did not pass validation: see the item on the Validation screen, or override it |
Request failed: ... | The system did not accept the data or could not be reached: see the system's plug-in page for its messages |
Where the data comes from
The stored daily reports INTEGRATION_<KEY>:<ondate> of the reports your groups send to, one for each day of the period.