Usage
Before you change or retire a curve, a timeseries or a master data record, you want to know who relies on it. The Usage report lists every recorded use of the selected item and answers questions like:
- Is anyone still reading this item, or can it be retired?
- Who uses it, and do they use it from the portal, Excel, Python or the REST API?
- Is it read in production only, or also in a test environment?
- How long do requests for it take, and how much data do they return?
At Northgate Energy, Priya Shah checks who reads the master data record NGE_PRODUCT:TTF_M before she changes its properties.
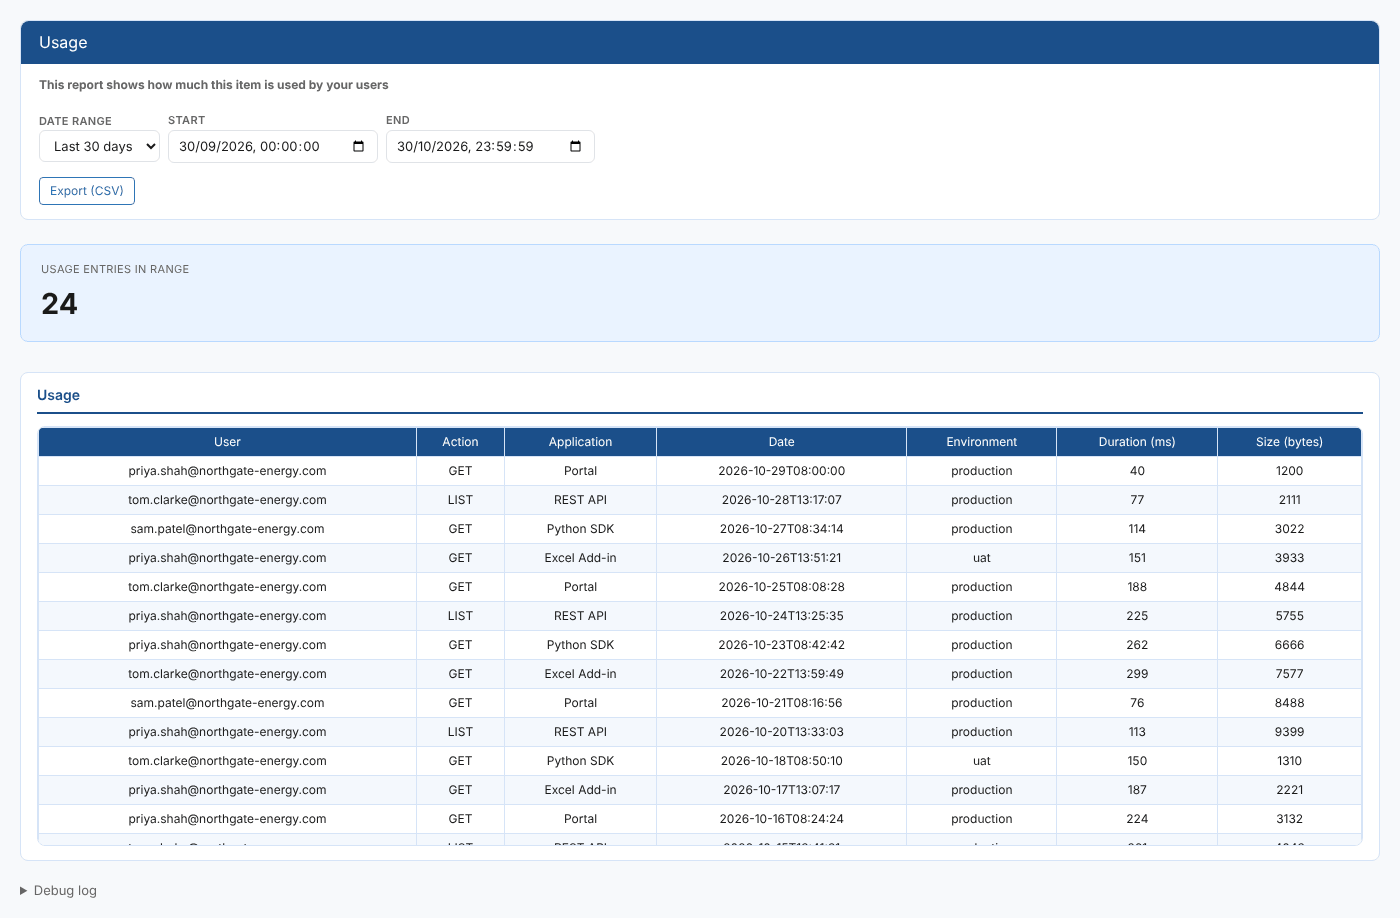
Opening the report
The Usage report is an item insight: select an item first, then open Usage from its insights. It is registered as #INSIGHT_ITEM_USAGE in the category *Item Insights*, so it is offered for selected items rather than in the Reports menu.
The portal passes the selected item to the report: its service (SERVICE) and its id (ID), or the dataset id (DSID) for a dataset. The report then lists the usage records for that service and id.
It loads as soon as it opens, for the first date range in the list (Today).
| Control | What it does |
|---|---|
| Date range | Today, Yesterday, Last 7 days, Last 30 days, Last 60 days, This month, Last month or All (no date limit). Choosing one fills in Start and End and reloads. |
| Start, End | Change either date and time to set your own range. The report reloads at once. |
| Export (CSV) | Downloads the table as shown, as usage.csv |
| Debug log | At the bottom of the page: the date range used and how many entries came back |
The presets work out dates in UTC, so late in the evening or early in the morning Today may not be your local calendar day. Set Start and End yourself when the exact boundary matters.
The report
The Usage entries in range card counts the entries listed. The Usage table has one row per recorded use:
| Column | What it shows |
|---|---|
| User | Who made the request |
| Action | The kind of request, such as GET (read one item) or LIST |
| Application | Where the request came from, such as the portal, the Excel add-in, the Python SDK or the REST API |
| Date | When the request was made |
| Environment | The data environment the request was made in, such as production or uat |
| Duration (ms) | How long the platform took to answer, in milliseconds |
| Size (bytes) | The size of the response |
The rows come back in the order the platform stores them; the report does not sort them. At most 10,000 entries are listed for one range. If nothing falls in the range, the report says No usage entries fall in the selected range.
Where the data comes from
Every request to the platform is recorded as a usage metric (the metric service), with the service and key of the item it was for. The report reads the metrics whose service and key match the selected item and whose timestamp is in the range.
Troubleshooting
| Problem | What to do |
|---|---|
| The table is empty | Choose a longer range, such as Last 60 days or All. |
| A user you expect is missing | Only requests for this exact item are counted. Reading a list that includes the item, or a curve built from it, is recorded against the list or the other item. |
Related
- Insights: how insight reports work
- Tracer: usage, audit and automation activity for an item in one log
- Item Audit Report: changes made to the item
- Data Environment Summary