Process Execution Insights
Loaders, curve builds and reports run as processes all day. When something goes wrong, the operations team needs to know quickly what failed, whether several failures share one cause, and whether anything is stuck or did not run at all. Process Execution Insights brings all of this into one report and answers questions like:
- How many runs failed in the last 24 hours, and which processes are failing right now?
- Do the failures share an error message, such as a source website or a password outage?
- Which processes are slower than usual today?
- Is anything stuck in a running state?
- Which scheduled processes did not run at all?
- What exactly happened in one run: its phases, log lines, failure details and the automations it triggered?
At Northgate Energy, Sam Patel opens it first thing every morning to check the overnight loaders, and again after the evening curve build.
Opening the report
The report is in the Reports menu, in the Process Insights category, as Process Execution Insights (report id #PROCESSI_EXECUTIONS). It is a public report, so it is available in every tenant.
Opened from the menu, it shows every process for the Last 24 hours. When it is opened for one process (with the process id passed to the report), the Process filter is set to that process and the range to the Last 7 days; you can still switch to another process or to All processes.
All times are UTC.
| Control | What it does |
|---|---|
| Date range | Last hour, Last 6 hours, Last 24 hours, Today, Yesterday, Last 7 days, Last 30 days, This month or Last month. Fills in Start and End and reloads every tab. |
| Start, End | The range of run start times, if you want your own |
| Process | All processes, or one process. The list holds every configured process plus any name that has run in the last 30 days (some system runs, such as alert checks, have runs but no process definition). |
| Trigger | What started the runs, such as Scheduled, Manual, Smart or Reschedule |
| Type | Process, Curve, Report or Alert runs |
| Status (log only) | Narrows the Executions tab to one status. The other tabs always count every status, so success rates stay meaningful. |
| Refresh | Loads everything again |
| Clear filters | Resets Process, Trigger, Type and Status |
| Debug log | At the bottom of the page: the requests made and how many items came back |
Almost every process name in the report is a link. Click it to open the Executions tab filtered to that process.
Key ideas
| Idea | What it means |
|---|---|
| Run (execution) | One run of a process, with a start, an end, a status, what triggered it and its messages |
| Completed run | A run that finished as success, warning or failed |
| Success rate | Successful and warning runs as a share of completed runs |
| Currently failing | A process whose most recent completed run in the range failed |
| Duration | End minus start. It is worked out from the most recent runs in the range (up to 10,000); the report says when the range holds more runs than that. |
The tabs
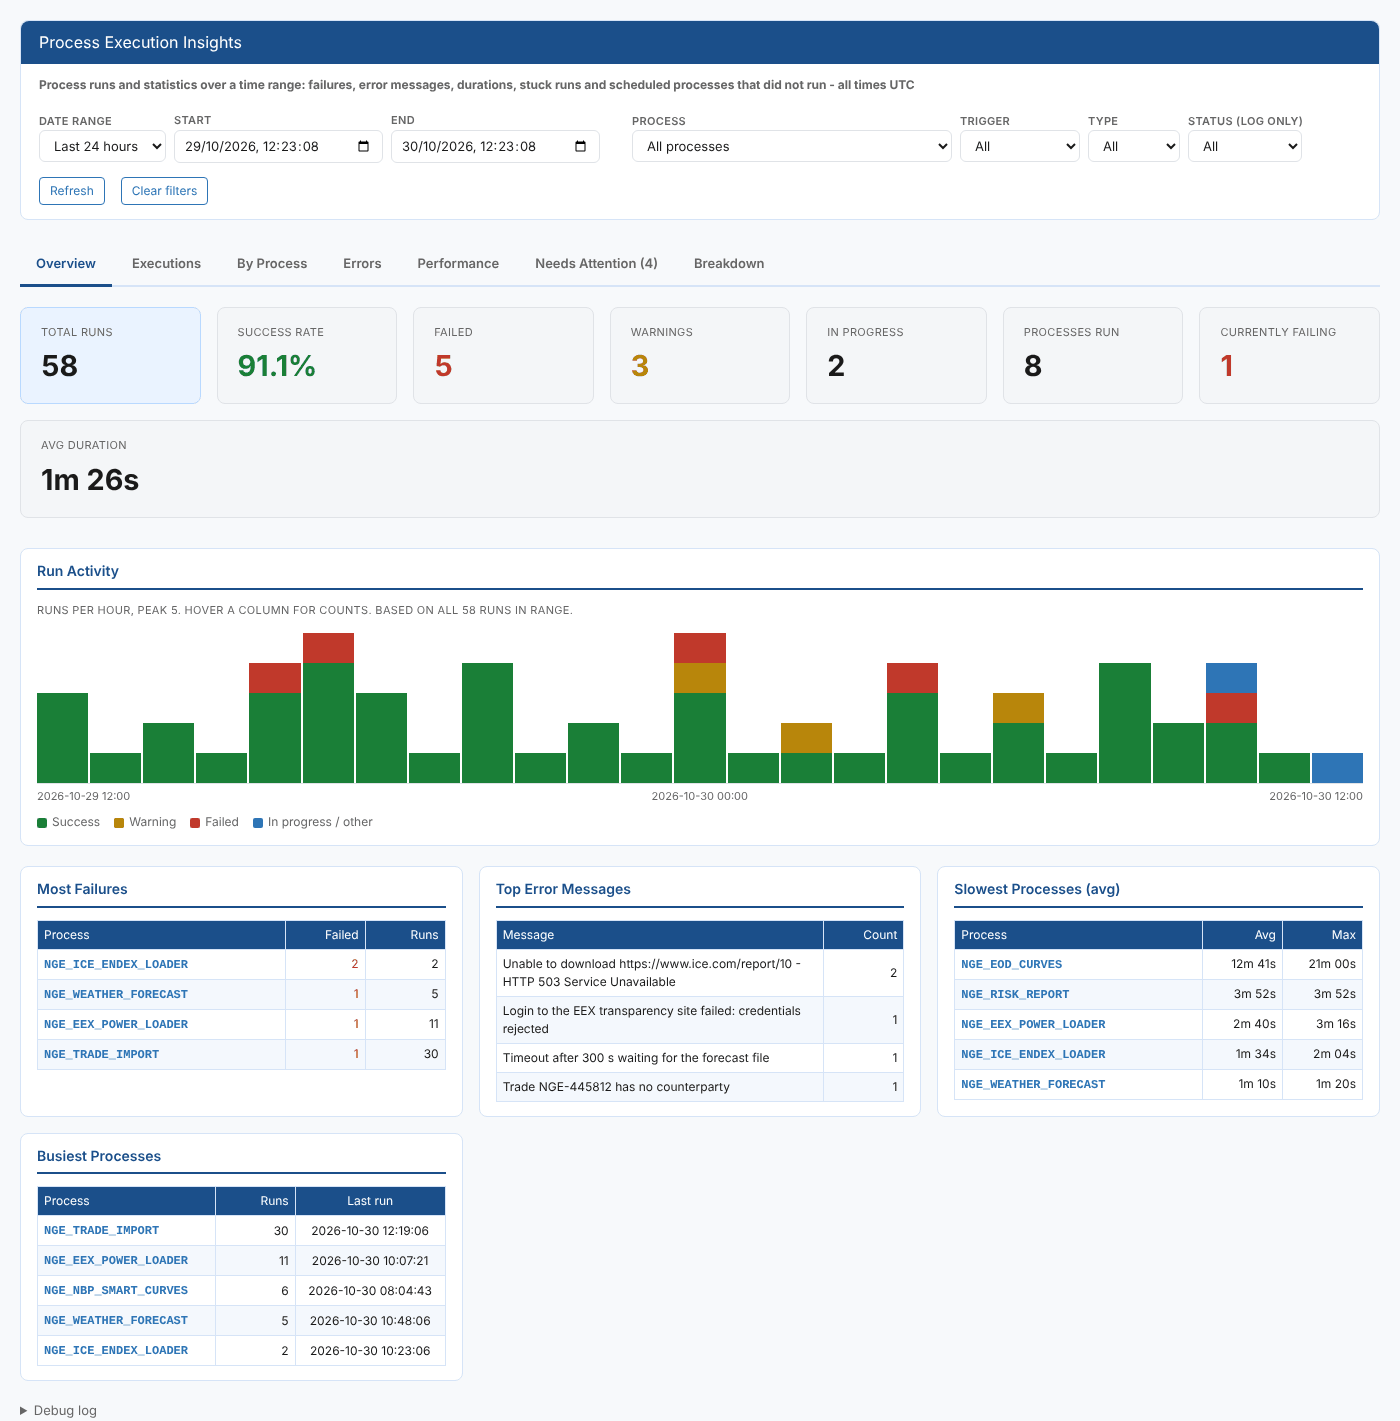
Overview
| Card | What it shows |
|---|---|
| Total runs | Runs started in the range |
| Success rate | Success and warning runs as a share of completed runs |
| Failed, Warnings | Runs that failed, or finished with warnings |
| In progress | Runs with any other status, such as running, triggered or waiting |
| Processes run | Different processes that ran |
| Currently failing | Processes whose latest completed run failed |
| Avg duration | Average duration of completed runs |
Run Activity is a stacked column chart of runs per hour (for ranges up to 3 days) or per day, coloured by success, warning, failed and in progress. Hover over a column for its counts.
Below it, four small tables: Most Failures, Top Error Messages, Slowest Processes (avg) and Busiest Processes, each showing the top 5.
Executions
The run log, newest first, 50 runs to a page. The Executions matching card and the pager are at the top.
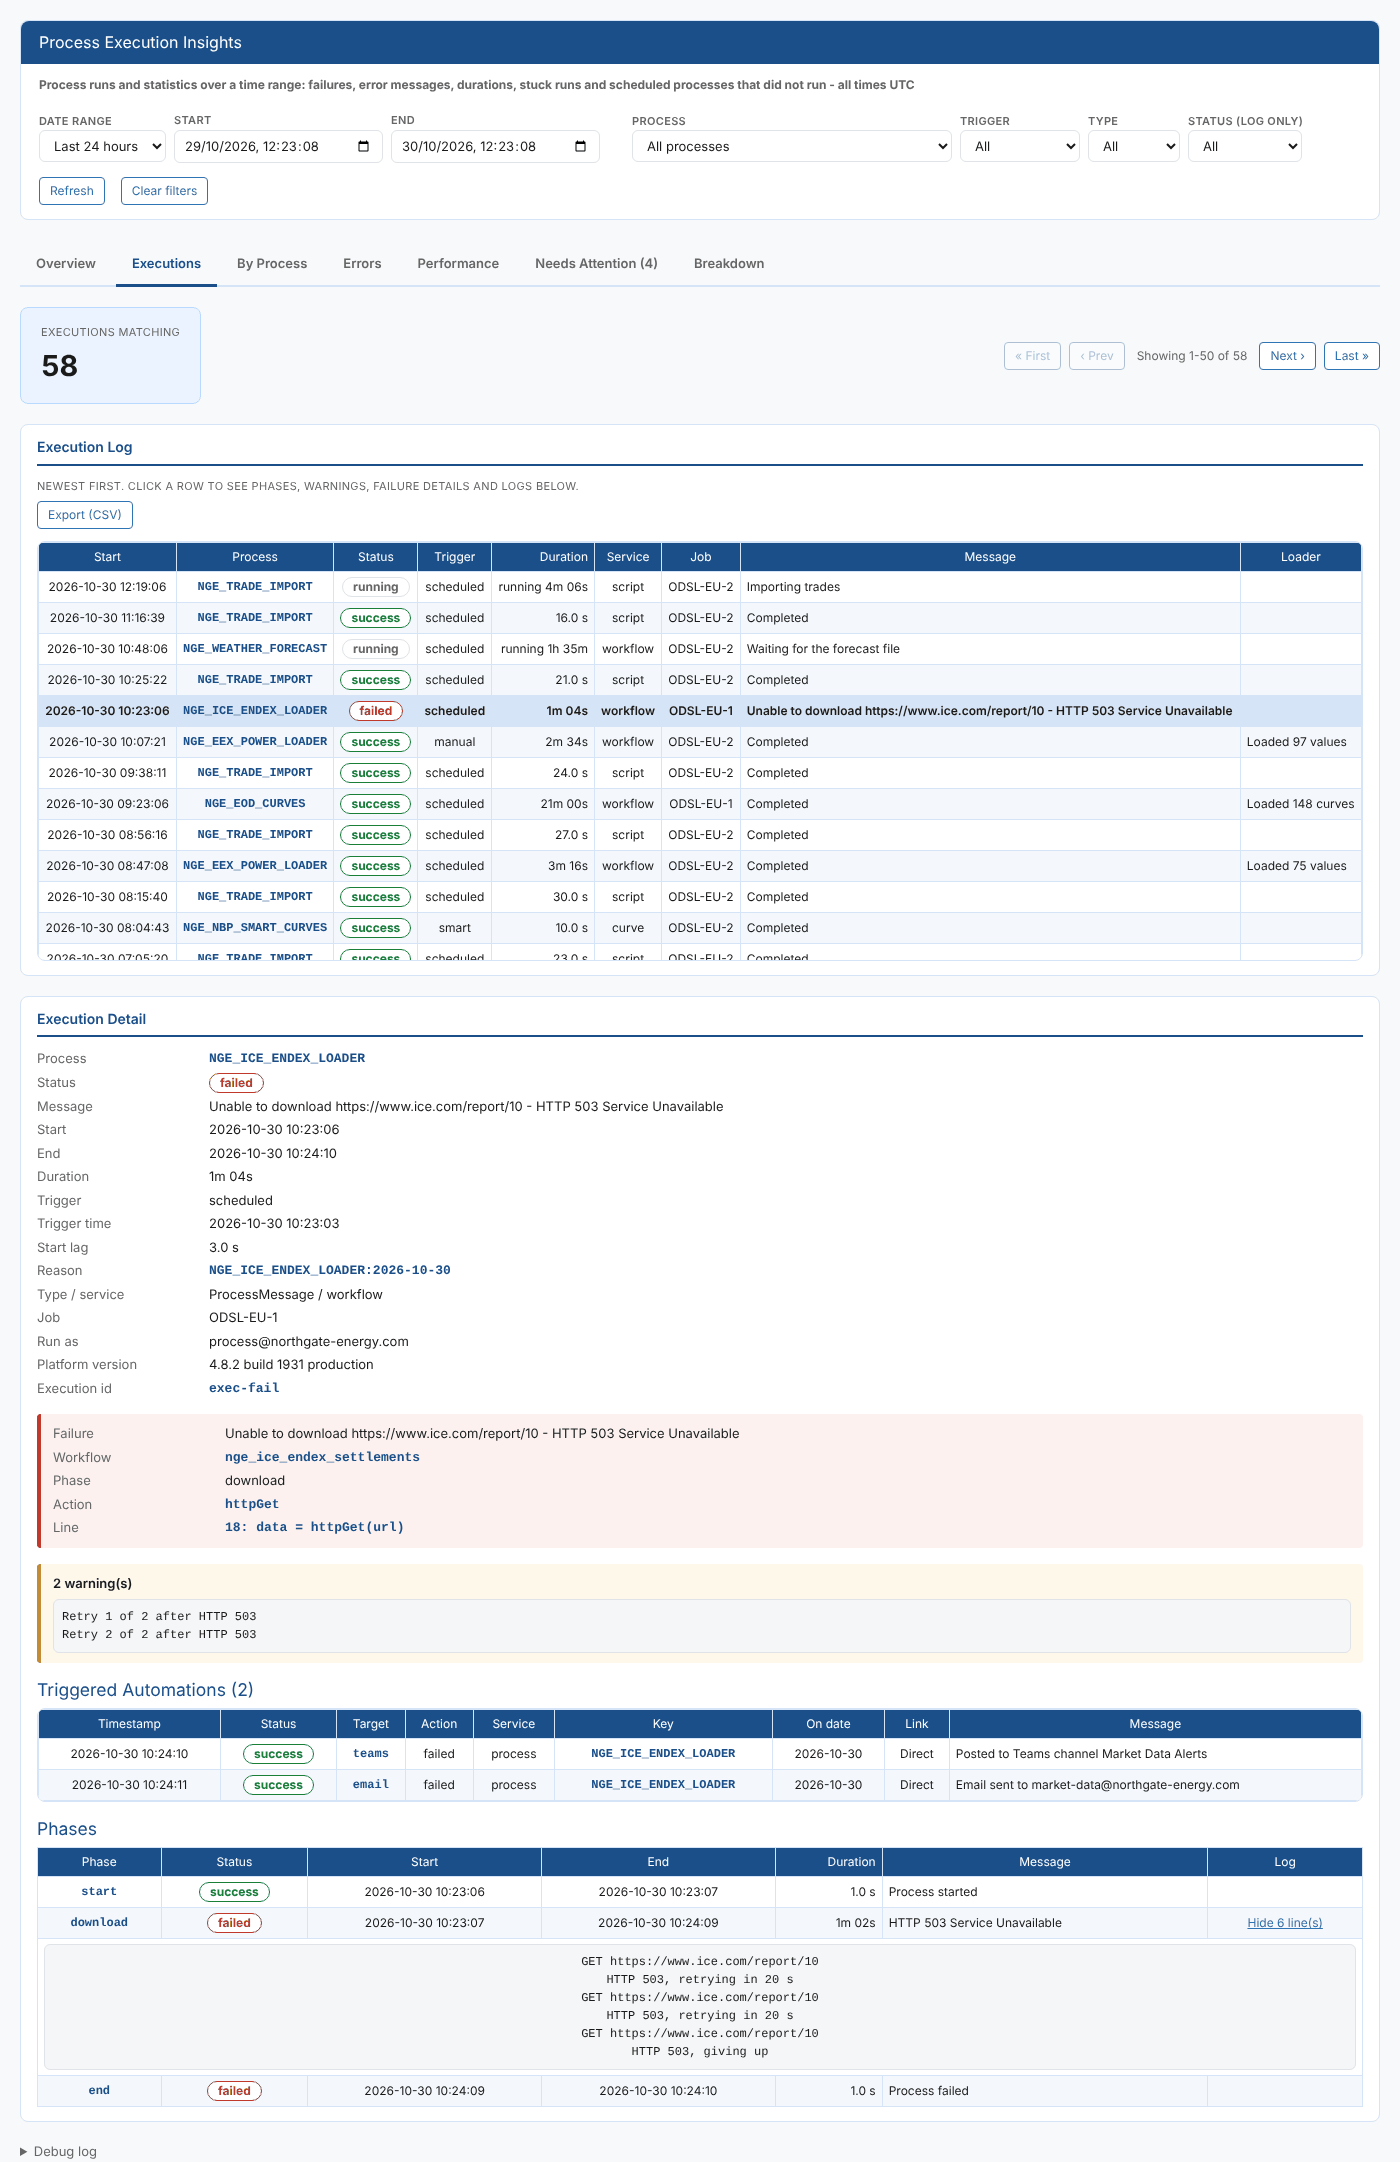
| Column | What it shows |
|---|---|
| Start | When the run started |
| Process | The process name |
| Status | Green for success, red for failed, amber for warning |
| Trigger | What started the run |
| Duration | How long it took, or how long it has been running |
| Service | The kind of process, such as workflow, script, curve or report |
| Job | The runner the process ran on |
| Message, Loader | The run's final message and the loader's summary |
Click a run to see its detail under the table:
| Part | What it shows |
|---|---|
| Summary | Process, status, messages, start, end, duration, trigger and trigger time, the start lag (how long after it was triggered it started), reason, type and service, job, who it ran as, parent run, platform version, tags and the run id |
| Failure box (red) | For a failed run: the failure message, and the workflow, phase, action and script line where it failed |
| Warnings box (amber) | Any warnings the run recorded |
| Data Updated | The data the run saved, by kind, with the first few ids |
| Triggered Automations | The automations this run set off, directly or further down the chain, with their status and message (up to 500) |
| Phases | Each phase with its status, times, duration and message. Select Show n line(s) to read the phase's log. |
Export (CSV) downloads every run that matches the filters, not just the page on screen.
By Process
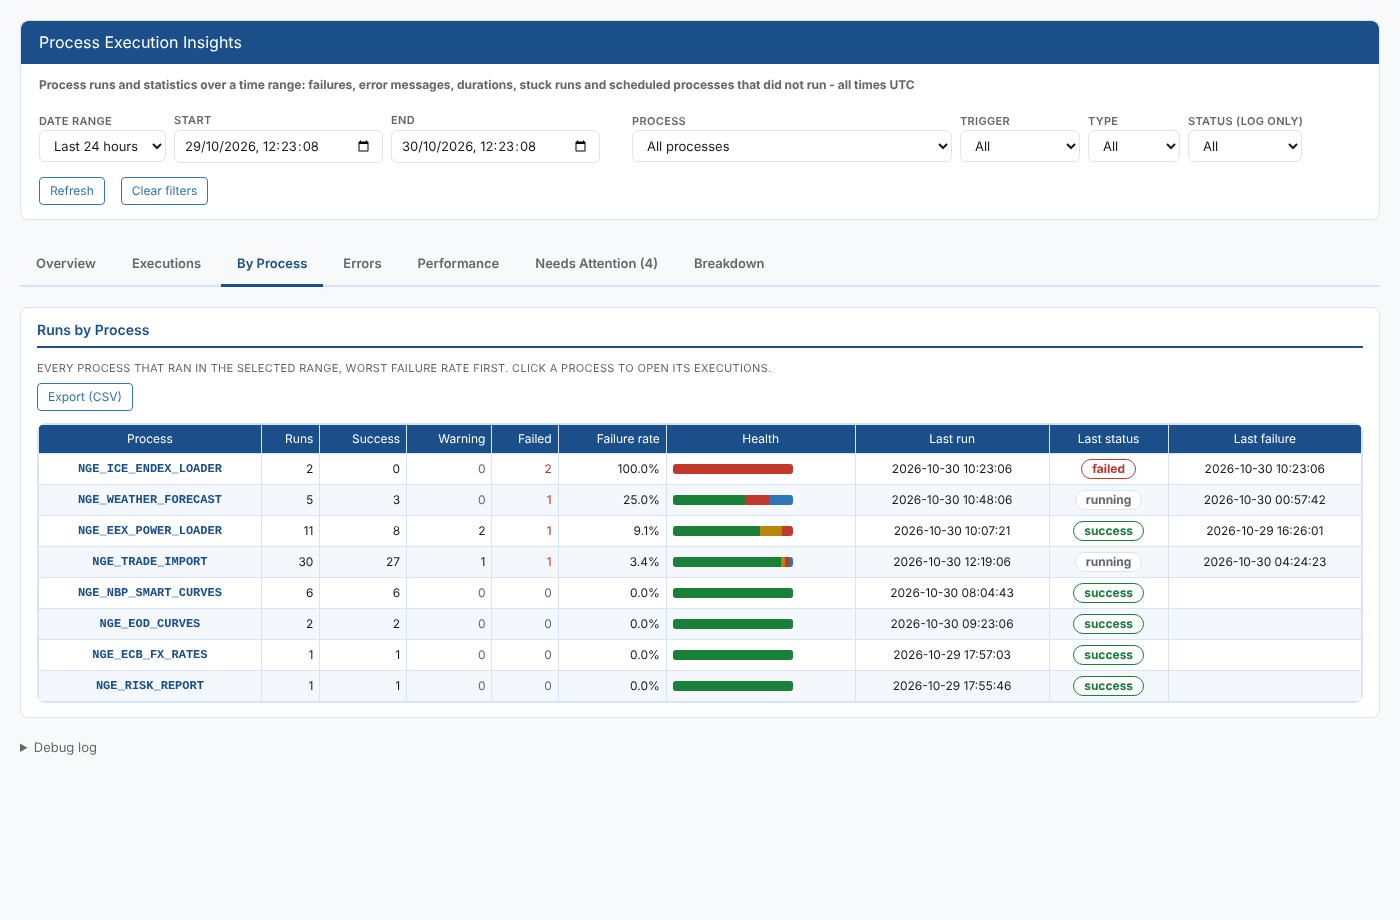
One row per process that ran in the range, with the worst failure rate first: runs, successes, warnings, failures, failure rate, a health bar (green, amber and red in proportion), the last run and its status, and the last failure. Click a row to open its runs on the Executions tab.
Errors
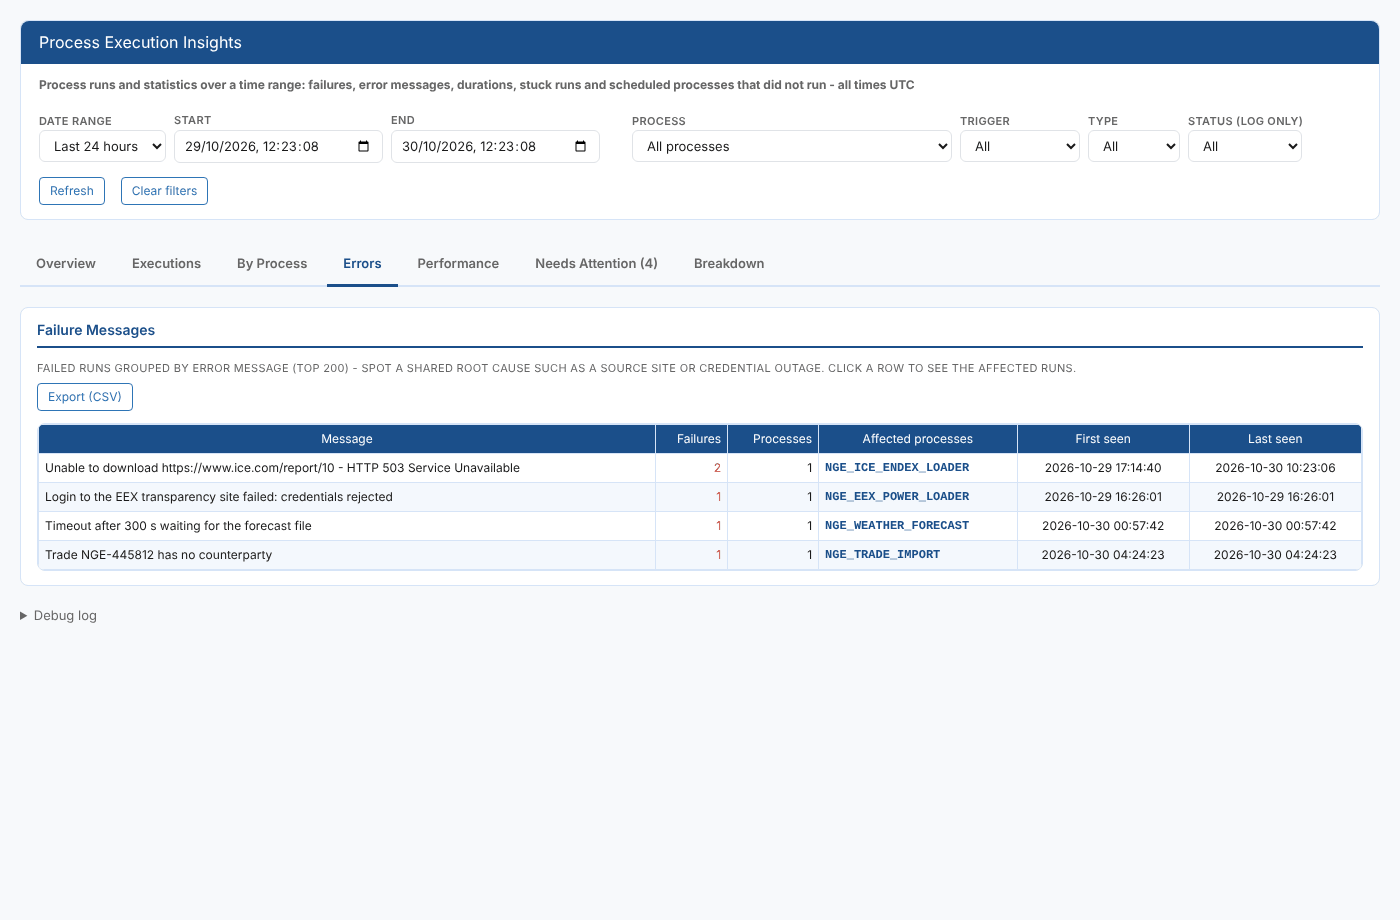
Failed runs grouped by error message (top 200), with how many failures and processes share each message, which processes, and when it was first and last seen. One message shared by several processes usually points to a common cause, such as a source website being down or an expired password. Click a row to see the affected runs on the Executions tab.
Performance
Run Duration by Process shows, for completed runs only: how many, the average, median, 95th percentile and maximum duration, the latest duration and when it ran. A process is flagged Slower than usual when its latest run took more than twice its median and at least a minute longer (it needs at least 3 completed runs). Longest Individual Runs lists the longest runs in the range.
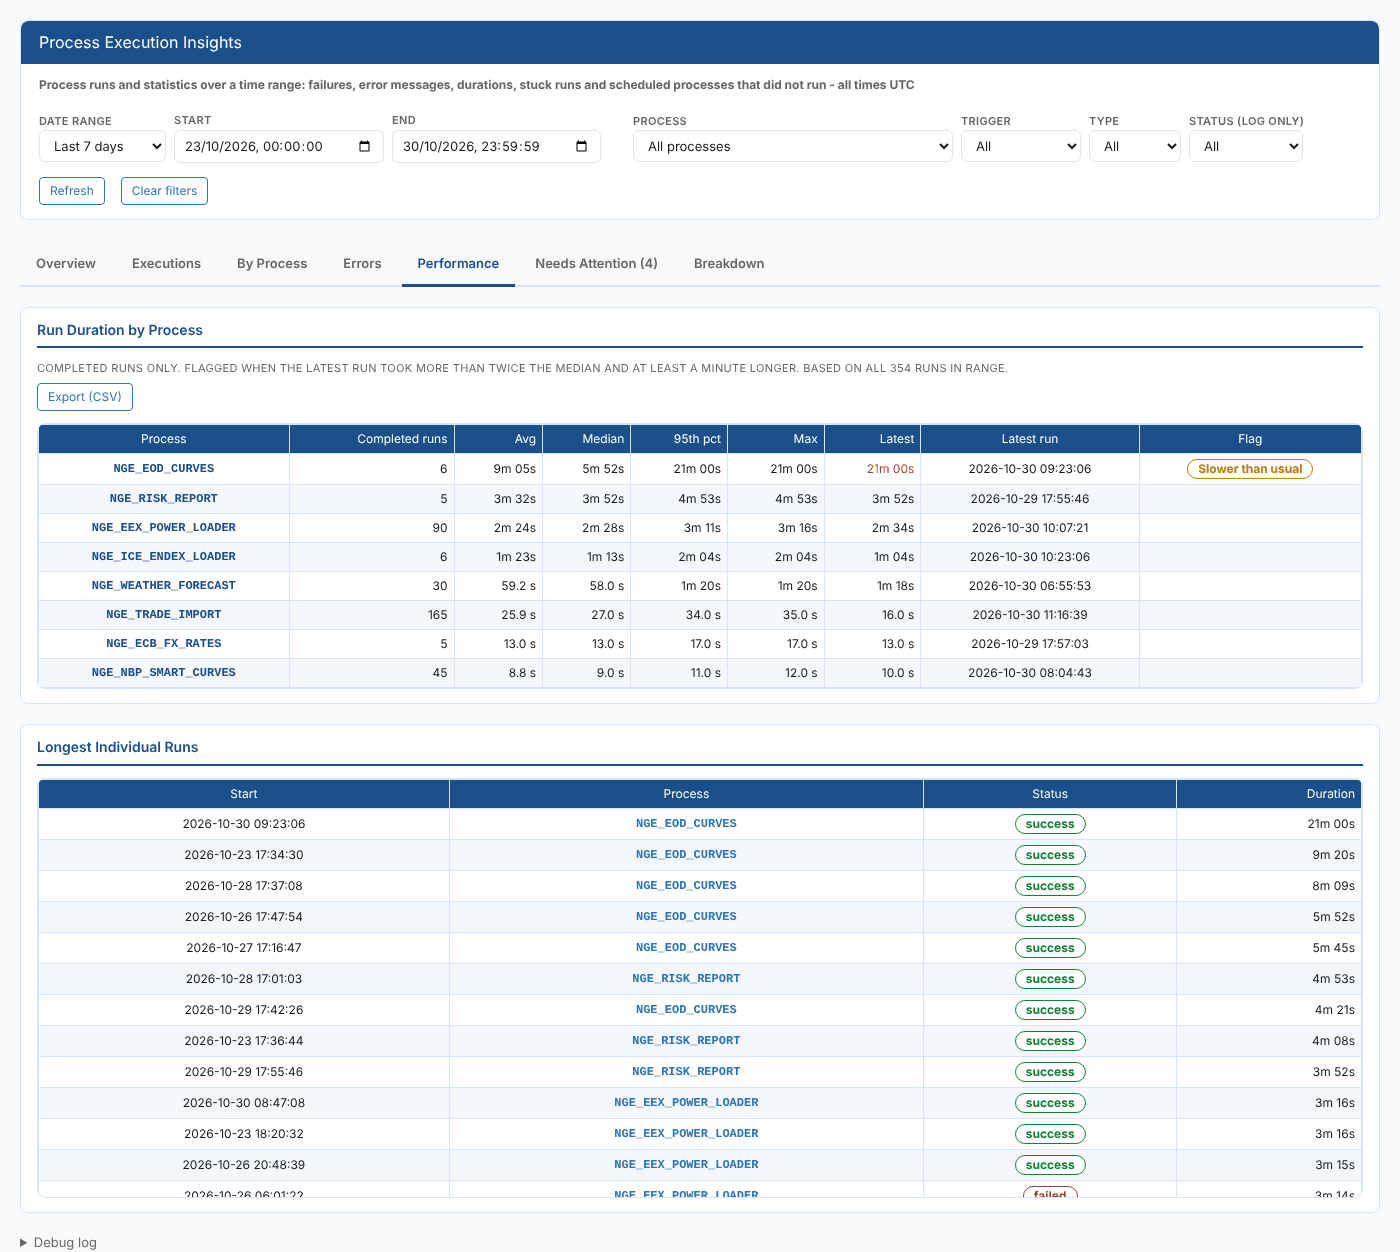
At Northgate, the 7 day view flags NGE_EOD_CURVES: this morning's run took 21 minutes against a usual 6.
Needs Attention
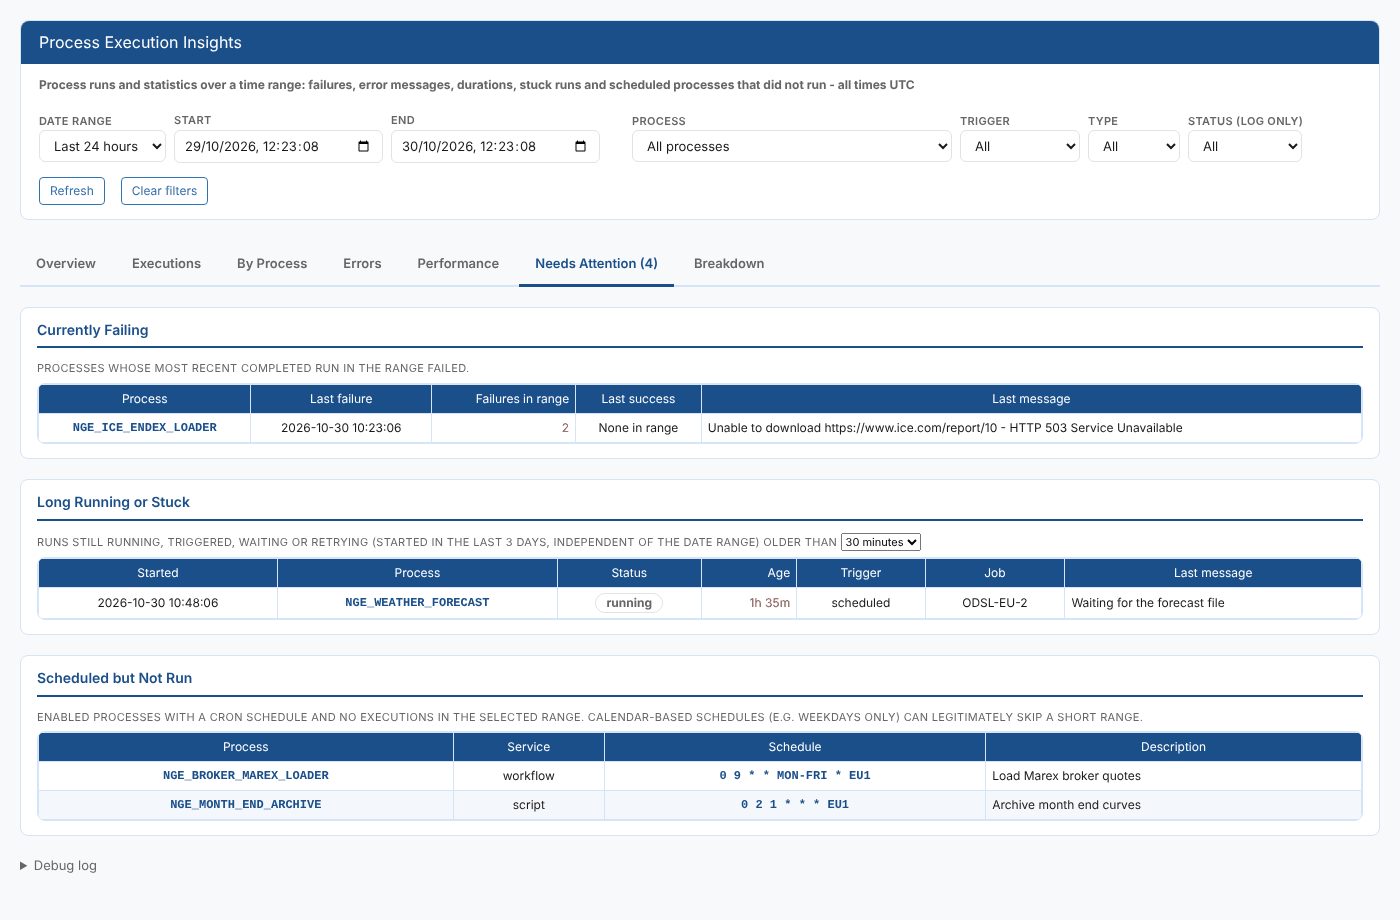
The number on the tab adds up the three lists:
| Section | What it lists |
|---|---|
| Currently Failing | Processes whose latest completed run in the range failed, with the last failure, failures in range, last success and the last message |
| Long Running or Stuck | Runs still running, triggered, waiting or retrying that started in the last 3 days (whatever the date range) and are older than the threshold you choose: 15 minutes, 30 minutes, 1 hour or 4 hours |
| Scheduled but Not Run | Enabled processes with a cron schedule and no runs in the range. A schedule that only runs on some days can skip a short range legitimately. This check needs the Trigger filter on All and the Type filter on All or Process. |
Breakdown
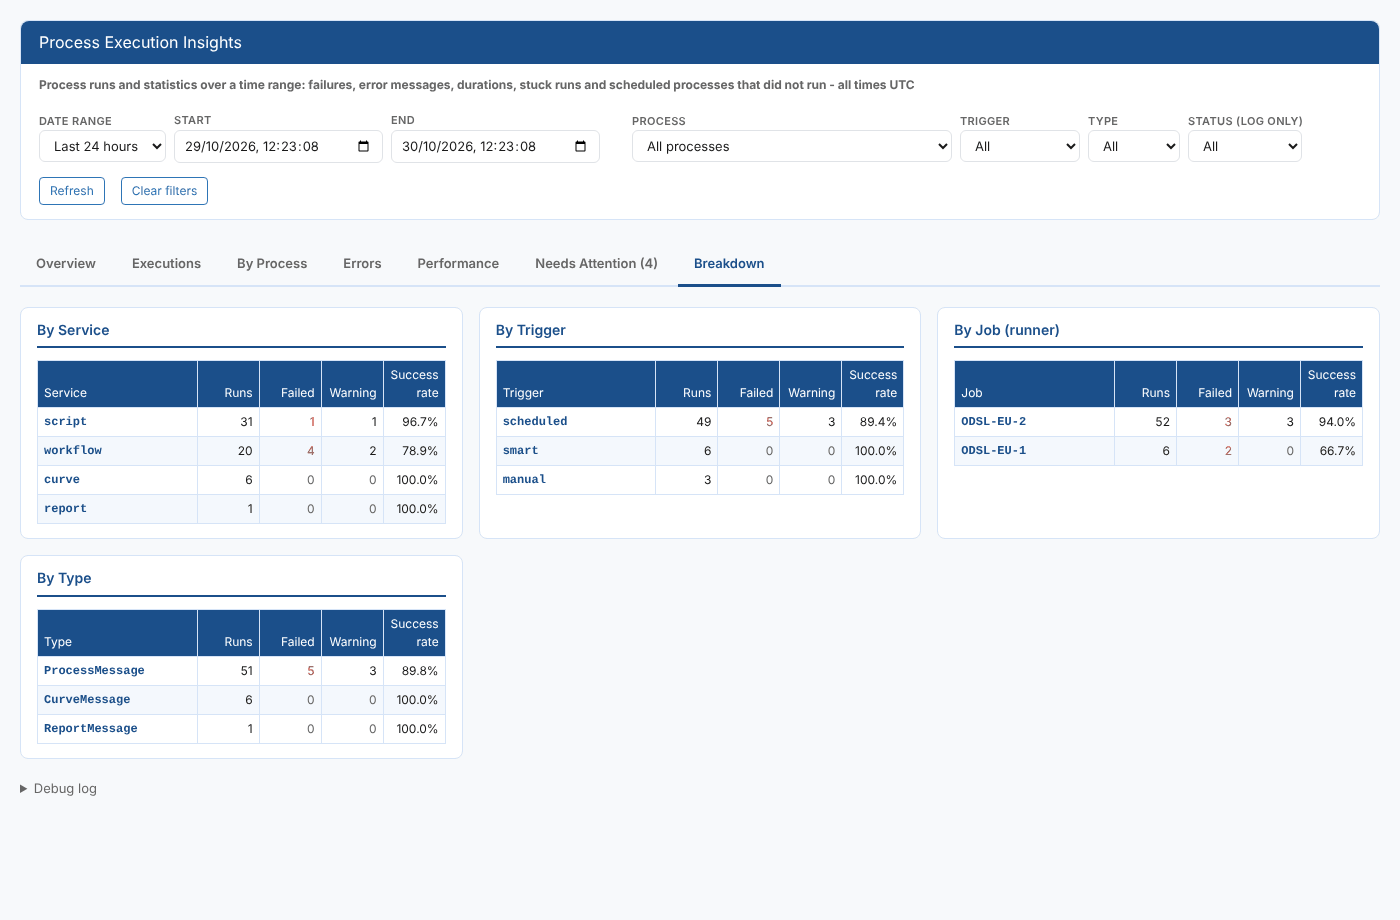
Runs, failures, warnings and success rate grouped four ways: By Service, By Trigger, By Job (runner) and By Type. Use it to see, for example, whether failures are concentrated on one runner.
Troubleshooting
| Problem | What to do |
|---|---|
| No executions match the selected filters. | Clear the filters, or choose a longer range. |
| The activity chart or Performance tab says it is based on only some of the runs | The range holds more than 10,000 runs. Choose a shorter range for full coverage. |
| Clear the Trigger and Type filters to check for scheduled processes that did not run. | Set Trigger to All and Type to All or Process. |
| A run shows as stuck but the job has finished | The run record was not closed. Check the run's phases and log on the Executions tab. |
Related
- Execution History: the runs of one process in a simple table
- Process Cron Audit Report: who changed a process schedule
- Automation Log Search: every automation that ran
- CRON expressions: how to read a schedule
- Insights: how insight reports work