Alert Audit Report
Alerts pass through several hands before they are closed: the platform or a colleague raises them, your team and OpenDataDSL comment, they are handed to a data vendor and back, and someone closes them with a resolution. The Alert Audit Report shows all of it in one place and answers questions like:
- What happened to our alerts this week, and who did it?
- What is the whole history of one alert, including our own comments on a shared alert?
- Who on the team is working on alerts, and how much?
- How long did it take for someone to respond to an alert, and to close it?
- How long were alerts with OpenDataDSL, with our team and with data vendors?
Throughout this page we follow Northgate Energy, a fictional gas and power trader: Priya Shah and Tom Clarke work on the alerts about their own data and the ICE Endex and EEX settlement data they follow.
Opening the report
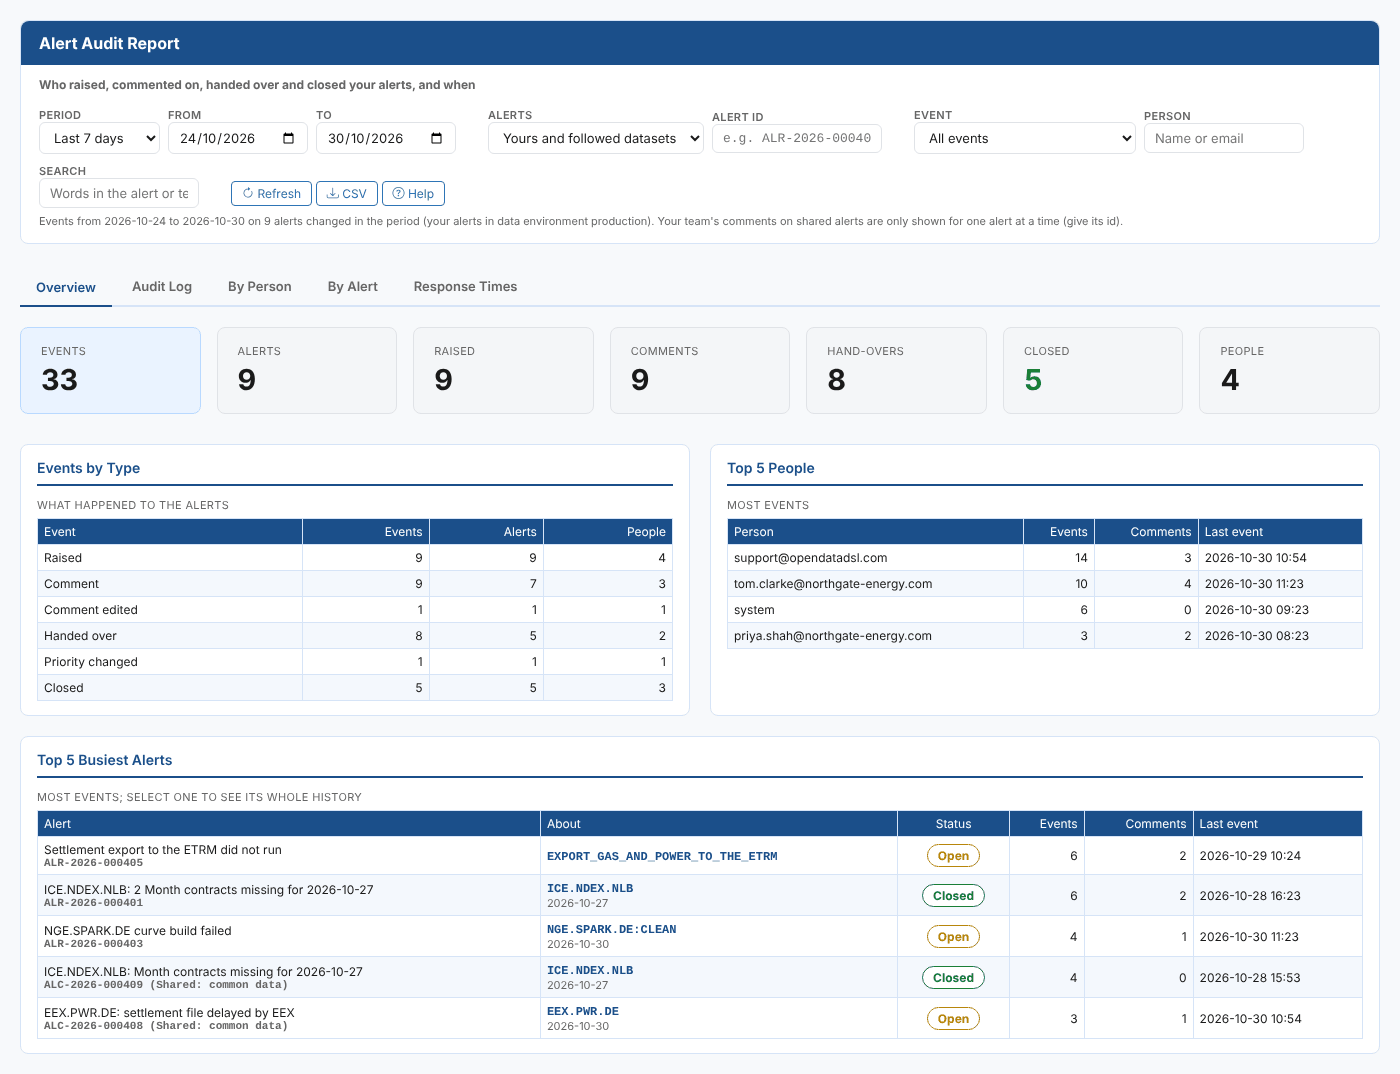
The report comes with the Alerts extension. Open Operations > Alerts, then open the screen's Insights and choose Alert Audit Report (report id odsl.alerts.audit, category odsl.alerts). It opens on the last 7 days and reads the alerts straight away.
| Control | What it does |
|---|---|
| Period | Today, Yesterday, Last 7 days (the default), Last 30 days, Last 90 days, This month, Last month or Custom |
| From, To | The first and last day of the period, both included. Changing either one switches Period to Custom |
| Alerts | Yours and followed datasets (the default), Only your alerts, or Yours and all shared alerts, as on the Alerts screen |
| Alert id | The id of one alert, such as ALR-2026-000405, to see its whole history (see One alert's history) |
| Event | All events, or only raised, comments, comment edits and deletions, hand-overs, priority changes, closed and reopened, root causes (problems folded in, recovered, linked and unlinked), or dataset configuration fixes made by OpenDataDSL |
| Person | Only the events of people whose name or email contains these words |
| Search | Only the events whose alert (id, title, dataset or item) or text contains every word, in any case |
| Refresh | Reads the alerts again |
| CSV | Downloads the events that match the filters |
| Help | Opens this page |
The line under the filters says what is shown: the period, how many alerts were read and the data environment. It also shows the progress while the report reads, and any problem.
Key ideas
| Idea | What it means |
|---|---|
| Event | One entry on an alert's timeline: raised, a comment, a comment edited or deleted, a hand-over, a priority change, closed or reopened. Every event has a time and the person who made it (system when the platform did it) |
| Your alerts | Your company's alerts in the data environment you are working in (ids starting ALR-) |
| Shared alerts | Alerts about common data (ALC-) and public data (ALP-), managed by OpenDataDSL for everyone who uses the data |
| Followed datasets | The common and public datasets your company has added to its own datasets. By default the report includes only the shared alerts about these |
| With | Who has to act next: your team, OpenDataDSL, or a data vendor such as ICE or EEX |
| First response | The first comment, hand-over or close by someone other than the person who raised the alert |
| Root cause | An alert raised by a failed data load. Problems it explains (late data, failed curves and exports) are folded into it instead of raising alerts (see Root causes) |
The tabs
Overview
| Card | What it counts |
|---|---|
| Events | Events that match the filters |
| Alerts | Alerts with at least one of those events |
| Raised | Alerts raised |
| Comments | Comments added |
| Hand-overs | Alerts handed from one party to another |
| Closed | Alerts closed |
| Folded in | Problems recorded on a root cause instead of raising alerts |
| People | Different people (and the platform) who made the events |
| Table | What it shows |
|---|---|
| Events by Type | For each kind of event: how many, on how many alerts, by how many people |
| Top 5 People | The people with the most events, their comments and their last event. Select a person to list their events in the Audit Log |
| Top 5 Busiest Alerts | The alerts with the most events, with what they are about and their status. Select an alert to see its whole history |
Audit Log
Every event that matches the filters, newest first, 50 to a page. The pager is at the top right.
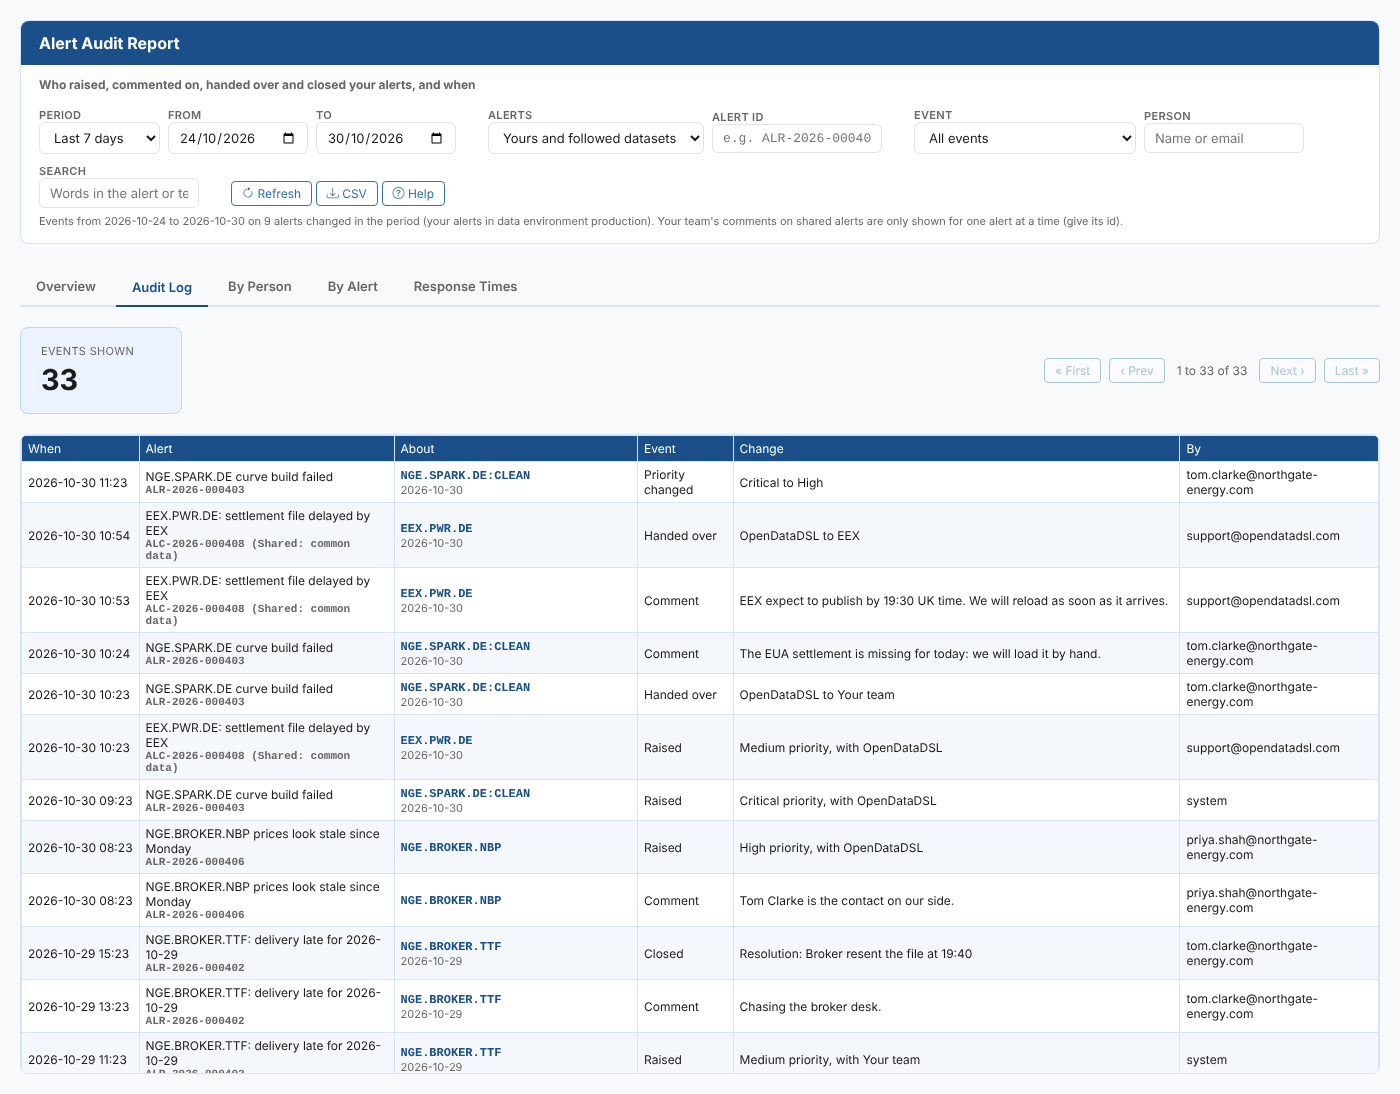
| Column | What it shows |
|---|---|
| When | The date and time of the event |
| Alert | The alert's title and id; shared alerts are marked Shared: common data or Shared: public data |
| About | The dataset, curve or other item the alert is about, and the delivery or build date |
| Event | What happened. A comment only your team and OpenDataDSL can see is marked so |
| Change | The detail: the priority and party for a raise, the comment text, the new and earlier text of an edited comment, which comment was deleted, who the alert was handed from and to, the old and new priority, and the resolution on the close of a closed alert |
| By | Who made the event |
Select a row to see that alert's whole history.
By Person
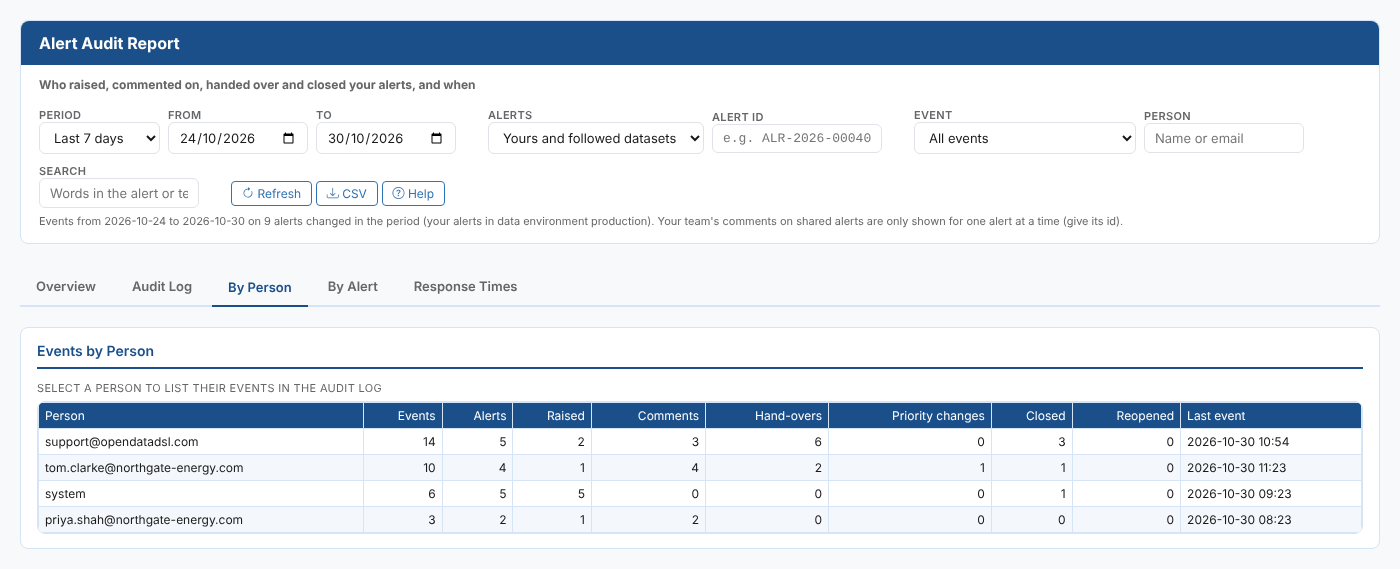
One row per person, with their events, the alerts they touched, and how many alerts they raised, commented on, handed over, changed the priority of, closed and reopened. Select a person to list their events in the Audit Log.
By Alert
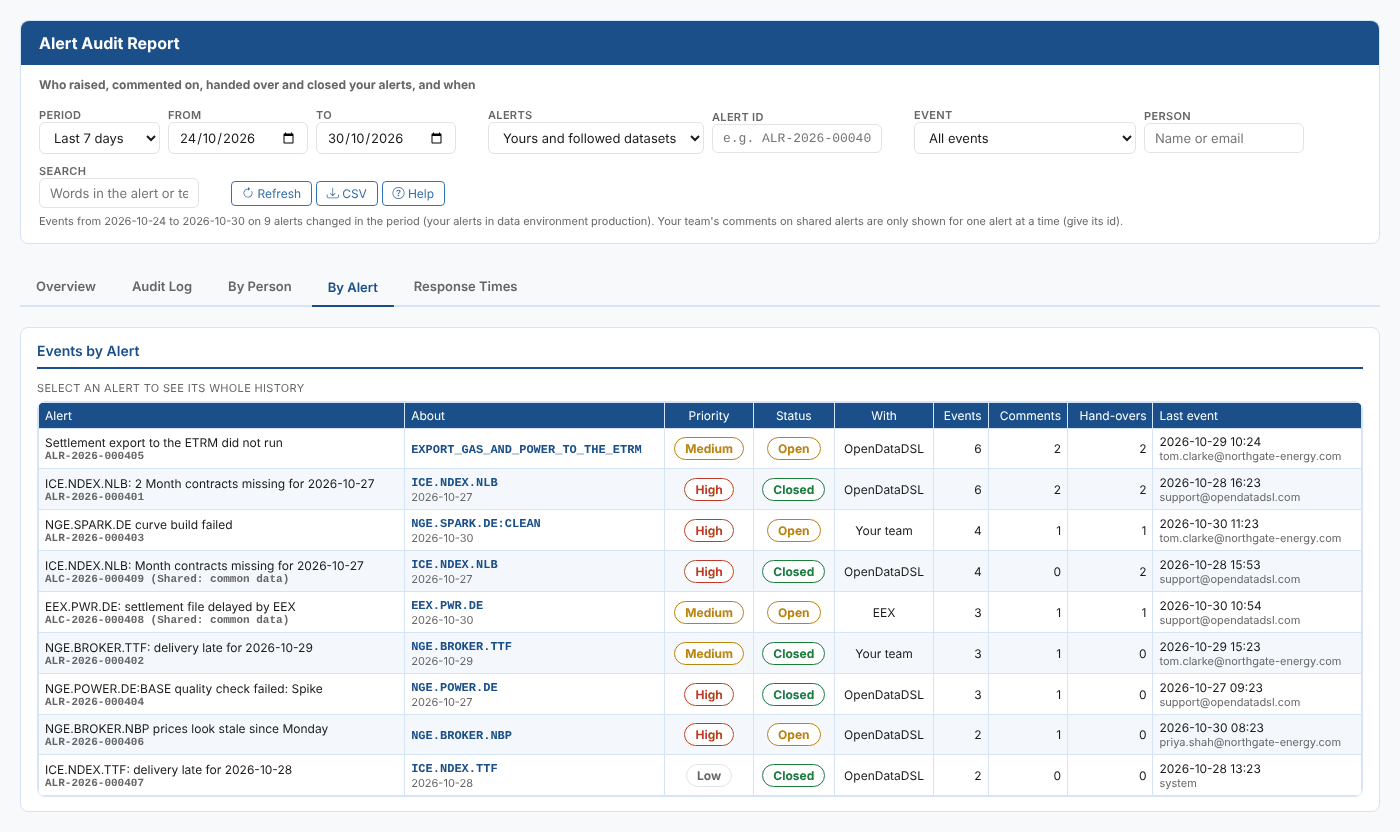
One row per alert, with its priority, status, who it is with now, its events, comments, hand-overs and last event. Select an alert to see its whole history.
Response Times
How quickly alerts raised in the period were answered and closed. Alerts raised before the period are left out, even when they changed in it.
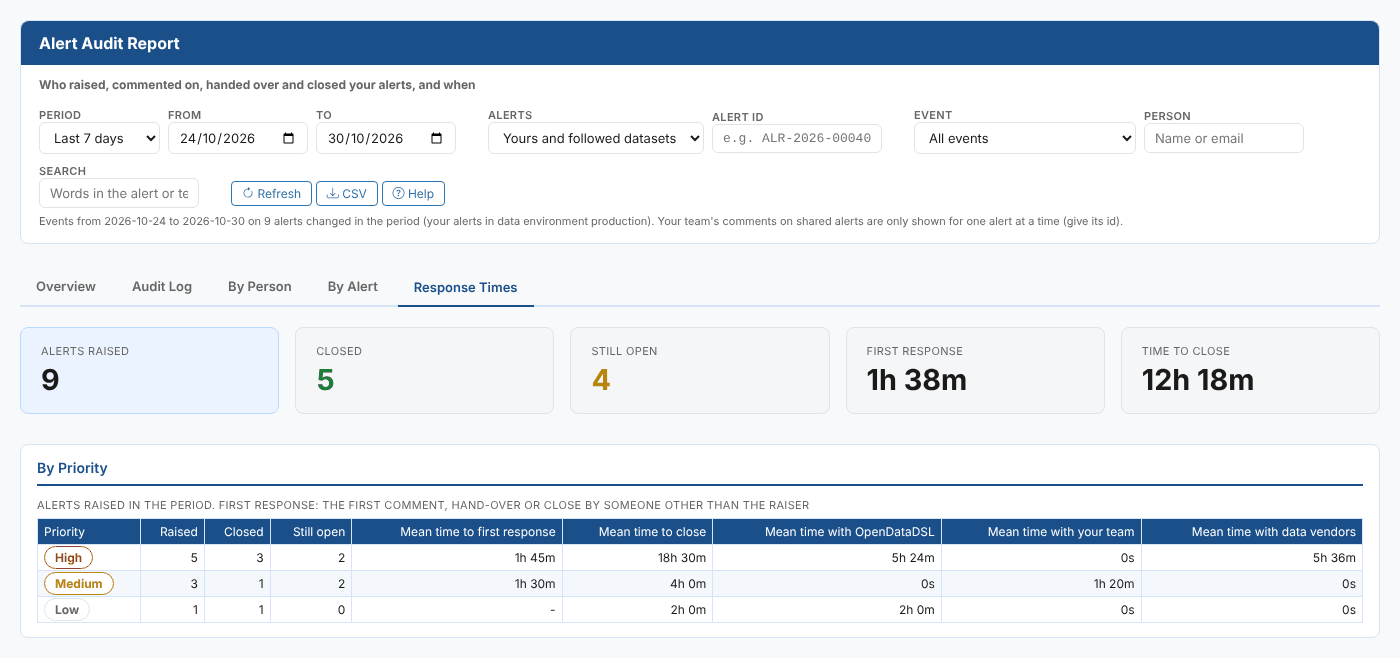
| Card or column | What it shows |
|---|---|
| Alerts raised, Closed, Still open | Alerts raised in the period that match the filters, and how many of them are closed |
| First response | The average time from raised to the first response (a comment, hand-over or close by someone other than the raiser) |
| Time to close | The average time from raised to closed, for the closed alerts |
| By Priority | The same for each priority, plus the average time each alert spent with OpenDataDSL, with your team and with data vendors |
| By Kind | The same for root causes, alerts caused by a root cause, and other alerts |
One alert's history
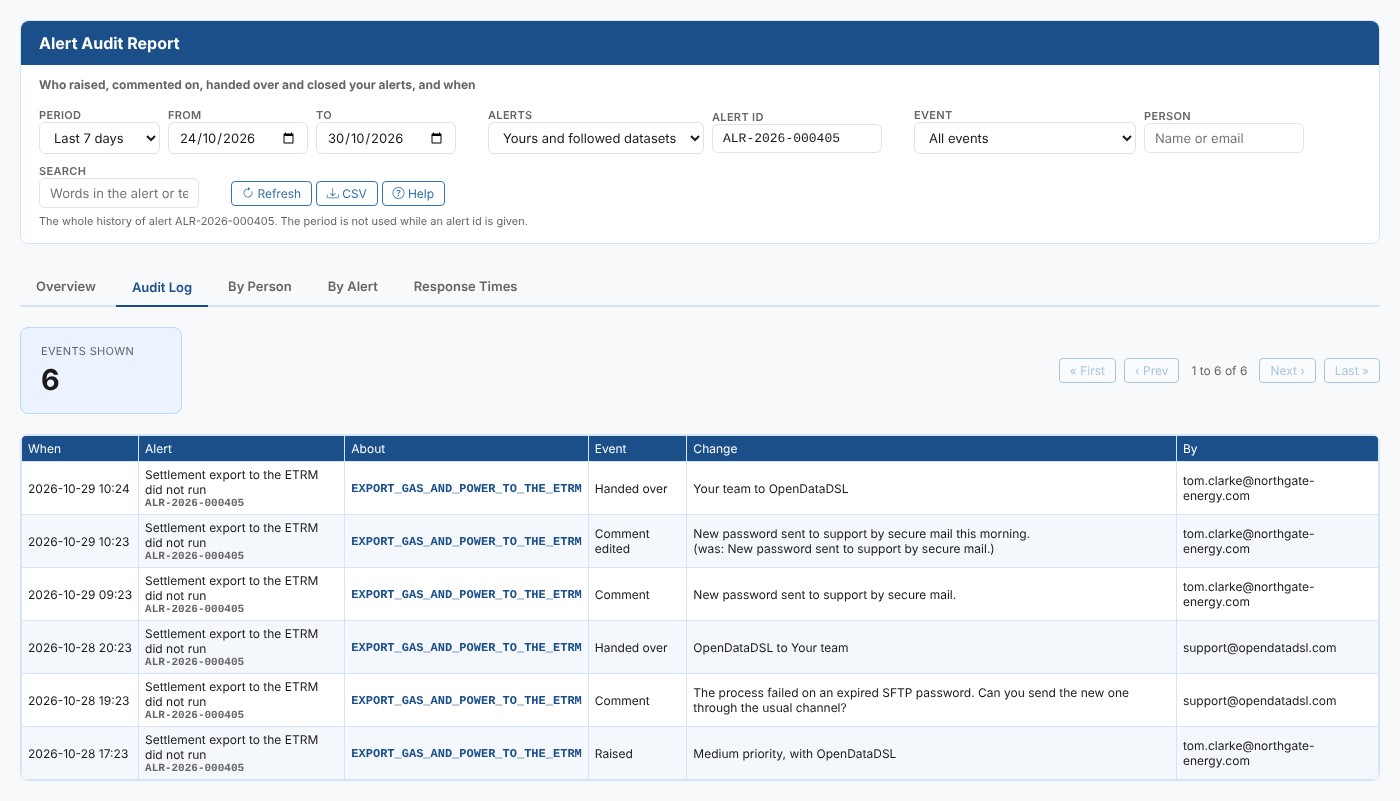
Type an alert id in Alert id (or select an alert in any table) to see everything that ever happened to that alert, from the moment it was raised. The period is not used while an alert id is given: clear the id to go back to the period.
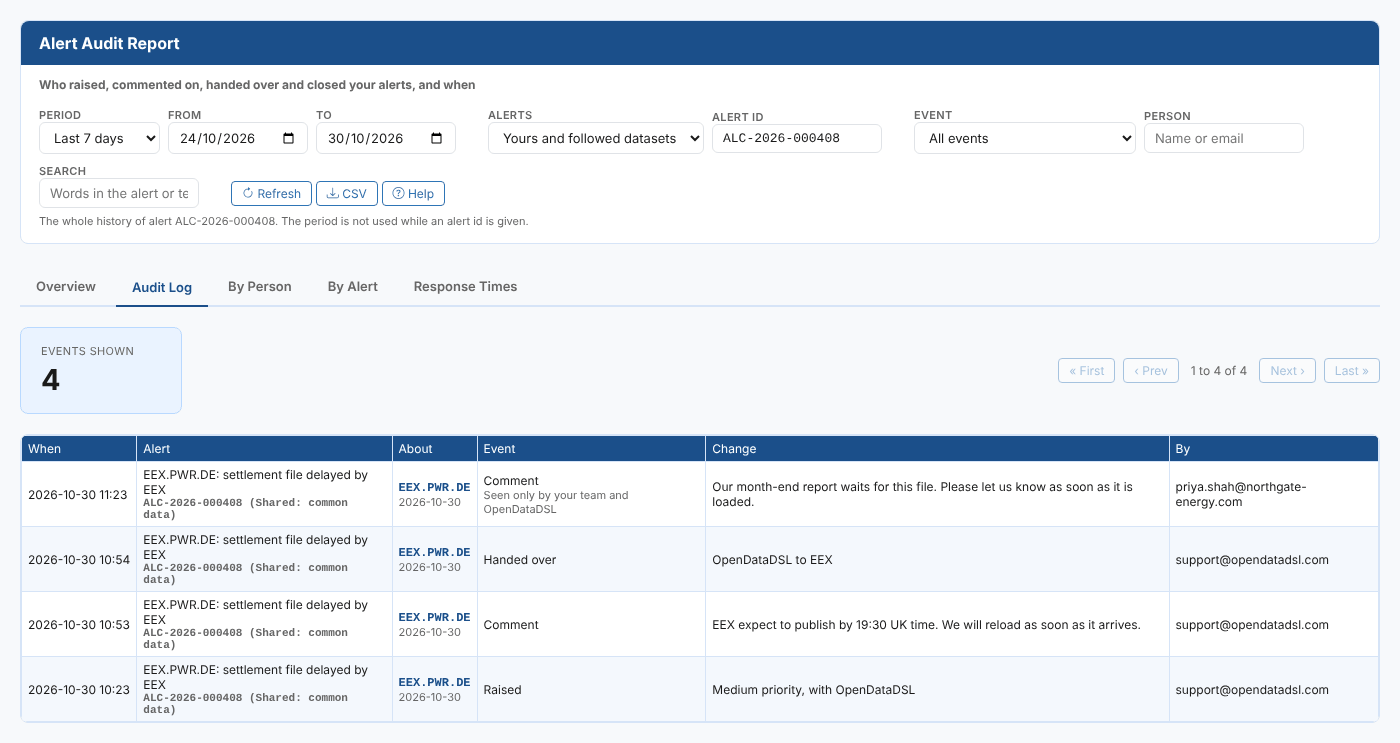
For a shared alert, the history also includes your team's own comments, which only your team and OpenDataDSL can see.
Where the data comes from
| What | Where |
|---|---|
| Events | The timelines of the alerts themselves, read from the alert service (alert/v1/private, common and public). Every change to an alert is written to its timeline by the platform, so this is the alert's complete history |
| Alerts read for a period | The alerts changed in the period that were raised before its end, up to 1,000 per source (yours, common, public), most recently changed first. Only their events inside the period are shown |
| One alert | The alert read by its id, from the source its id belongs to |
| Response times | The alert's raised and closed times, and the time with each party that the platform measures for every alert |
| Problems folded into root causes | Kept apart from the alerts: read for the period with the alert service's impacts function and shown as events on their root cause (Problem folded in, Problem recovered). For one alert, they are part of its history |
Your team's comments on shared alerts are kept apart from the shared alert, so they appear only in one alert's history, not in the period view.
Reading the numbers
| You see | It means |
|---|---|
| A raise is missing for an alert in the Audit Log | The alert was raised before the period and changed in it. Give its id to see its whole history |
system in By | The platform made the change, for example dataset monitoring closing a completeness alert when the data arrived |
| - for a time | Nothing to average, for example no closed alerts for Time to close |
| 0s time with a party | The alerts were never with that party |
| A note that only the 1,000 most recently changed alerts are included | More alerts changed in the period. Choose a shorter period |
Permissions
The report shows what the alert service lets you read: your company's alerts in the data environment you are working in, and the shared alerts. The Alerts extension installs the security policies for this. If the report says you do not have access to alerts, ask your administrator to install the extension or add you to its policies.
Troubleshooting
| Problem | What to do |
|---|---|
| Not an alert id | Alert ids look like ALR-2026-000401 (ALC- and ALP- for shared alerts) |
| Alert ... was not found, or it is not one of yours | Check the id, and that you are in the data environment the alert belongs to |
| Choose a period | The From date is after the To date |
| A shared alert you expect is missing | With Yours and followed datasets, only shared alerts about the datasets you follow are included. Choose Yours and all shared alerts |
| An alert from another data environment is missing | Your alerts belong to a data environment. Switch environment in the portal |
Related
- Insights: how insight reports work
- Alerts extension: see and work on your alerts
- Alerts reference: the fields of an alert and its timeline entries