Loaded Time Analysis
To set a sensible expected time for a dataset, or to know when you can safely run the curves that depend on it, you need to know when the data really arrives. The Loaded Time Analysis report counts the times a dataset has been loaded and answers questions like:
- At what time does this dataset usually load?
- How often does it arrive late, and how late?
- Is the expected time configured for the dataset realistic?
At Northgate Energy, Priya Shah uses it on ICE.NDEX.TTF to decide when the evening curve build process NGE_EOD_CURVES can start.
Opening the report
This is a dataset insight. Select a dataset on the Dataset Monitoring screen, then choose Loaded Time Analysis from its insights (category Dataset Monitoring Insights). Its report id is #DMI_LOADEDTIME, and the dataset is passed in the DSID report property.
The report opens on Last 30 days and loads straight away.
| Control | What it does |
|---|---|
| Date range | Today, Yesterday, Last 7 days, Last 30 days, Last 60 days, Last 90 days, This month, Last month or All |
| Start, End | The on dates to include. Only the date part is used. |
| Export (CSV) | Downloads the table as loaded-times.csv |
The report
| Part | What it shows |
|---|---|
| Loaded time buckets card | How many different loaded times appear in the range |
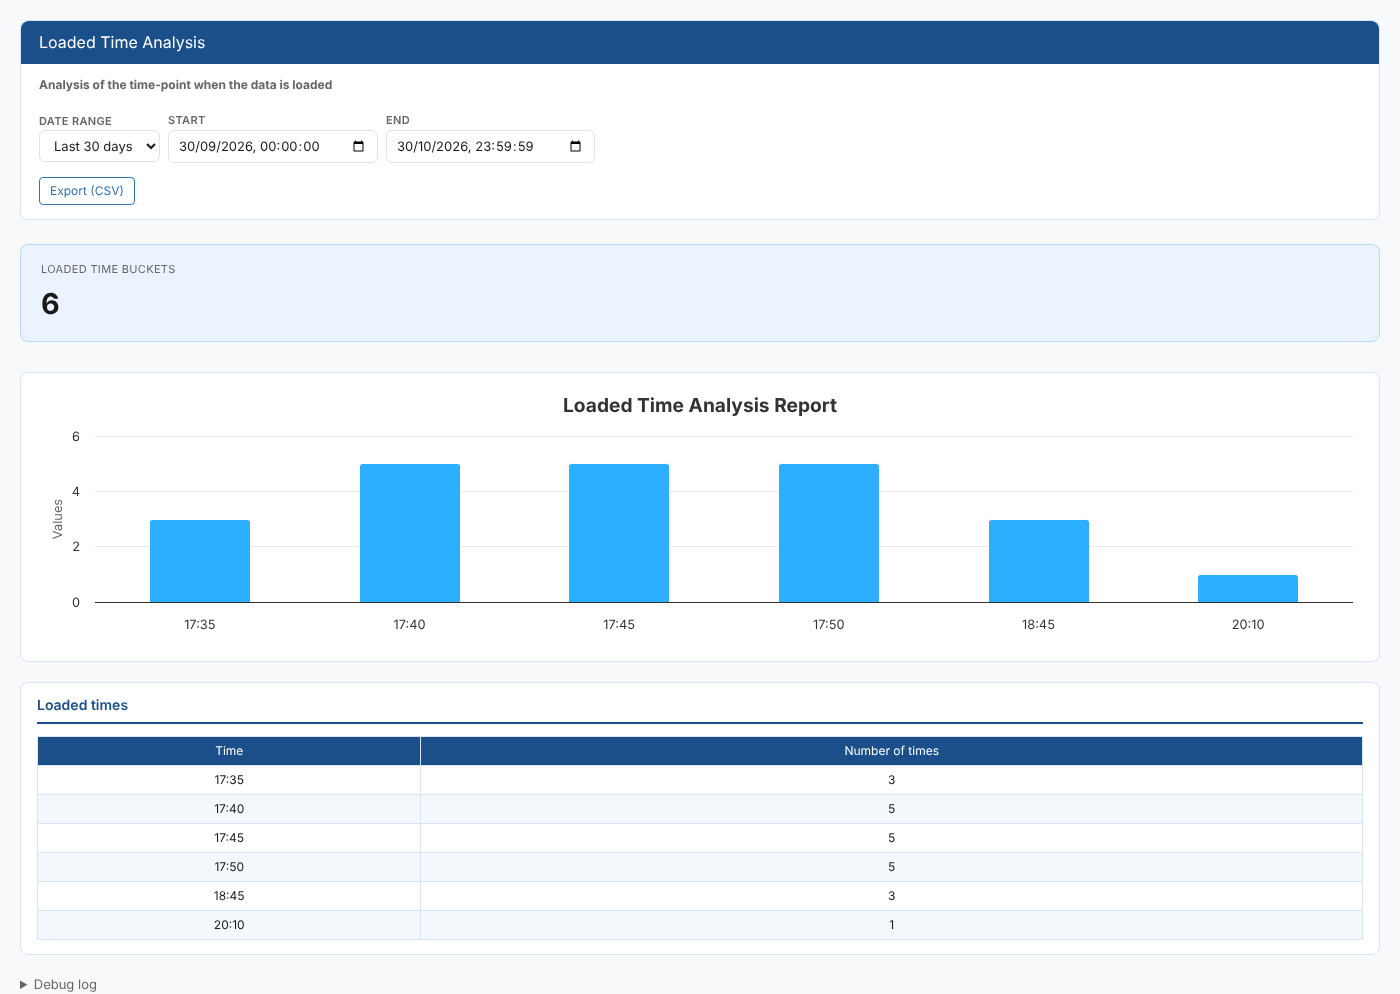
| Loaded Time Analysis Report chart | One column per loaded time, in time order, as high as the number of deliveries loaded at that time |
| Loaded times table | Time and Number of times |
Each loaded time is the time recorded on the delivery when its data was loaded, to the minute. Deliveries are counted exactly at that time, not grouped into wider bands, so a dataset that loads anywhere between 17:35 and 17:50 shows a column for each minute it actually loaded.
At Northgate, most ICE.NDEX.TTF deliveries in October loaded between 17:35 and 17:50, with three at 18:45 and one at 20:10. Priya starts NGE_EOD_CURVES at 18:00 and relies on the dataset's late event for the rest.
Choose Last 90 days or All to see a dataset's usual pattern; a short range can be dominated by one bad week.
Where the data comes from
The report groups the dataset's dataset_delivery records in the range by timings.loaded on the server, leaving out deliveries without a loaded time. It first reads the dataset's settings (dataset service, info source) to find where its delivery records are kept.
Related
- Delivery Scores: how timely each day's delivery was
- Tenor Delivery: which tenors were delivered each day
- Data Monitoring: expected and late times, and the late event
- Insights: how insight reports work