Data Environment Summary
Most teams keep more than one data environment: production for live data, a UAT environment where users sign off changes, test environments for building new curves and scripts, and preview for the next platform release. Over time it gets hard to say what is actually in each one. The Data Environment Summary report puts every environment side by side and answers questions like:
- How much master data, how many curves and timeseries, and how many events does each environment hold?
- Which environments differ from production, and by how much?
- Has UAT got the new types and scripts that are waiting to go live?
- Where did work last happen, and who did it?
- Which items changed most recently in a test environment?
Throughout this page we follow Northgate Energy, a fictional gas and power trader with four environments: production, preview, uat (user acceptance testing) and test1 (curve development).
Opening the report
The report is in the Reports menu, in the Environments category, as Data Environment Summary. It is a public report (#INSIGHT_ENVIRONMENT_SUMMARY), so it is available in every tenant.
The report reads every environment, whichever environment you open it in. It starts counting as soon as it opens: the line under the filters shows its progress (for example Counting items: 24 of 72 requests) and then the time it finished. The tables fill in as the counts arrive.
| Control | What it does |
|---|---|
| Environments | All environments, or All except preview to leave the preview environment out |
| Refresh | Counts everything again |
| Help | Opens this page |
| Request details | At the bottom of the page: any request that failed, with the reason the platform gave |
Key ideas
| Idea | What it means |
|---|---|
| Data environment | A separate copy of your private data, with its own master data, curves, scripts, processes and security policies. The environments are listed by the platform's environment service; production is always first. |
| Private items only | Each environment has its own private database. Public and common data (shared calendars, public types, common datasets) is the same in every environment, so it is not counted. |
| Service | A kind of item, such as master data, scripts or automations. The report counts 18 services, listed under What is counted. |
| Difference from production | For every environment other than production, how many more or fewer items it holds than production. |
The tabs
Overview
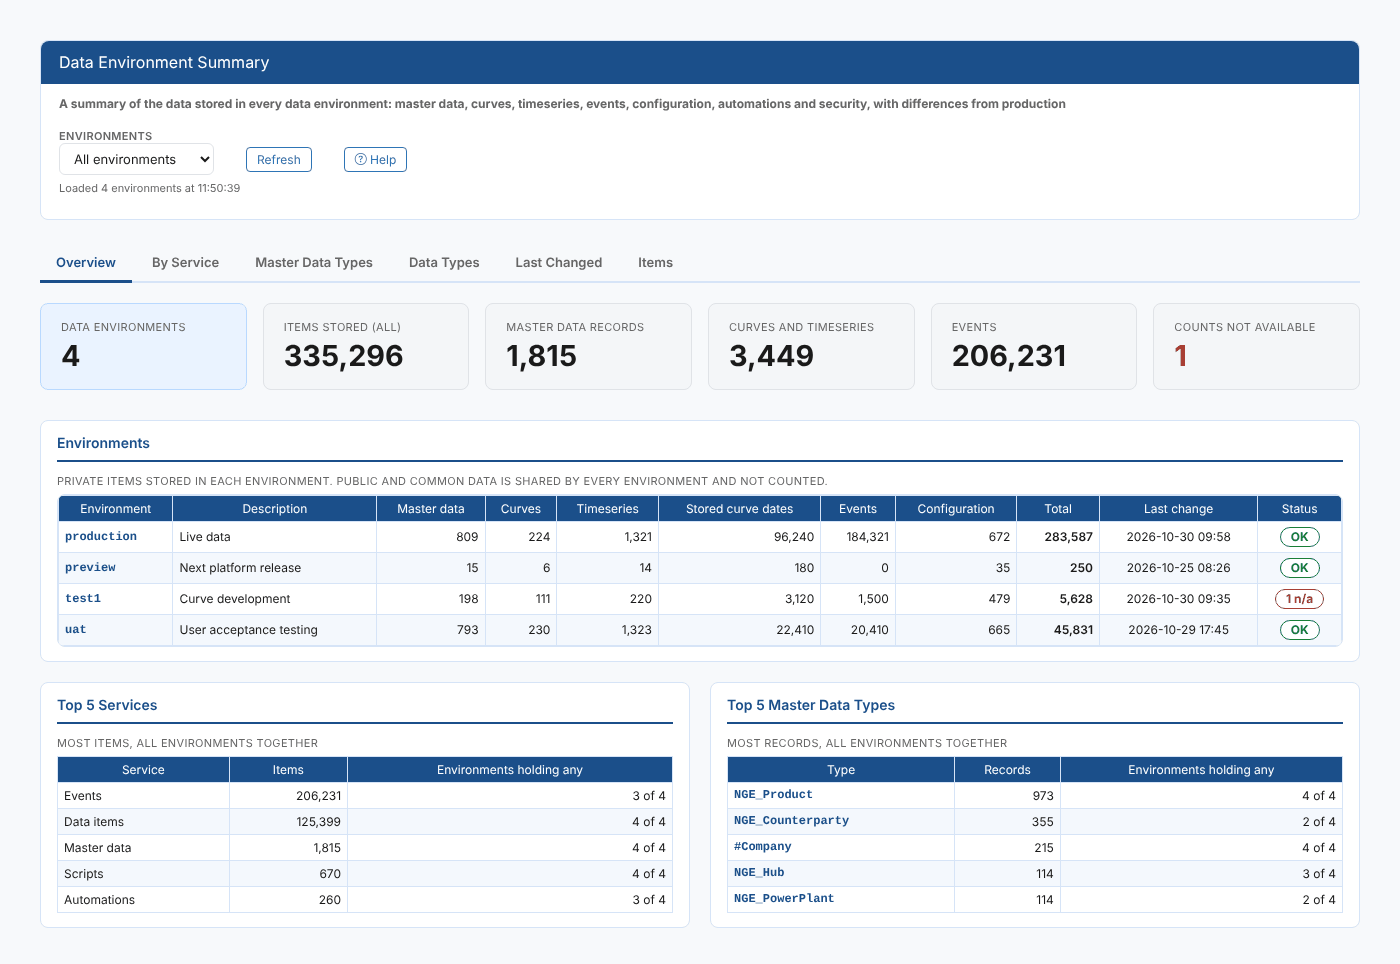
The KPI cards add up all environments:
| Card | What it counts |
|---|---|
| Data environments | The environments included |
| Items stored (all) | Every item counted, in every service and environment |
| Master data records | Records in the object service |
| Curves and timeseries | Curve and timeseries definitions: curves, smart, event and composed curves, timeseries, smart and event timeseries. Stored curves for each ondate are not included here. |
| Events | Events in the event service |
| Counts not available | Services that could not be counted. Green when there are none. |
The Environments table has one row per environment:
| Column | What it shows |
|---|---|
| Master data, Curves, Timeseries | As in the cards, for this environment |
| Stored curve dates | The stored curves, one for each curve and ondate |
| Events | Events in this environment |
| Configuration | Every other service added up: types, calendars, scripts, reports, processes, automations, groups, security policies and so on |
| Total | Everything in this environment |
| Last change | The newest change to any item in this environment |
| Status | OK when every service was counted, or the number of services that were not (n/a) |
Under it, Top 5 Services and Top 5 Master Data Types show what takes up the most room across all environments, and in how many environments each one is held.
At Northgate, test1 shows 1 n/a: the curve development team has no read access to security policies there.
By Service
A grid with one row per service and one column per environment, grouped into Master data and data, Configuration, Automation and processing and Security. Under each count is its difference from production, or same when the numbers match.
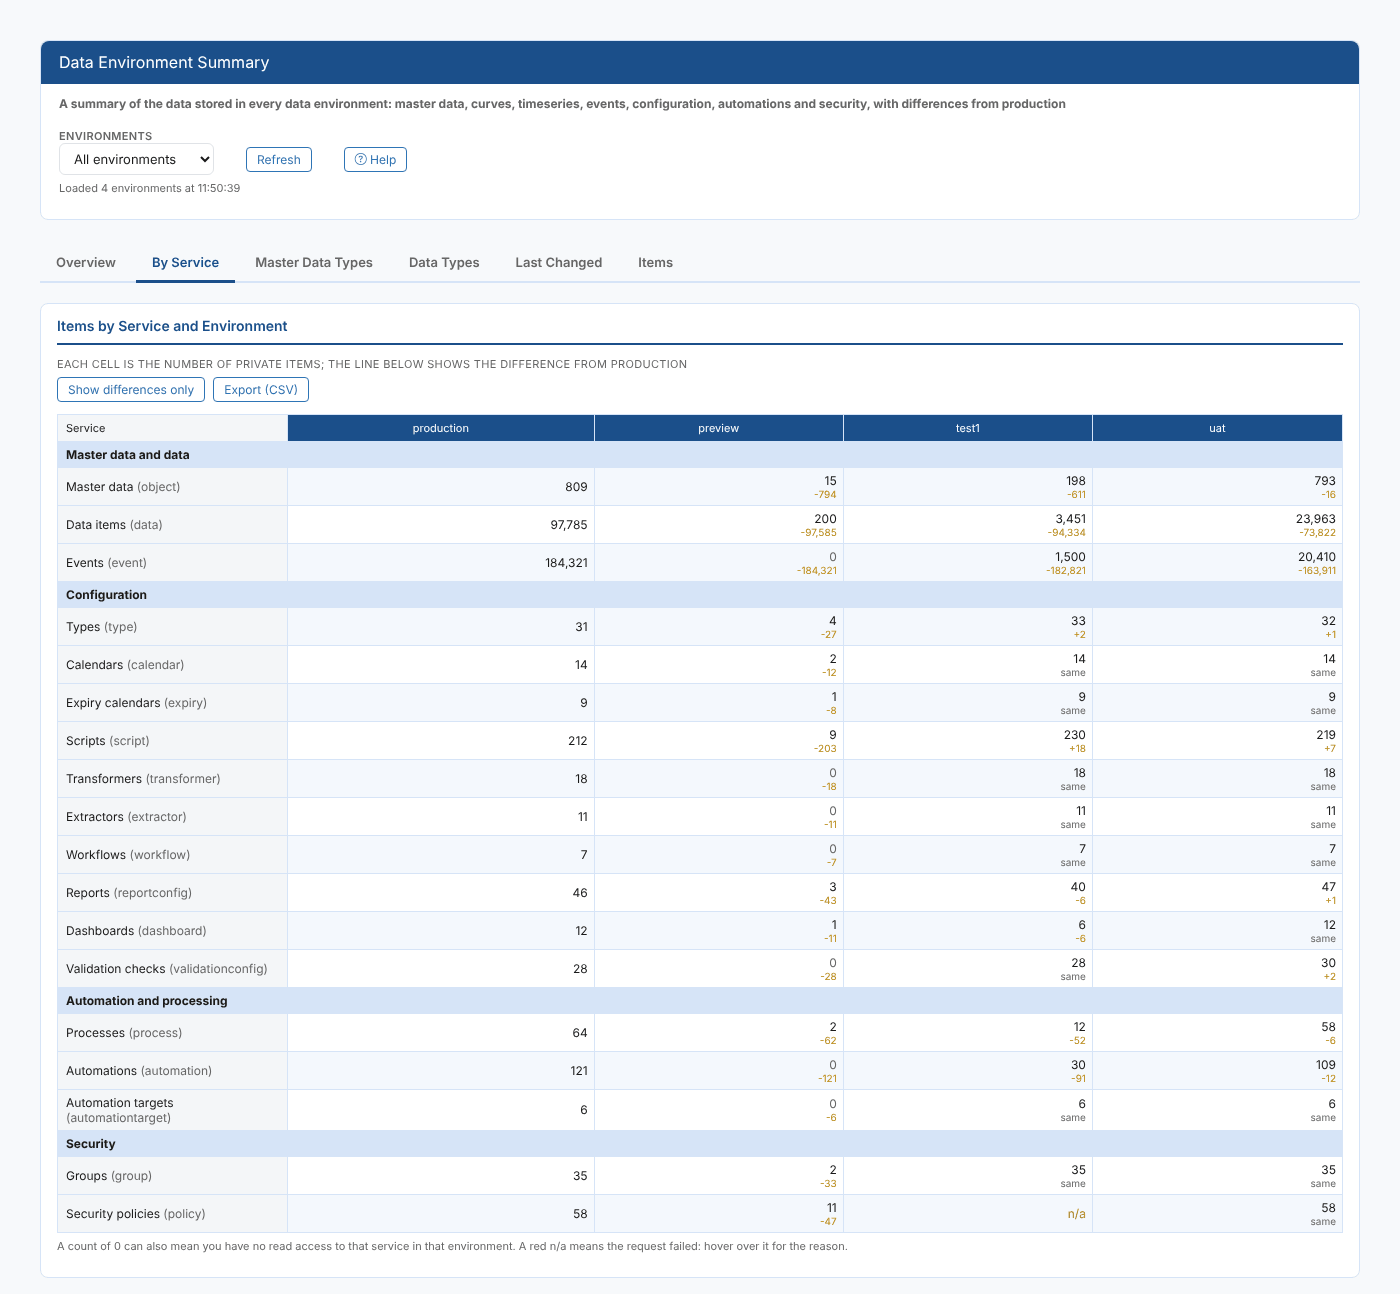
Select Show differences only to hide the services that hold the same number of items everywhere. At Northgate this quickly shows that uat has one more type, seven more scripts and two more validation checks than production: the changes waiting to be promoted.
The same count does not mean the same items. An environment can have the same number of scripts as production with different versions or different ids. Use the Promotion extension to compare and push items between environments.
Master Data Types
Master data records by type in each environment, largest first, with a total column. Type in Filter types to narrow the list: every word you type must appear in the type name.
Data Types
Two grids. Curves and Timeseries by Type shows each kind of curve and timeseries definition, and the stored curve dates. Events by Type shows the events.
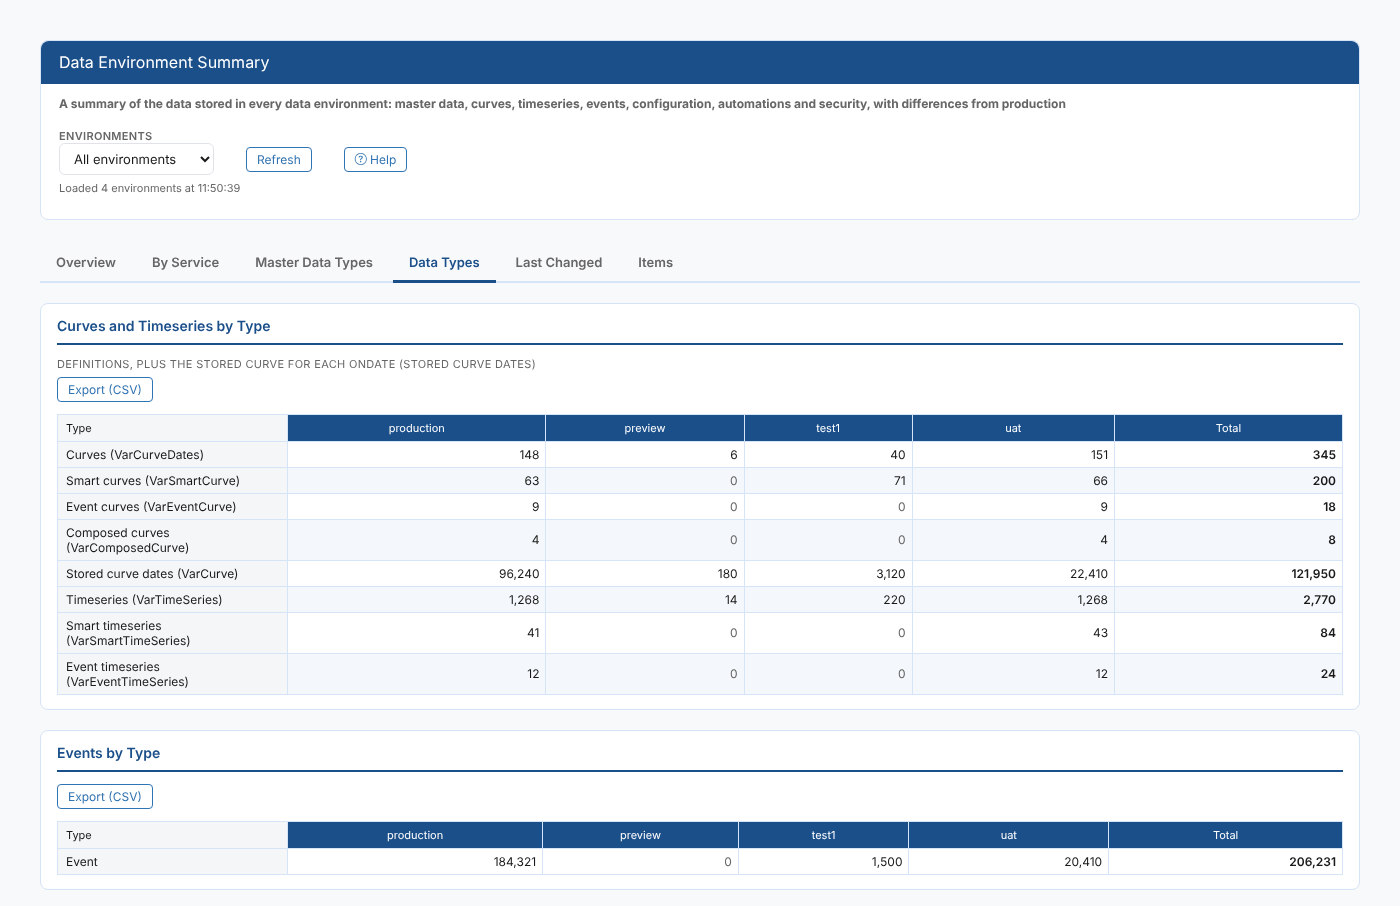
Stored curve dates usually account for the biggest difference between environments: production stores a curve every day, while a test environment only has the dates someone built there.
Last Changed
For each service and environment, when an item was last changed and who changed it. The newest change in each row is in bold, so you can see at a glance where work last happened. Hover over a cell to see the id of the item that changed.
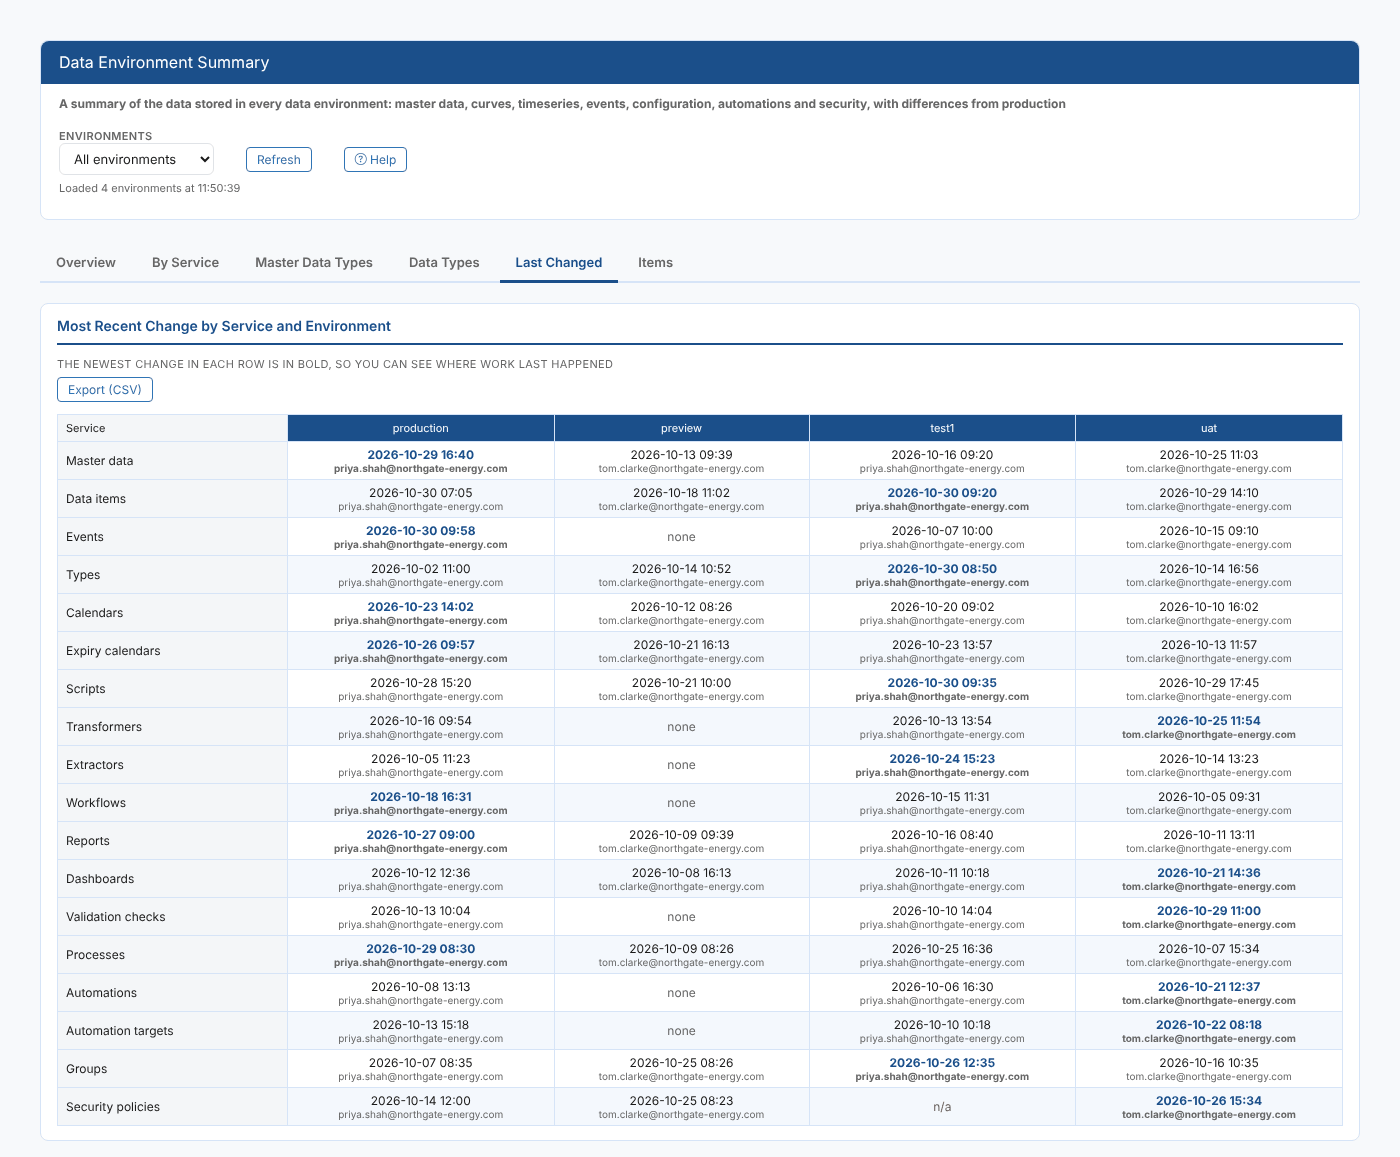
This tab is loaded the first time you open it, with one small request per service and environment.
Items
A list of the items of one service in one environment, most recently changed first, 50 to a page.
| Control | What it does |
|---|---|
| Environment | The environment to list. It starts on the environment you opened the report in. |
| Service | The service to list |
| Id or name contains | Shows only items whose id or name contains this text (any case) |
| First, Prev, Next, Last | Move between pages |
| Export (CSV) | Downloads every matching item, up to 10,000, not just the page on screen |
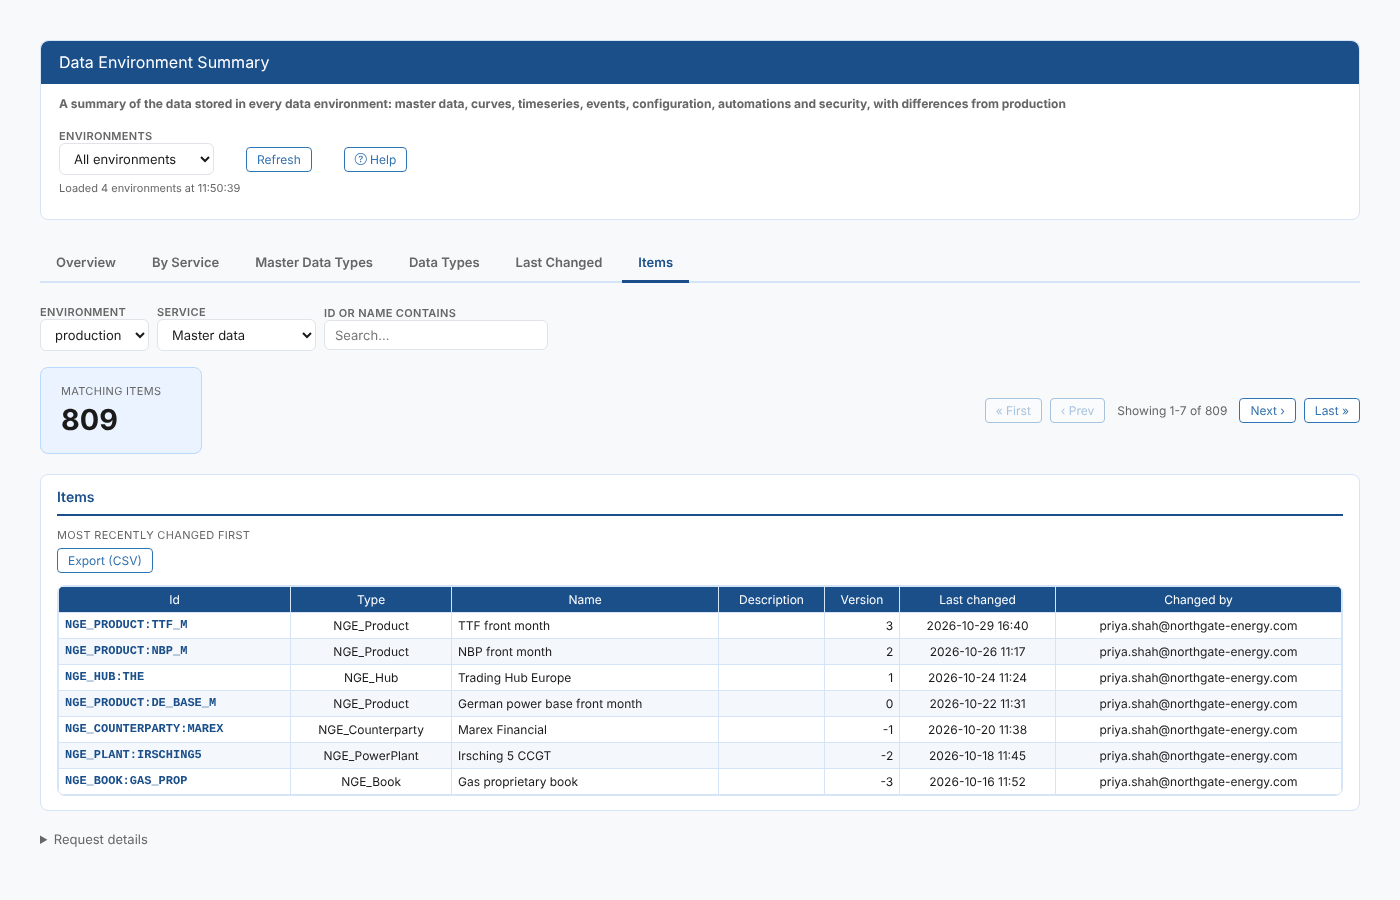
Some services do not report how many items match. The Matching items card then shows Over a number, Last is disabled, and Next works until a page comes back with fewer than 50 items.
What is counted
| Group | Service | Label in the report |
|---|---|---|
| Master data and data | object | Master data |
data | Data items (curves, timeseries and stored curve dates) | |
event | Events | |
| Configuration | type, calendar, expiry | Types, Calendars, Expiry calendars |
script, transformer, extractor, workflow | Scripts, Transformers, Extractors, Workflows | |
reportconfig, dashboard, validationconfig | Reports, Dashboards, Validation checks | |
| Automation and processing | process, automation, automationtarget | Processes, Automations, Automation targets |
| Security | group, policy | Groups, Security policies |
Reading the numbers
| You see | What it means |
|---|---|
| A number | The private items of that service in that environment |
| 0 | There are none, or you have no read access to that service in that environment. The platform returns an empty list rather than an error when your security policies in an environment do not cover a service. |
| A red n/a | The request failed. Hover over it for the reason, or open Request details at the bottom of the page. |
| ... | Still counting |
| same under a count | The environment holds as many items of that service as production |
Every grid has an Export (CSV) button, which downloads the grid as you see it, without the difference lines.
Permissions
The report can only count what you are allowed to read. Your read access comes from the security policies of each environment, so the same person can see everything in production and only part of a test environment. If a whole environment shows zeros, ask your administrator whether you have access to it.
Troubleshooting
| Problem | What to do |
|---|---|
| An environment is missing | Check that it is listed by the environment service. The preview environment is hidden when Environments is set to All except preview. |
| Every count in an environment is 0 | You probably have no read policies in that environment. |
| Could not read the data environments | The environment list could not be read from production. The message includes the reason the platform gave. |
| The counts look out of date | Select Refresh. The report counts when it opens and does not update by itself. |